Major Element, Trace Element, and Isotope (Pb, Sr, and Nd) Geochemistry of Site 839 Basalts and Basaltic Andesites: Implications for Arc Volcanism (original) (raw)
Abstract
New major, trace element, and isotope data (Pb, Sr, and Nd) reveal an impressive compositional variation in the basalts recovered from Site 834. Major element compositions span almost the entire range observed in basalts from the modern axial systems of the Lau Basin, and variations are consistent with low-pressure fractionation of a mid-ocean-ridge-basalt (MORB)-like parent, in which Plagioclase crystallization has been somewhat suppressed. Trace element compositions deviate from MORB in all but one unit (Unit 7) and show enrichments in large-ion-lithophile elements (LILEs) relative to high-field-strength elements (HFSEs) more typically associated with island-arc magmas. The Pb-isotope ratios define linear trends that extend from the field of Pacific MORB to highly radiogenic values similar to those observed in rocks from the northernmost islands of the Tofua Arc. The Sr-isotope compositions also show significant variation, and these too project from radiogenic values back into the field for Pacific MORB. The variations in key trace element and isotopic features are consistent with magma mixing between two relatively mafic melts: one represented by Pacific MORB, and the other by a magma similar to those erupted on 'Eua when it was part of the original Tongan arc, or perhaps members of the Lau Volcanic Group (LVG). Based on our model, the most radiogenic compositions (Units 2 and 8) represent approximately 50:50 mixtures of these MORB and arc end-members. Magma mixing requires that both components are simultaneously available, and implies that melts have not shown a compositional progression from arc-like to MORB-like with extension at this locality. Rather, it is apparent that essentially pristine MORB can erupt as one of the earliest products of backarc initiation. Indeed, repetition of isotopic and trace element signatures with depth suggests that eruptions have been triggered by periodic injections of fresh MORB melts into the source regions of these magmas. The slow and almost amagmatic extension of the original arc complex envisaged to explain the observed chemistry is also consistent with the horst-and-graben topography of the western side of the Lau Basin. Given the similarities between basalts erupted at the modern Lau Basin spreading centers and MORB from the Indian Ocean, the overwhelming evidence for involvement of mantle similar to Pacific MORB in the petrogenesis of basalts from Site 834 is a new and important observation. It indicates that the original arc was underlain by asthenospheric material derived from the Pacific mantle convection cell, and that this has somehow been replaced by Indian Ocean MORB during the last-5.5 Ma.
Figures (22)

Figure 1. General geography of the Lau Basin area indicating the location of Site 834 in relation to the Lau Ridge, the Tonga Ridge, and the “Central” and “Eastern” Lau Spreading Centers (CLSC and ELSC, respectively; collectively termed “modern Lau” or “ML” in this study), The dashed line extending from the Peggy Ridge to the Valu Fa Ridge approximates the division between horst-and-graben topography (in the west) from new crust formed by true seafloor spreading (to the east). The position of this line is based on the work of Parson and Hawkins (this volume) and also represents the locus of the southward-propagating ELSC ridge tip. Light and dark shading is used to represent regions between 2000-500 mbsf and 500-0 mbsf, respectively. The darkest gray is used to indicate neovolcanic zones (e.g., ELSC and CLSC); except for the drill sites, black depicts land.

Table 1. Representative plagioclase compositions obtained for Units 5, 7, and 12. Notes: Unit 5: adjacent “c” and “r" are cores and rims of large grains, respectively; “1” = small laths enclosed within poikilitic clinopyroxene grains. Unit 7: “I” = lath-shaped microlite adjacent “c” and “r” are cores and rims of equant phenocrysts, respectively. Unit 12: all analyses are of small microlites in the glassy rim.

Figure 2, Major element compositions (in wt%) samples from Site 834. The stippled field represents the range for MORB compiled by Hochstaedter et al. (1990), which includes data from Byerly et al, (1976), Byers et al, (1983), Schilling et al. (1983), Bender et al. (1984), le Roex et al. (1985), and Christie and Sinton (1986). Bold lines enclose fields for data from the modern spreading centers in the Lau Basin (ELSC and CLSC). Data sources are Ernewein et al. (in press), Hawkins and Allan (this volume), and Hawkins (unpubl. data). For a comparison between samples from Site 834 and the other sites drilled during Leg 135, the reader is referred to the introductory chapter of Parson, Hawkins, Allan, et al. (1992). ML = modern Lau Basin.

Table 2. Representative clinopyroxene compositions obtained for Unit 5.

Notes: All analyses are of small, euhedral grains with no evidence for oxyexsolution o1 alteration. Only data from Unit 12 are from phenocrysts in the glassy rim; the other data are from interstitial grains. Table 3. Representative oxide compositions obtained for Subunits 2a an 10a and Units 5, 7, and 12.

*Single anomalous composition in Subunit 10a. Table 4. Major element compositions for Site 834 glasses.

Table 5. Trace element and isotopic data for selected representative samples from Site 834.


Figure 3. N-MORB normalized trace element compositions of representative samples from each unit recovered at Site 834. Normalizing values used are those for the N-MORB listed in Sun and McDonough (1989). Although similar in shape, subtle differences in the degree of enrichment is evident between units shown in Figures 3A and 3B (see text). Contrasting with all other units is the smooth, more MORB-like pattern of Unit 7 (Fig. 3C).

Figure 4. Variations among Ba, Rb, and MgO. Note the strong correlations between Ba and MgO and for Ba vs. Rb as well as the absence of any covariation between the Ba/Rb ratio and MgO content. Symbols represent individual unit designations and are as follows: Unit 2 (open square), Unit 5 (open circle), Unit 6 (open diamond), Unit 7 (filled diamond), Unit 8 (filled triangle), Unit 10 (open triangle), Unit 11 (filled circle), Unit 12 (filled square), and Unit 13 (crosses).
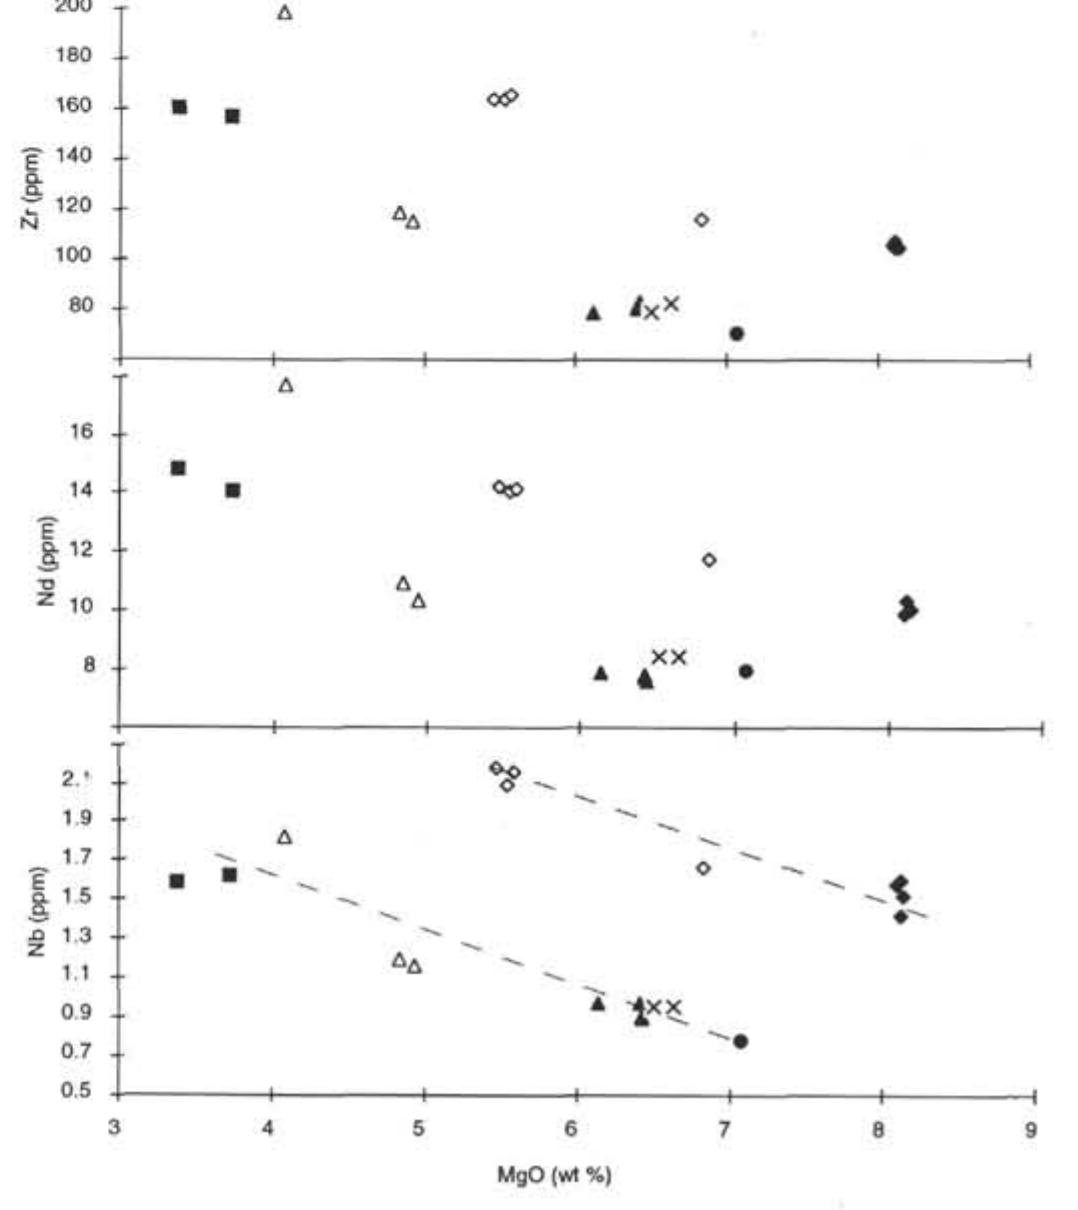
Figure 5. Apparently scattered variations between HFSEs and REEs with MgO, which may actually represent subparallel evolutionary trends (as suggested by the use of dashed lines in the plot of Nb vs. MgO). Symbols as in Figure 4.
![Figure 6. Sr- vs. Nd-isotopic ratios for Site 834 samples shown relative to fields for Pacific and Indian MORB, volcanics from the Lau Ridge (LVG; Cole et al., 1990), Tofua Arc (Ata, Tafahi, and Niuatoputapu indicated; data from Ewart and Hawkesworth [1987] and J.M. Hergt, unpubl. data, 1989), and samples from the modern Lau Basin spreading centers (Volpe et al., 1988; Loock et al., 1990; J.M. Hergt, unpubl. data, 1989). The forearc island of *Eua is also shown (McCulloch, unpubl. data, from Cole et al., 1990). Symbols as in Figure 4. ML = modern Lau Basin.](https://figures.academia-assets.com/113454265/figure_006.jpg) ](
](Figure 6. Sr- vs. Nd-isotopic ratios for Site 834 samples shown relative to fields for Pacific and Indian MORB, volcanics from the Lau Ridge (LVG; Cole et al., 1990), Tofua Arc (Ata, Tafahi, and Niuatoputapu indicated; data from Ewart and Hawkesworth [1987] and J.M. Hergt, unpubl. data, 1989), and samples from the modern Lau Basin spreading centers (Volpe et al., 1988; Loock et al., 1990; J.M. Hergt, unpubl. data, 1989). The forearc island of *Eua is also shown (McCulloch, unpubl. data, from Cole et al., 1990). Symbols as in Figure 4. ML = modern Lau Basin.

Figure 8. Pb- and Sr-isotope data from Site 834 shown vs. depth in meters below seafloor (mbsf). The horizontal lines mark the boundaries between units, and unit designations are given on the right-hand side of the diagram. Note the extreme ratios of Units 2, 7, and 8, the sharp increase in ratios from Unit 7 to Unit 8, and the more gradual change in ratios with depth elsewhere. Figure 7. Pb-isotope compositions of the samples from this study (filled squares), shown in reference to fields for Pacific and Indian MORB, Pacific, and trench sediments (Ben Othman et al., 1989; J.M. Hergt, unpubl, data, 1989); modern Lau Basin (Loock et al., 1990; J.M. Hergt, unpubl. data, 1989); the Valu Fa Ridge (Jenner et al., 1987); and Tongan islands (Oversby and Ewart, 1972; Ewart and Hawkesworth, 1987; J.M. Hergt, unpubl. data, 1989).


Figure 9. Site 834 glass data and calculated liquid lines of descent as described in the text; symbols as in Figure 4. The heavy solid line represents the “wet” LLD at | kb, and the dashed line shows the LLD for the anhydrous case. A hypothetical MORB-like starting composition was used.

Figure 11. Ba/Rb vs. 7°°Pb/?*Pb for Site 834 illustrating how the change in the incompatible element ratio is closely linked to the mixing process identified from the Pb-isotope variations. Symbols as in Figure 4.

Figure 10. Comparison between the incompatible trace element contents o| Units 7 and 8. The trace element data have been normalized to the N-MORE -omposition of Sun and McDonough (1989). Note the marked enrichment: and decoupling between some elements in Unit 8, which are far in excess 0} what might be produced by a slightly higher degree of fractional crystallizatior modeled in these rocks (analyses from Table 5; Unit 7 represented by Sectior 135-834B-33R-1, 0-6 cm, and Unit 8 by Section 135-834B-36R-1, 0-7 cm).
![Yotes: The calculation simply assumes that a 50:50 mixture between IAB and the average composition of Unit 7 will yield the Unit 8 magmas and so is derived by straight- forward mass balance (i.c., [IAB x 0.5] + [Unit 7 x 0.5] = Unit 8). Comparison between this calculated model are and data for rocks from "Eua can be made by contrasting the values in columns 3 and 4. To cross-check, we have used the actual data for "Eua (unfortunately drawn together from different samples because of the poor amount of data available; data from Oversby and Ewart [1972], Ewart and Bryan [1972], and McCulloch [unpubl. data]) and recalculated a 50:50 mix of true arc and average Unit 7. The results are listed in column 5 and include the estimates of the Pb- and Sr-isotopic compositions for Unit 8. Clearly, some significant discrepancies are present between this “calculated Unit 8” and the measured values. In particular, Rb and Sr are quite high and U is rather low in the true composition, compared with the calculation based on 'Eua. Nonetheless, other elements are more closely matched, and the isotopic ratios are remarkably close. No calculation was made for Nd, mainly because of the complete overlap between isotopic composi- tions, but also because Nd elemental concentrations are lacking for the ‘Eua samples used. Similar calculations can be made using the Lakeba sample (see text); however,, this sample lacks key Pb-isotope data at present and is not included in this table (refer to Fig. 12B for the trace element comparison). Table 6. Calculated composition of the required model arc component.](https://figures.academia-assets.com/113454265/table_008.jpg) ](
](Yotes: The calculation simply assumes that a 50:50 mixture between IAB and the average composition of Unit 7 will yield the Unit 8 magmas and so is derived by straight- forward mass balance (i.c., [IAB x 0.5] + [Unit 7 x 0.5] = Unit 8). Comparison between this calculated model are and data for rocks from "Eua can be made by contrasting the values in columns 3 and 4. To cross-check, we have used the actual data for "Eua (unfortunately drawn together from different samples because of the poor amount of data available; data from Oversby and Ewart [1972], Ewart and Bryan [1972], and McCulloch [unpubl. data]) and recalculated a 50:50 mix of true arc and average Unit 7. The results are listed in column 5 and include the estimates of the Pb- and Sr-isotopic compositions for Unit 8. Clearly, some significant discrepancies are present between this “calculated Unit 8” and the measured values. In particular, Rb and Sr are quite high and U is rather low in the true composition, compared with the calculation based on 'Eua. Nonetheless, other elements are more closely matched, and the isotopic ratios are remarkably close. No calculation was made for Nd, mainly because of the complete overlap between isotopic composi- tions, but also because Nd elemental concentrations are lacking for the ‘Eua samples used. Similar calculations can be made using the Lakeba sample (see text); however,, this sample lacks key Pb-isotope data at present and is not included in this table (refer to Fig. 12B for the trace element comparison). Table 6. Calculated composition of the required model arc component.
[
Figure 12. N-MORB normalized diagrams of the model arc composition (Table 6), with data from Tafahi, "Eua, and Lakeba (LVG) shown for comparison. A. *Eua shows a remarkably similar pattern, whereas the HFSEs and HREEs show significantly lower values in the Tafahi sample. B. Although discrepancy exists in the more incompatible elements toward the left of the diagram, the general shape of the Lakeba sample is similar to the required [AB end-member. Data are from Ewart and Bryan (1972), Pearce (unpubl. data), and Cole et al. (1985). Normalizing values are from Sun and McDonough (1989),


Figure 14, Cartoon modified from Sinton and Detrick (1992) based on their description of magmatism at slow-spreading, low-magma-supply extensional regimes. Their model is based on ocean-ridge data; however, some of their observations might also apply to the initial stages of opening of the Lau Basin. The black regions seek to illustrate IAB that continues to erupt within the slowly fragmenting arc (e.g., LVG), but is also either drawn into the source of exten- sion-related magmas, and/or variably contaminates MORB melts as they pass through the wedge. TZ signifies the outer region surrounding the mush zone and has been termed the “transition zone” by Sinton and Detrick (1992). An arrow shows an influx of “fresh” Pacific N-MORB, some of which must penetrate the wedge without significant modification (e.g., Unit 7), We propose that this influx is only likely if significant rollback of the descending slab occurs.

Loading Preview
Sorry, preview is currently unavailable. You can download the paper by clicking the button above.
References (51)
- Bender, J.F., Langmuir, CH., and Hanson, G.N., 1984. Petrogenesis of basalt glasses from the Tamayo region, East Pacific Rise. J. Petrol., 25:213-254.
- Ben Othman, D., White, W.M., and Patchett, J., 1989. The geochemistry of marine sediments, island arc magma genesis and crust-mantle recycling. Earth Planet. Sci. Lett., 94:1-21.
- Bryan, W.B., 1986. Linked evolutionary data arrays: a logical structure for petrologic modeling of multisource, multiprocess magmatic systems. J. Geophys. Res., 91:5881-5900.
- Byerly, G.R., Melson, W.G., and Vogt, PR., 1976. Rhyodacites, andesites, ferro-basalts and ocean tholeiites from the Galapagos Spreading Center. Earth. Planet Sci. Lett., 30:215-221.
- Byers, CD., Muenow, D.W., and Garcia, M.O., 1983. Volatiles in basalts and andesites from the Galapagos Spreading Center, 85 to 86°W. Geochim. Cosmochim. Acta, 47:1551-1558.
- Christie, D.M., and Sinton, J.M., 1986. Major element constraints on melting, differentiation and mixing of magmas from the Galapagos 95.5°W propa- gating rift system. Contrib. Mineral. Petrol, 94:274-288.
- Cole, J.W., Gill, J.B., and Woodhall, D., 1985. Petrologic history of the Lau Ridge, Fiji. In Scholl, D.W., and Valuer, T.L. (Eds.), Geology and Offshore Resources of Pacific Island Arcs-Tonga Region. Circum-Pac. Counc. Energy Miner. Resour., Earth Sci. Ser., 2:379^114.
- Cole, J.W., Graham, I.J., and Gibson, I.L., 1990. Magmatic evolution of Late Cenozoic volcanic rocks of the Lau Ridge, Fiji. Contrib. Mineral. Petrol., 104:540-554.
- Cunningham, J.K., and Anscombe, K.J., 1985. Geology of 'Eua and other islands, Kingdom of Tonga. In Scholl, D., and Valuer, T. (Eds.), Geology and Offshore Resources of Pacific Island Arcs-Tonga Region. Circum- Pac. Counc. Energy Miner. Resour., Earth Sci. Ser., 2:221-258.
- Drake, MJ., 1976. Plagioclase-melt equilibria. Geochim. Cosmochim. Acta, 40:457-465.
- Ernewein, M., Pearce, J.A., Bloomer, S.H., Parson, L.M., Murton, B.J., and Johnson, L.E., in press. Geochemistry of Lau Basin volcanic rocks: influ- ence of ridge segmentation and arc proximity. In Smellie,. J. (Ed.), Volcan- ism Associated with Extension at Consuming Plate Margins. Geol. Soc. Spec. Publ. London.
- Ewart, A., and Bryan, W., 1972. Petrography and geochemistry of the igneous rocks from 'Eua, Tonga Islands. Geol. Soc. Am. Bull, 83:3281-3298.
- Abbreviations for names of organizations and publication titles in ODP reference lists follow the style given in Chemical Abstracts Service Source Index (published by American Chemical Society).
- Ewart, A., and Hawkesworth, C.J., 1987. The Pleistocene-Recent Tonga-Ker- madec arc lavas: interpretation of new isotope and rare earth data in terms of a depleted mantle source model. J. Petrol, 28:495-530.
- Fryer, P., Taylor, B., Langmuir, CH., and Hochstaedter, A.G., 1990. Petrology and geochemistry of lavas from the Sumisu and Torishima backarc rifts. Earth Planet. Sci. Lett, 100:161-178.
- Furlong, K.P., Chapman, D.S., and Alfeld, P.W., 1982. Thermal modelling of the geometry of subduction with implications for the tectonics of the overlying plate. J. Geophys. Res., 87:1756-1802.
- Garfunkel, Z., Anderson, CA., and Schubert, G., 1986. Mantle circulation and the lateral migration of subducted slabs. J. Geophys. Res., 91:7205-7223.
- Gill, J.B., 1976. Composition and age of Lau basin and ridge volcanic rocks: implications for evolution of an interarc basin and remnant arc. Geol Soc. Am. Bull, 87:1384-1395.
- Hawkins, J.W., Bloomer, S.H., Evans, CA., and Melchior, J.T., 1984. Evolu- tion of intra-oceanic arc-trench systems. Tectonophysics, 102:175-205.
- Hawkins, J.W., Lonsdale, RF., Macdougall, J.D., and Volpe, A.M., 1990. Petrology of the axial ridge of the Mariana Trough backarc spreading center. Earth Planet. Sci. Lett., 100:226-256.
- Hawkins, J.W., and Melchior, J.T., 1985. Petrology of Mariana Trough and Lau Basin basalts. J. Geophys. Res., 90:11431-11468.
- Helz, R.T., 1976. Phase relations of basalts in their melting ranges at PYi 2 O = 5kb. Part II. Melt compositions. J. Petrol, 17:139-193.
- Hochstaedter, A.G., Gill, J.B., Kusakabe, M., Newman, S., Pringle, M., Taylor, B., and Fryer, P., 1990. Volcanism in the Sumisu Rift. I. Major element, volatile and stable isotope geochemistry. Earth Planet. Sci. Lett., 100:179- 194.
- Hofmann, A.W., Jochum, K.P., Seufert, M., and White, W.M., 1986. Nb and Pb in oceanic basalts: new constraints on mantle evolution. Earth Planet. Sci. Lett., 79:33^5.
- Hynes, A., and Mott, J., 1985. On the causes of backarc spreading. Geology, 13:387-389.
- Jarrard, R.D., 1986. Relations among subduction parameters. Rev. Geophys., 24:217-284.
- Jenner, G.A., Cawood, P.A., Rautenschlein, M., and White, W.M., 1987. Composition of backarc basin volcanics, Valu Fa Ridge, Lau Basin: evidence for a slab-derived component in their mantle source. J. Volcanol. Geotherm. Res., 32:209-222.
- Karig, D.E., 1970. Ridges and basins of the Tonga-Kermadec island arc system. J. Geophys. Res., 75:239-254.
- Langmuir, CH., Zhang, Y., Taylor, B., Plank, T, and Rubenstone, J., in press. Petrogenesis of Torishima and adjacent volcanos of the Izu-Bonin Arc: one end-member of the global spectrum of arc basalt compositions. Contrib. Mineral. Petrol.
- Lawver, L., and Hawkins, J.W., 1978. Diffuse magnetic anomalies in marginal basins: their possible petrologic and tectonic significance. Tectonophysics, 43:323-339.
- le Roex, A.P., Dick, H.J.B., Reid, A.M., Frey, F.A., Erlank, A.J., and Hart, S.R., 1985. Petrology and geochemistry of basalts from the American-Antarctic Ridge, Southern Ocean: implications for the westward influence of the Bouvet mantle plume. Contrib. Mineral Petrol, 90:367-380.
- Loock, G., McDonough, W.F., Goldstein, S.L., and Hofmann, A.W., 1990. Isotopic compositions of volcanic glasses from the Lau Basin. Mar. Min., 9:235-245.
- Nielsen, R.L., 1988. A model for the simulation of combined major and trace element liquid lines of descent. Geochim. Cosmochim. Acta, 52:27-38.
- Oversby, VM., and Ewart, A., 1972. Lead isotopic compositions of Tonga- Kermadec volcanics and their petrogenetic significance. Contrib. Mineral. Petrol, 37:181-210.
- Parson, L., Hawkins, J., Allan, J., et al., 1992. Proc. ODP, Init. Repts.,135: College Station, TX (Ocean Drilling Program).
- Parson, L.M., Hawkins, J.W., and Hunter, P.M., 1992. Morphotectonics of the Lau Basin seafloor-implications for the opening history of backarc basins. In Parson, L., Hawkins, J., Allan, J., et al., Proc. ODP, Init. Repts., 135: College Station, TX (Ocean Drilling Program), 81-82.
- Parson, L.M., Pearce, J.A., Murton, B.J., Hodkinson, R.A., Bloomer, S., Ernewein, M., Huggett, Q.J., Miller, S., Johnson, L., Rodda, P., and Helu, S., 1990. Role of ridge jumps and ridge propagation in the tectonic evolution of the Lau backarc basin, southwest Pacific. Geology, 18:470-473.
- Schilling, J.-G., Zajac, M., Evans, R., Johnson, T., White, W, Devine, J.D., and Kingsley, R., 1983. Petrologic and geochemical variations along the Mid-Atlantic Ridge from 29°N to 75°N. Am. J. Sci., 283:510-586.
- Sinton, J.M. and Derrick, R.S., 1992. Mid-ocean ridge magma chambers. /. Geophys. Res., 97:197-216.
- Sinton, J.M., and Fryer, P., 1987. Mariana Trough lavas from 18°N: implica- tions for the origin of backarc basin basalts. J. Geophys. Res., 92:12782- 12802.
- Spulber, S.D., and Rutherford, MJ., 1983. The origin of rhyolite and pla- giogranite in oceanic crust: an experimental study. J. Petrol., 24:1-25.
- Stern, R.J., Lin, P.-N., Morris, J.D., Jackson, M.C., Fryer, P., Bloomer, S.H., and Ito, E., 1990. Enriched back-arc basin basalts from the northern Mariana Trough: implications for the magmatic evolution of back-arc basins. Earth Planet. Sci. Lett, 100:210-225.
- Sun, S.-S., and McDonough, W.F., 1989. Chemical and isotopic systematics of oceanic basalts: implications for mantle composition and processes. In Saunders, A.D., and Norry, MJ. (Eds.), Magmatism in the Ocean Basins. Geol. Soc. Spec. Publ. London, 42:313-345.
- Sunkel, G., 1990. Origin of petrological and geochemical variations of Lau Basin lavas (SW Pacific). Mar. Min., 9:205-234.
- Tarney, J., Saunders, A.D., Mattey, D.P., Wood, D.A., and Marsh, N.G., 1981. Geochemical aspects of backarc spreading in the Scotia Sea and western Pacific. Philos. Trans. R. Soc. London A, 300:263-285.
- Taylor, B., and Karner, G.D., 1983. On the evolution of marginal basins. Rev. Geophys. Space Phys., 21:1727-1'/'41.
- Volpe, A.M., Macdougall, J.D., and Hawkins, J.W., 1988. Lau Basin basalts (LBB): trace element and Sr-Nd isotopic evidence for heterogeneity in backarc basin mantle. Earth Planet. Sci. Lett., 90:174-186.
- Weaver, J.S., and Langmuir, CH., 1990. Calculation of phase equilibrium in mineral-melt systems. Computers Geosci., 16:1-19.
- Whelan, P.M., Gill, J.B., Kollman, E., Duncan, R., and Drake, R.E., 1985. Radiometric dating of magmatic stages in Fiji. In Scholl, D., and Valuer, T. (Eds.), Geology and Offshore Resources of Pacific Island Arcs-Tonga Region. Circum-Pac. Counc. Energy Miner. Resour., Earth Sci. Ser., 2:415^440.
- Woodhall, D., 1985. Geology of the Lau Ridge. In Scholl, D., and Vallier, T.L. (Eds.), Geology and Offshore Resources of Pacific Island Arcs-Tonga Region. Circum-Pac. Counc. Energy Miner. Resour., Earth Sci. Sen, 2:351-378.
- Date of initial receipt: 29 June 1992 Date of acceptance: 5 May 1993 Ms 135SR-144