Intact rock strength (original) (raw)
Abstract
This study presents the results of laboratory testing of sedimentary rocks under point loading as well as in uniaxial and triaxial compression. From the statistical analysis of the data, different conversion factors relating uniaxial compressive and point loading strength were determined for soft to strong rocks. Additionally, the material constant m i , an input parameter for the Hoek and Brown failure criterion, was also estimated for different limestone samples by analysing the results from a series of triaxial compression tests under different confining pressures. The uniaxial compressive strength (UCS) of intact rocks, as estimated from the point load index using conversion factors, together with the Hoek -Brown constant m i , and the Geological Strength Index (GSI) constitute the parameters for the calculation of the strength and deformability of rock masses. D
FAQs
![]()
AI
What key conversion factors were established between point load index and UCS?add
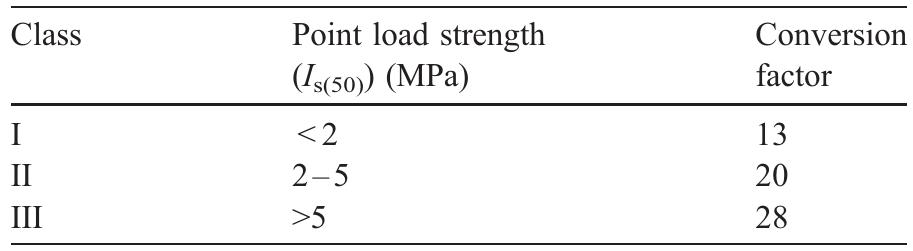
The study establishes conversion factors varying from 13 for soft rocks to 28 for harder rocks, depending on the point load index I s(50). These factors indicate a significant range in correlation based on rock strength.
How does sample size influence the uniaxial compressive strength measurements?add
The study finds uniaxial compressive strength decreases with increasing sample diameter, highlighting complexities in UCS assessment. It specifically uses cylindrical NX (54-mm diameter) samples to minimize uncertainties related to size effects.
What explains the variations in m i values for limestones across different testing sites?add
Estimated m i values for limestones range from 13 to 27, exhibiting site-specific variability in rock strength characteristics. This study suggests a mean m i value of approximately 24, higher than previously proposed averages.
What testing methods were used to evaluate rock materials in the study?add
The study utilized uniaxial compression and point load tests, alongside triaxial compression tests for shear strength analysis. Methodologies followed ISRM suggested methods and ASTM standards for consistency in testing.
When was the conversion factor regression analysis first proposed for sedimentary rocks?add
Conversion factor regression analyses for sedimentary rocks were previously estimated between 8 to 54 across different types. This study updates these figures, establishing more tailored factors: 13 for weak rocks to 28 for strong.
Figures (15)
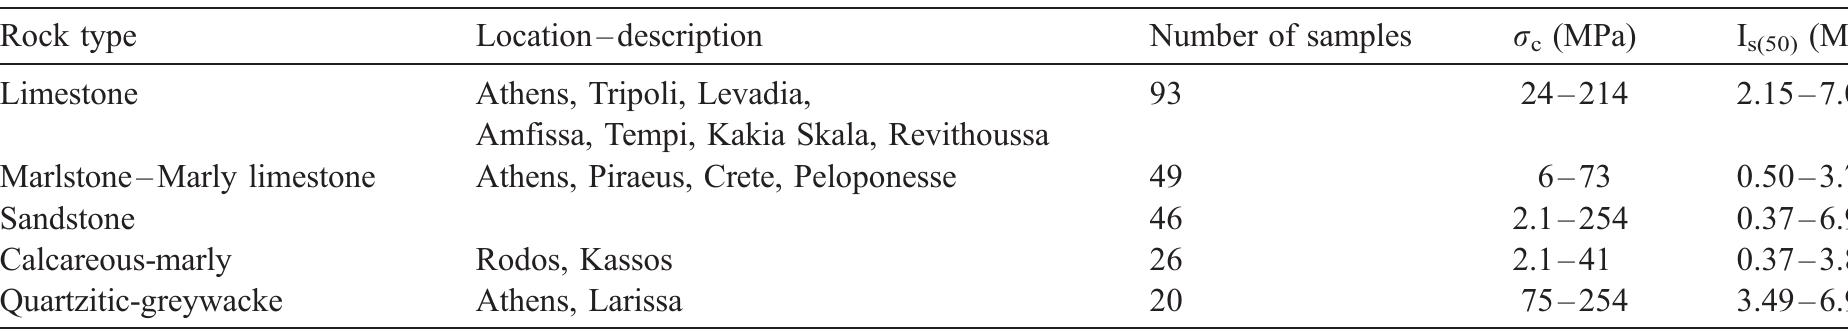
Data from laboratory testing of sedimentary rocks Table 1
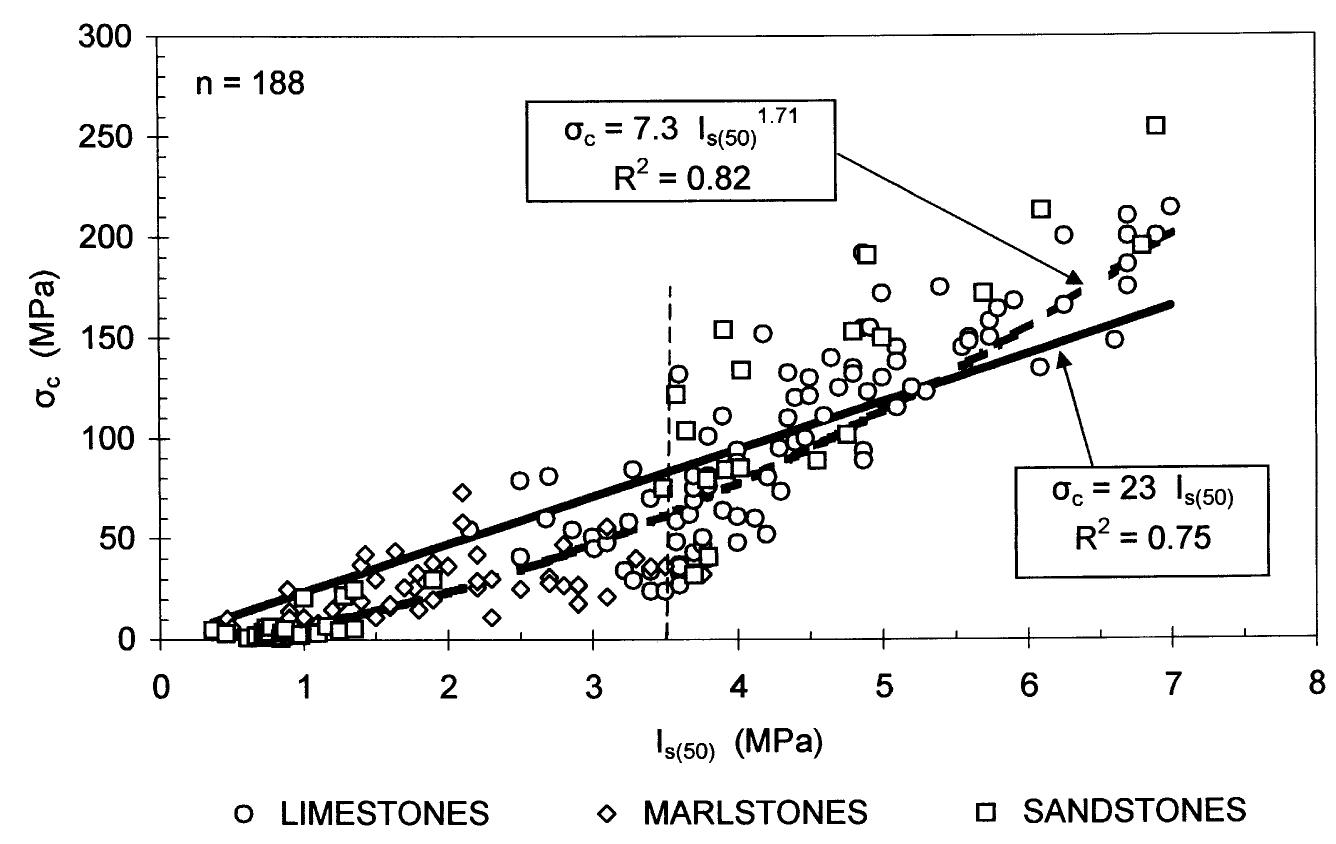
Fig. 1. Linear and power function relationship between point loading and uniaxial compressive strength.
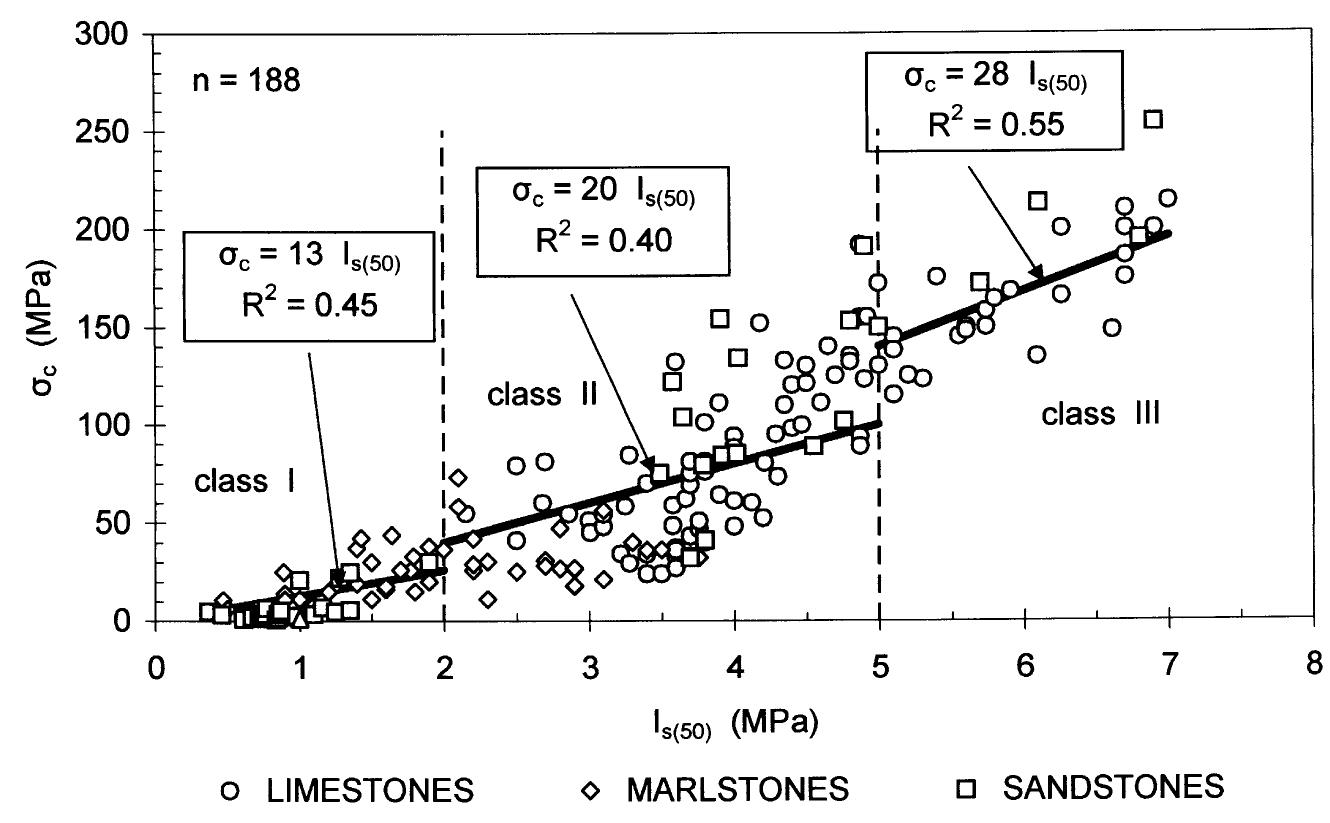
Fig. 2. Conversion factors correlating point loading and uniaxial compressive strength for soft to strong sedimentary rocks The execution of laboratory tests on intact rock material, as well as the determination of the strength parameters was in accordance with ISRM suggested methods (1981, 1985) and ASTM standards (D 2938- 86 and D2664-86, 1986). More specifically, the parameters of rock specimens determined by tests The rock samples examined in this study were prepared and tested in uniaxial compression and point loading with the loading axis perpendicular to any
Conversion factors between uniaxial compressive strength (UCS, o,) and point load index /,(s59) for sedimentary rocks
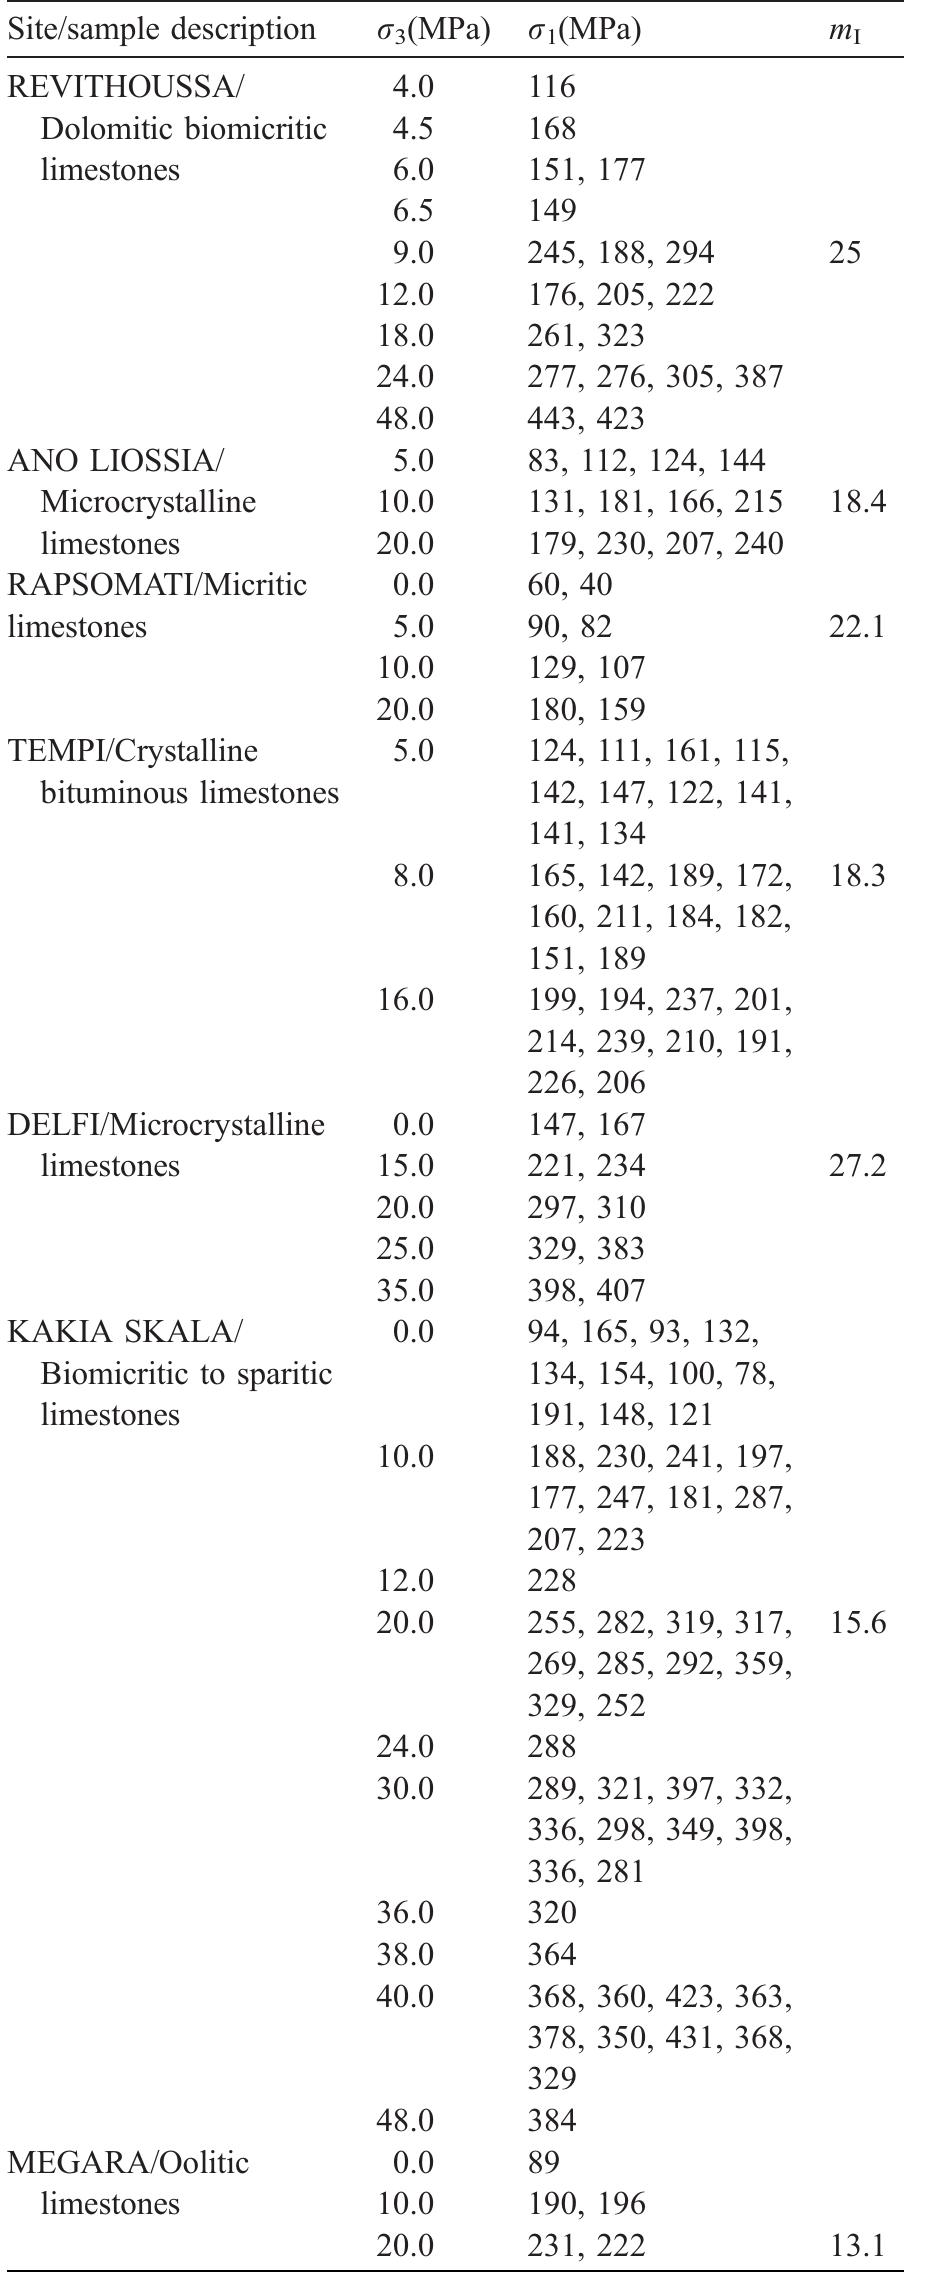
Data from triaxial testing of limestone specimens Table 3 Table 3 (continued)
Regression analysis was applied to define the relation among UCS and point load test data. The regression procedure is to fit a line through the points, which is computed so that the squared deviations of the measured points from that line are minimized. The line in a two-variable space is defined by the relevant equation, whereas the value of coefficient of determi- nation or R-square value is also determined. The R- square value is an indicator of how well the model fits the data.
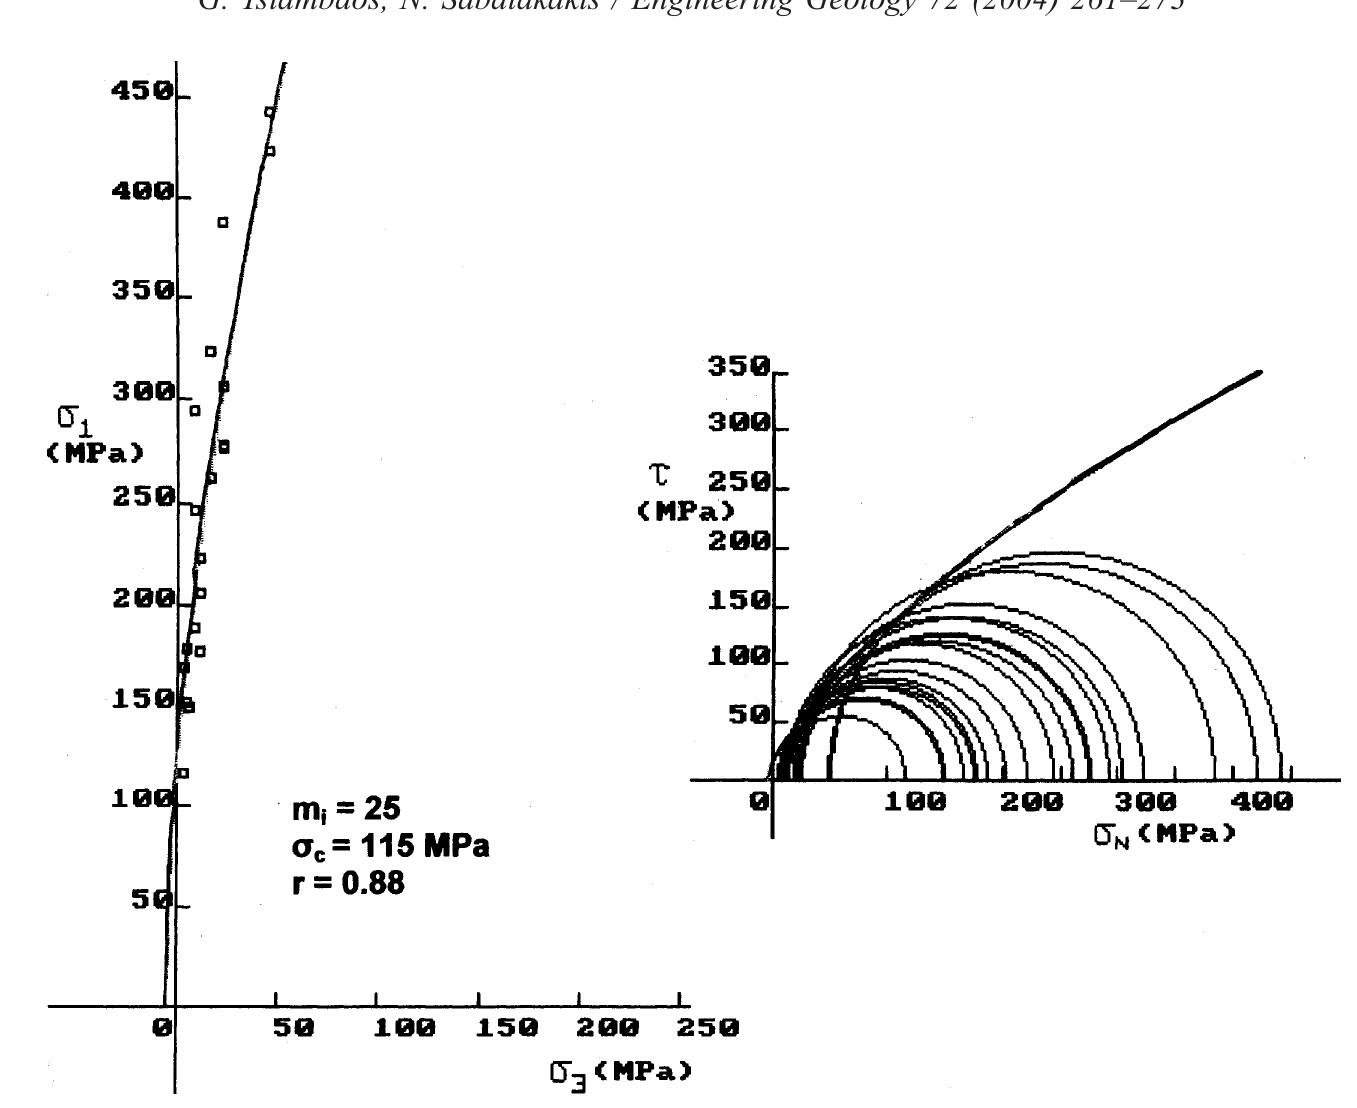
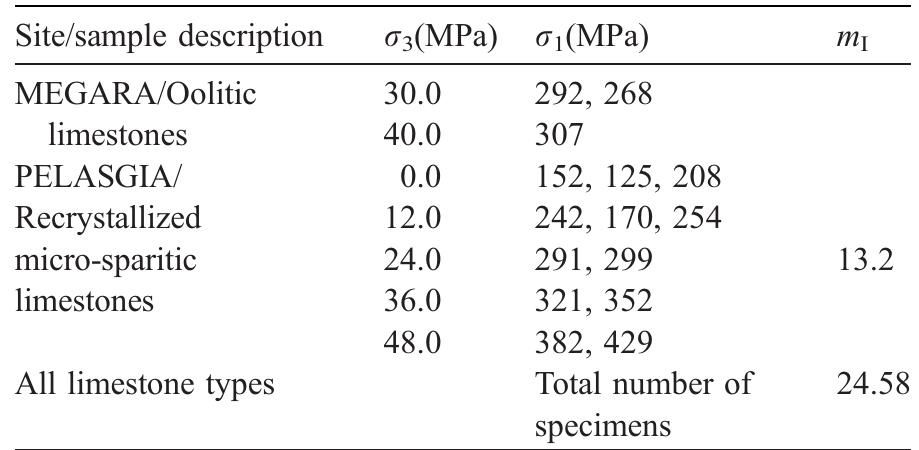
Fig. 3. Intact rock strength envelopes and mj; estimation for Revithoussa limestones.
Fig. 4. Intact rock strength envelopes and m; estimation for Ano Liossia limestones.
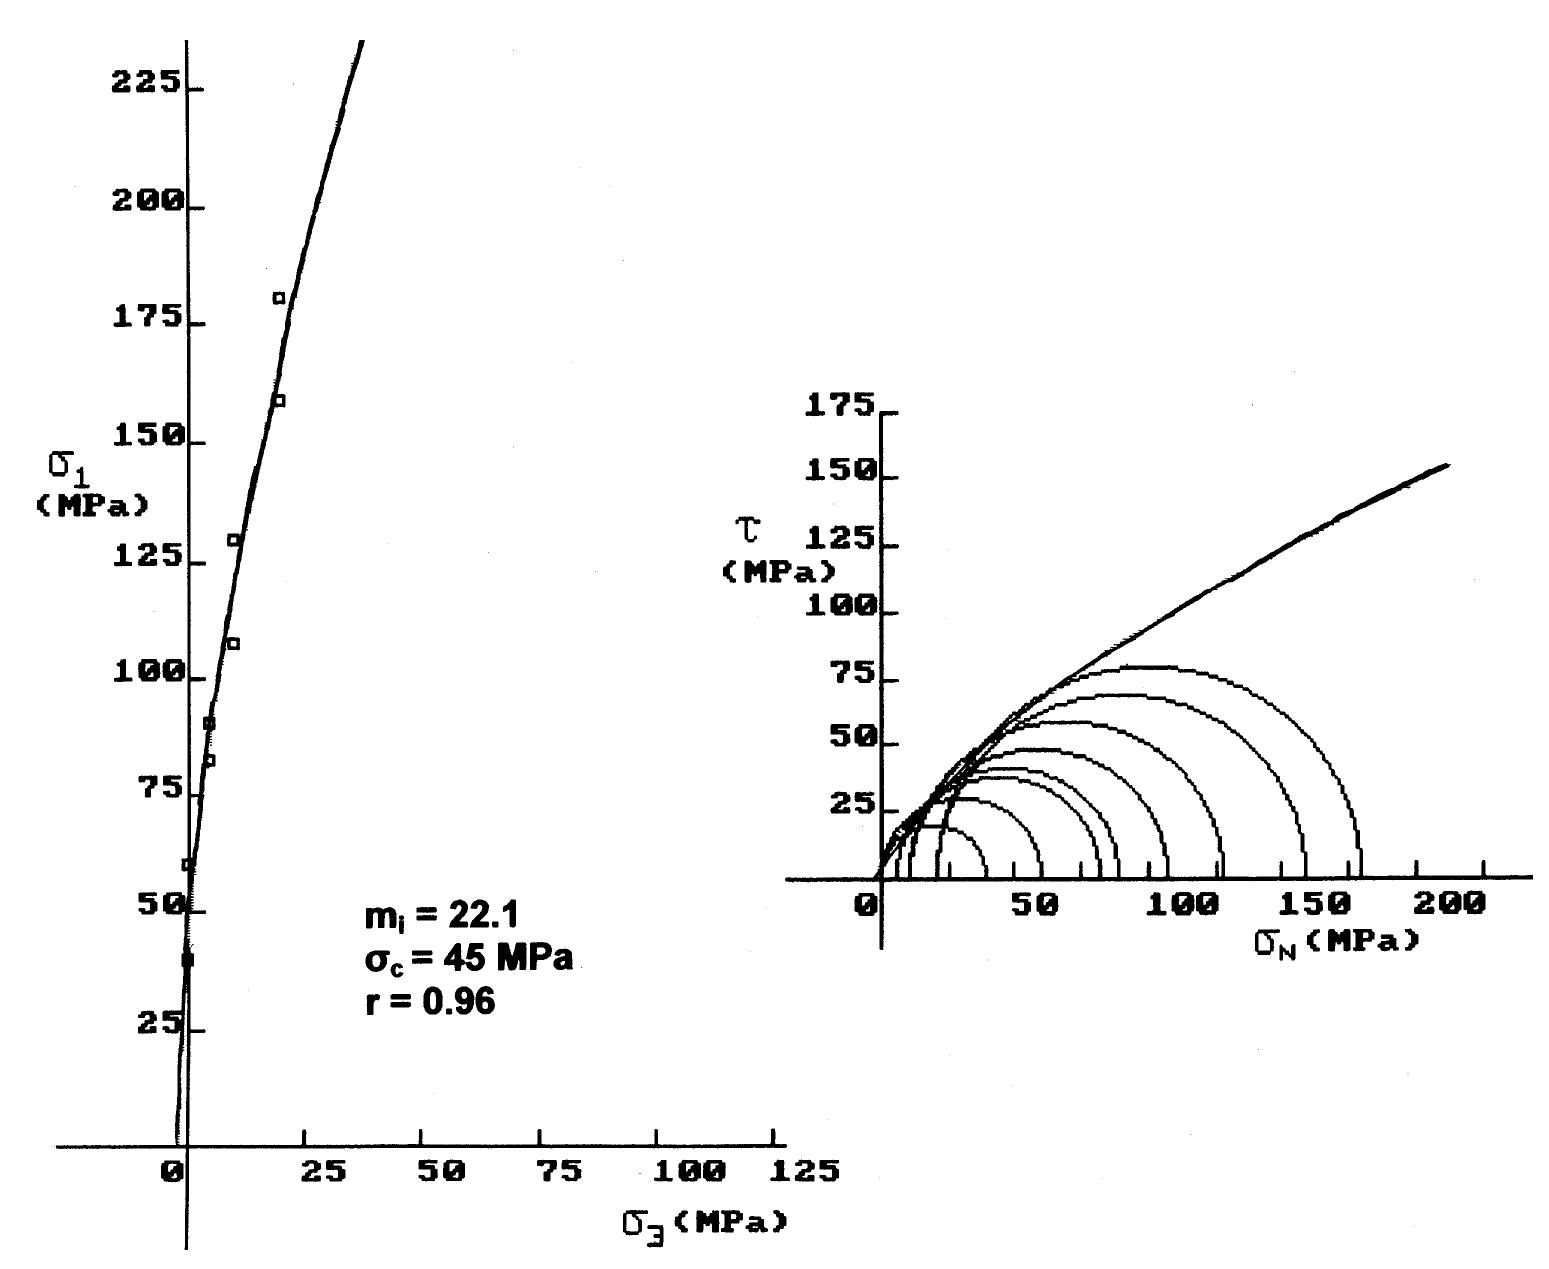
Fig. 5. Intact rock strength envelopes and mj estimation for Rapsomati limestones. for rocks with a /.,50) value greater than 5 MPa (class II). As shown in Fig. 2, point load strength can be divided into three separate classes (classes I to III) and different conversion factors using linear regression, passing through the origin, could be established for each class. The class designation is merely a means of categorizing the rock material strength where less data scatter is observed. Although the linear model used to obtain the best-fit curve for each class gives R-square values from 0.40 to 0.55, the substantial variation of
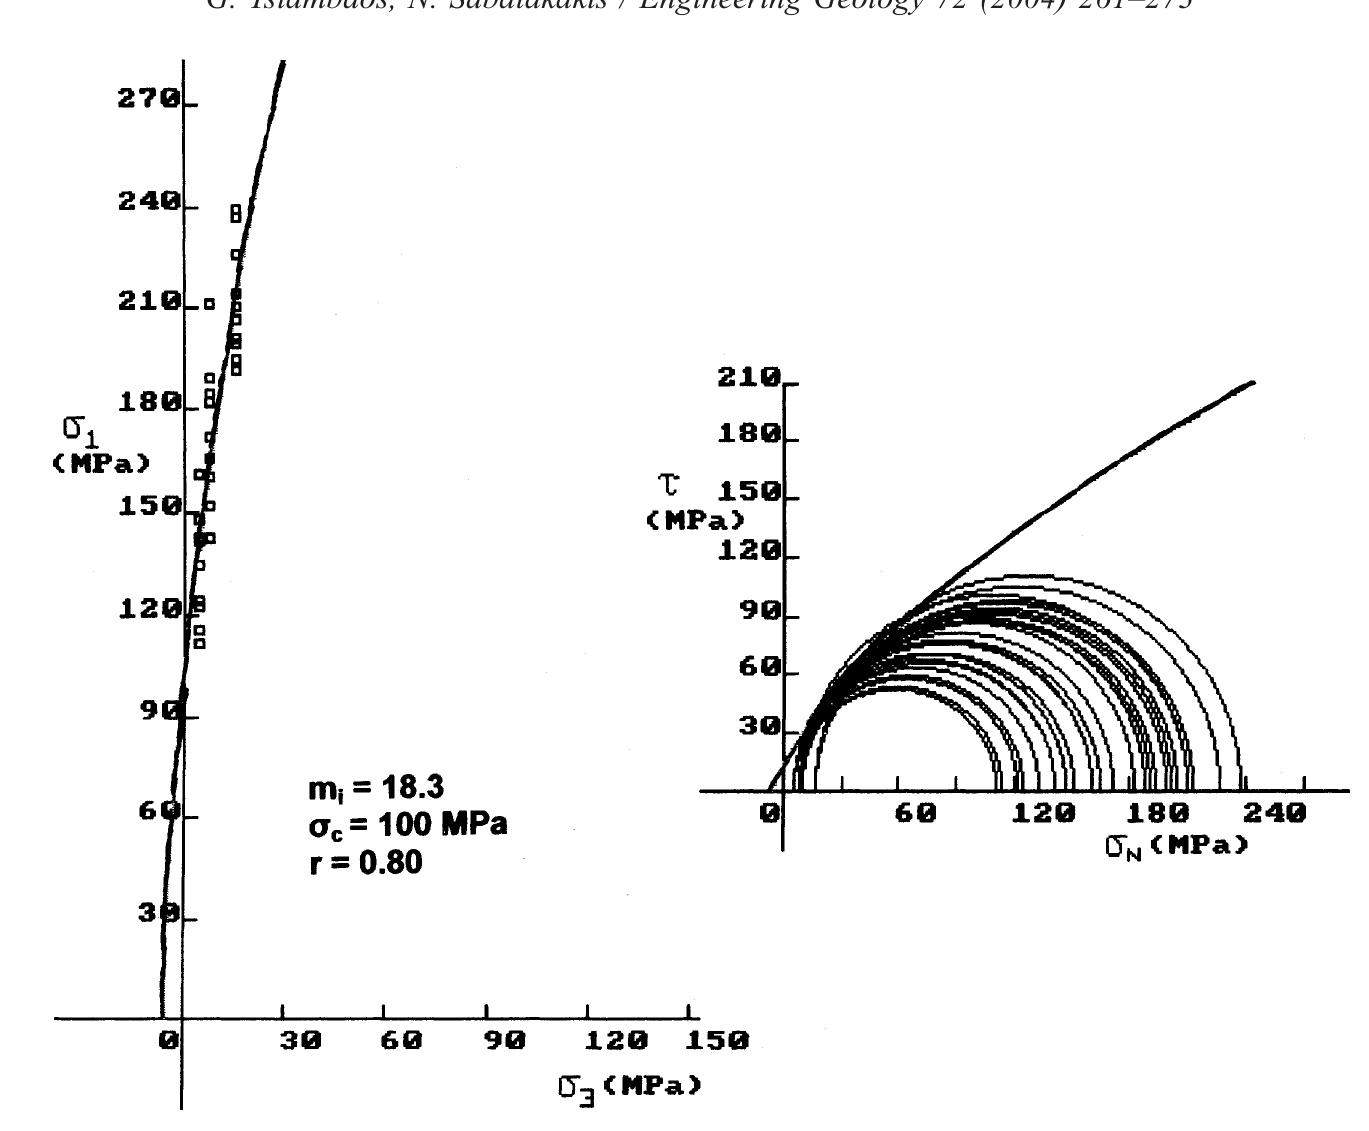
Fig. 6. Intact rock strength envelopes and m; estimation for Tempi limestones.
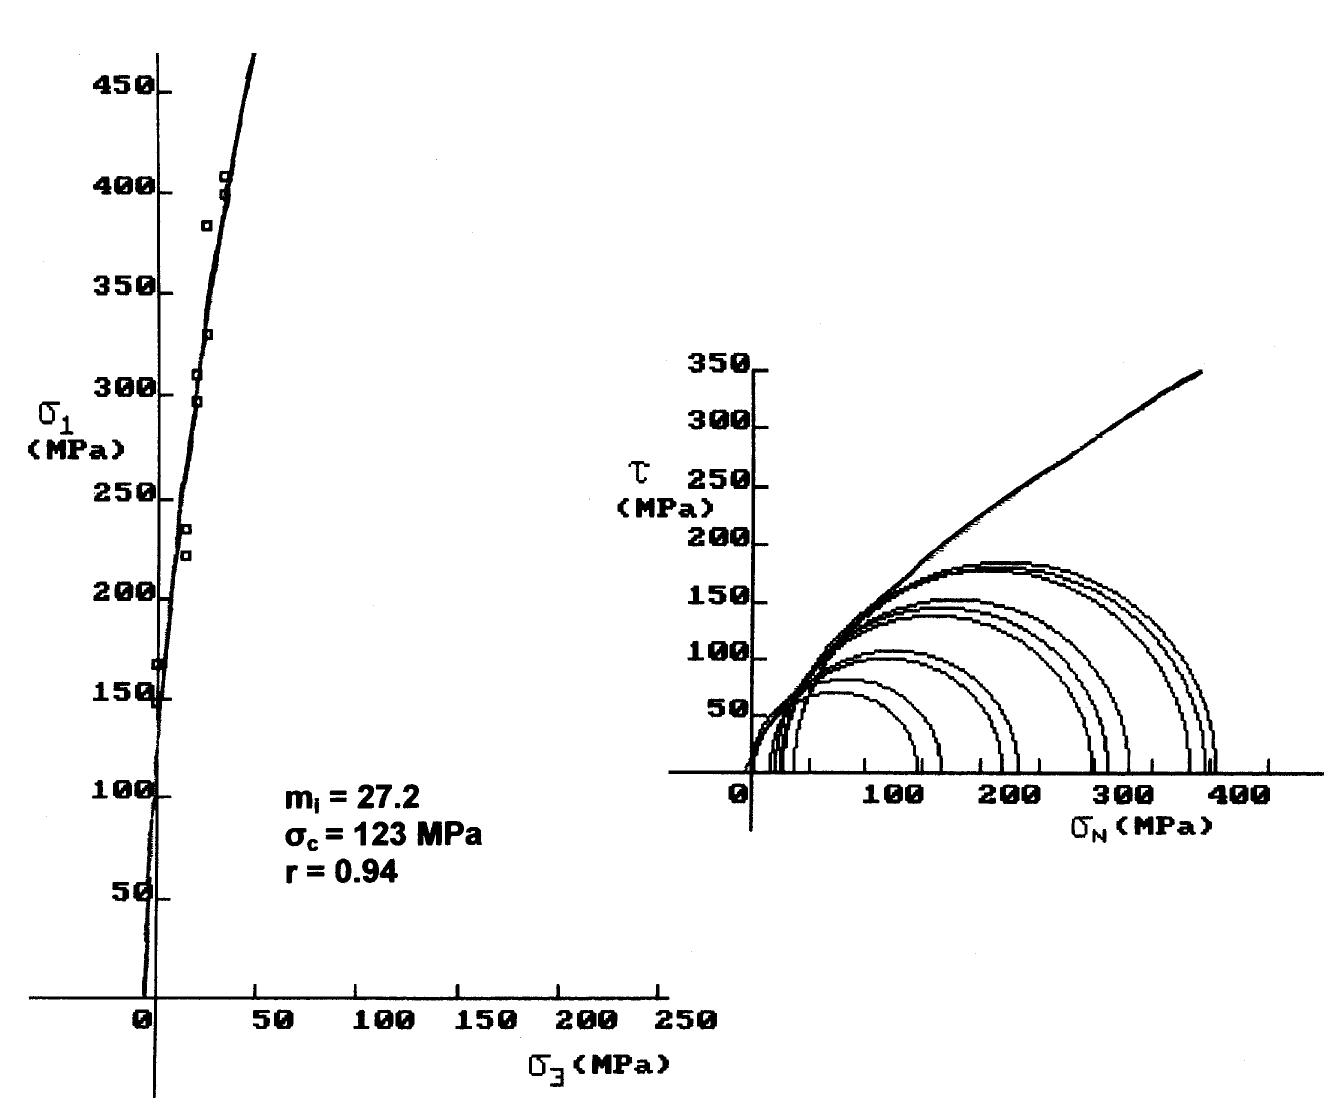
Fig. 7. Intact rock strength envelopes and mj estimation for Delfi limestones.
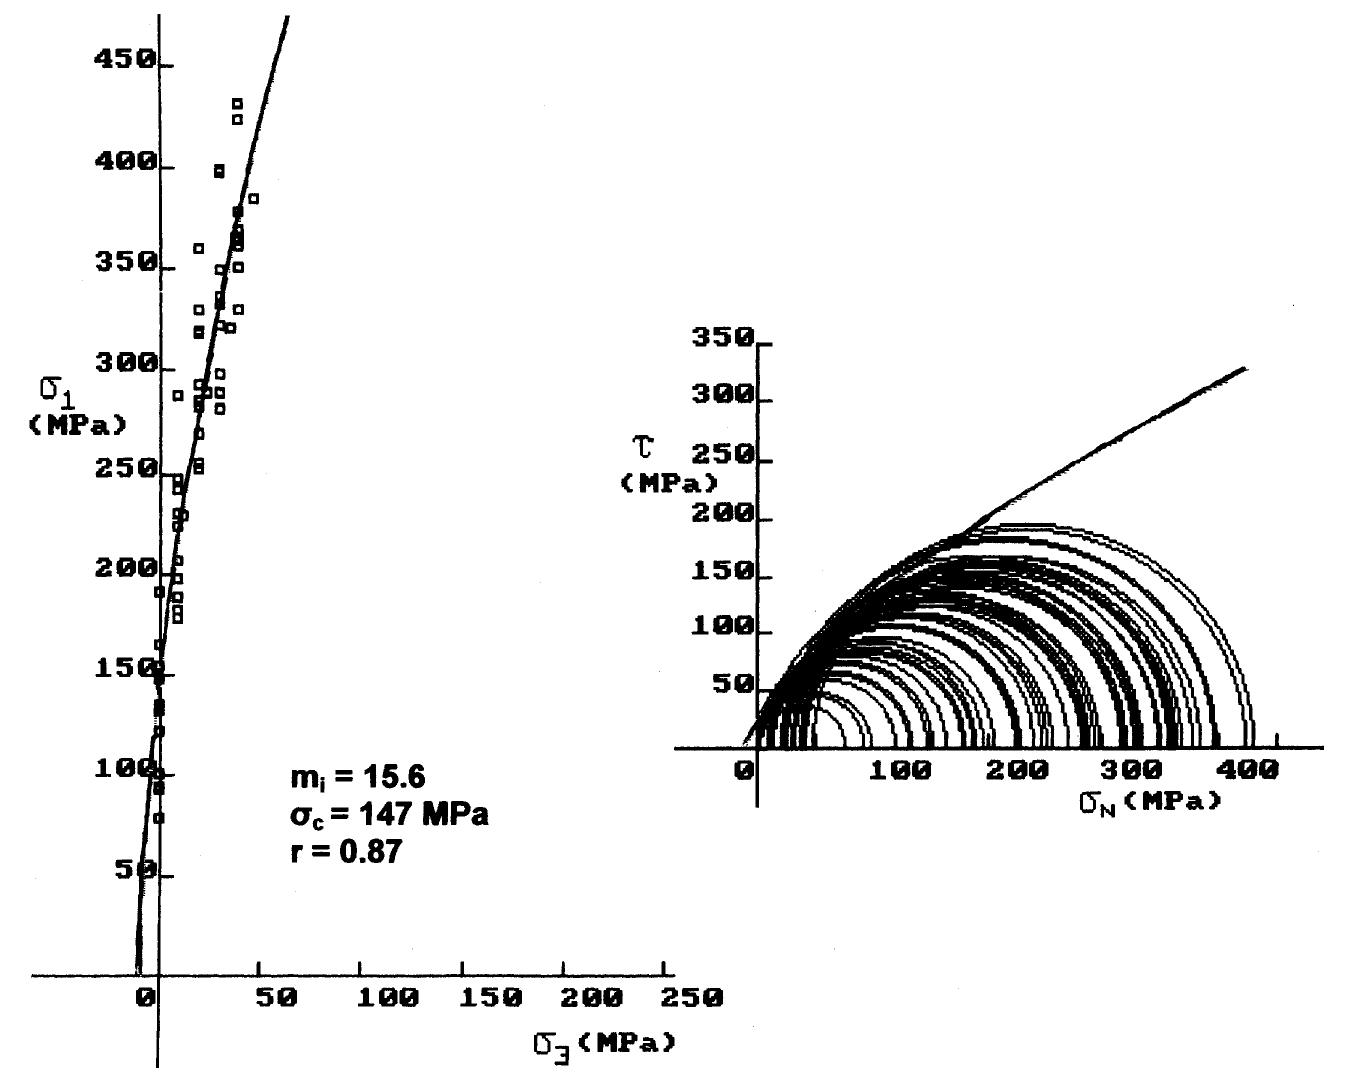
Fig. 8. Intact rock strength envelopes and mj; estimation for Kakia Skala limestones. Triaxial compression refers to a test where com- pression and axisymmetric confining pressure are applied simultaneously to a rock cylinder. This pro- The constant m; can only be determined by triaxial testing on intact rock cores. When it is not possible to carry out triaxial tests, an estimate of m; can be obtained using the more recent version of m; values for different types of rocks published by Marinos and Hoek (2000, 2001). This material constant is related to the frictional properties of the intact rock and has a
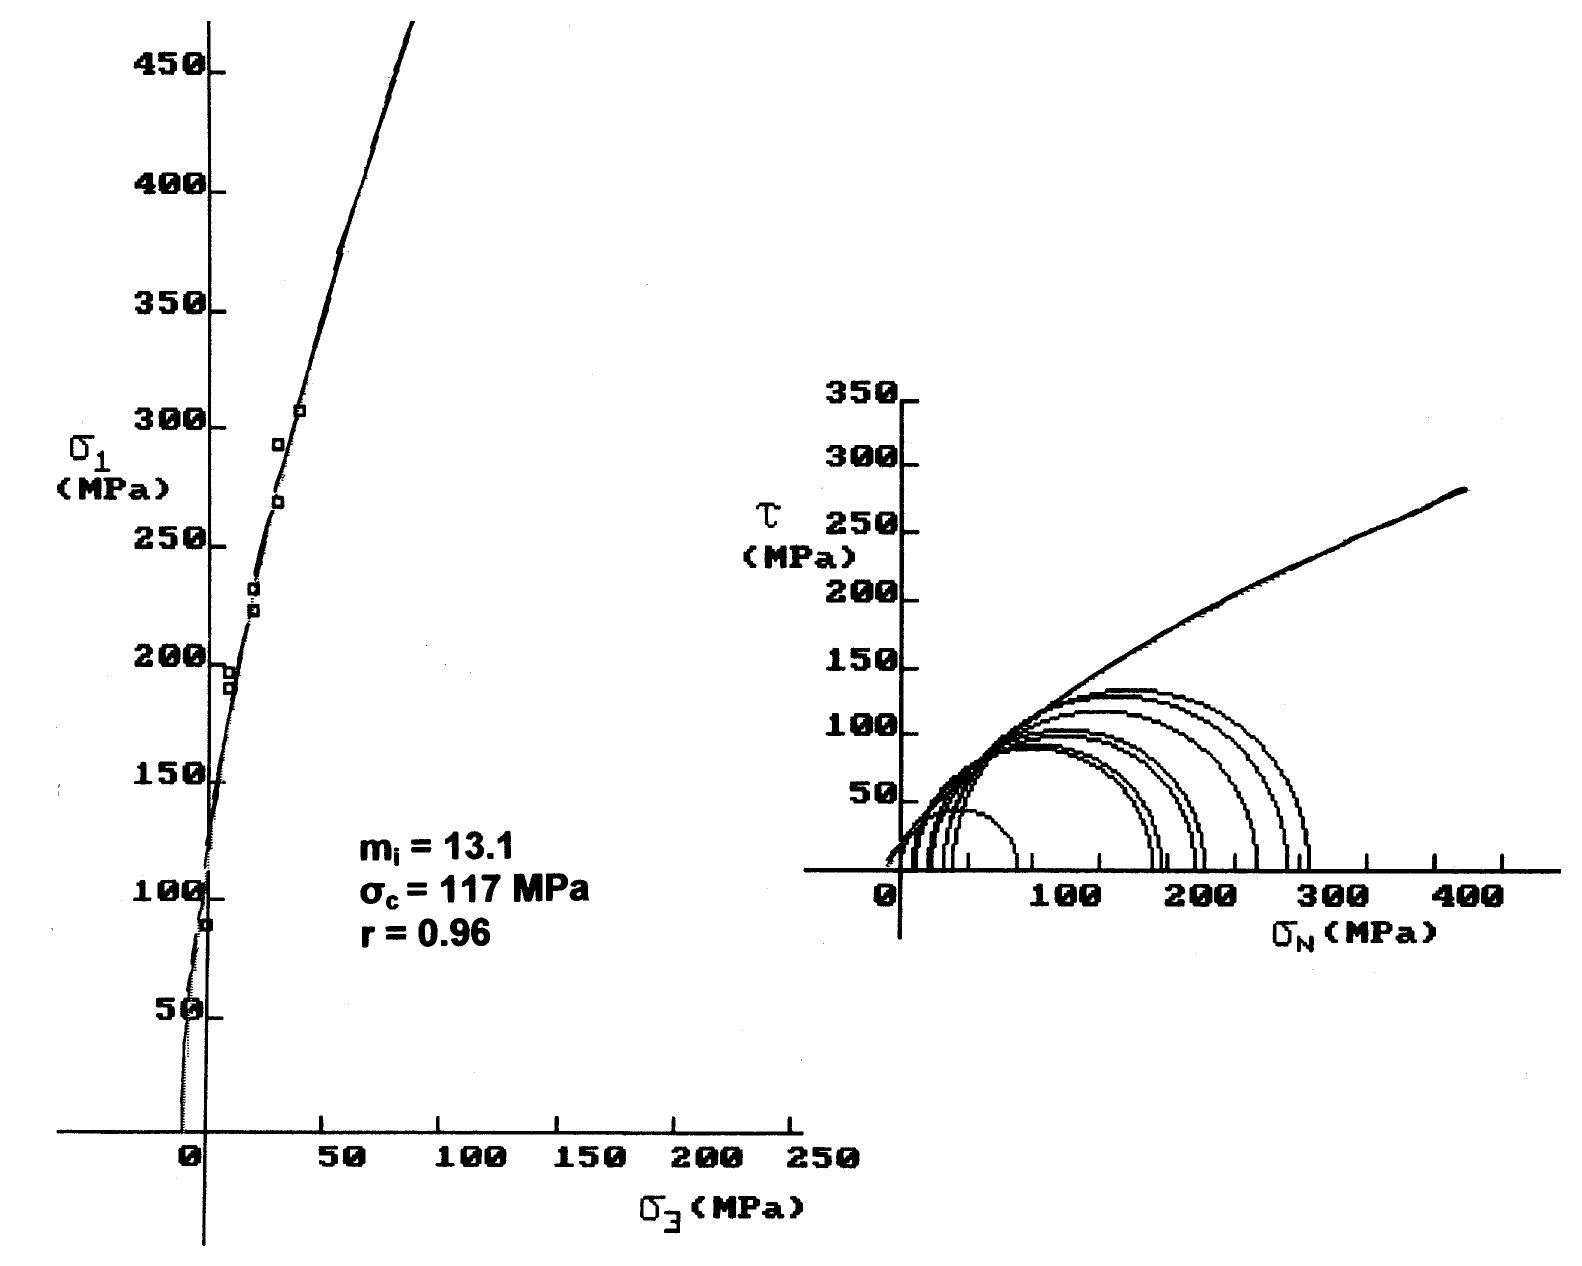
Fig. 9. Intact rock strength envelopes and mj estimation for Megara limestones. The computed values of m;, as shown in Table 3, generally range from 13 to 27, whereas the interpre- It must be noted that the limestone samples tested in the present study could not classified as “‘very hard brittle rocks”’ for which a reduction of major princi-
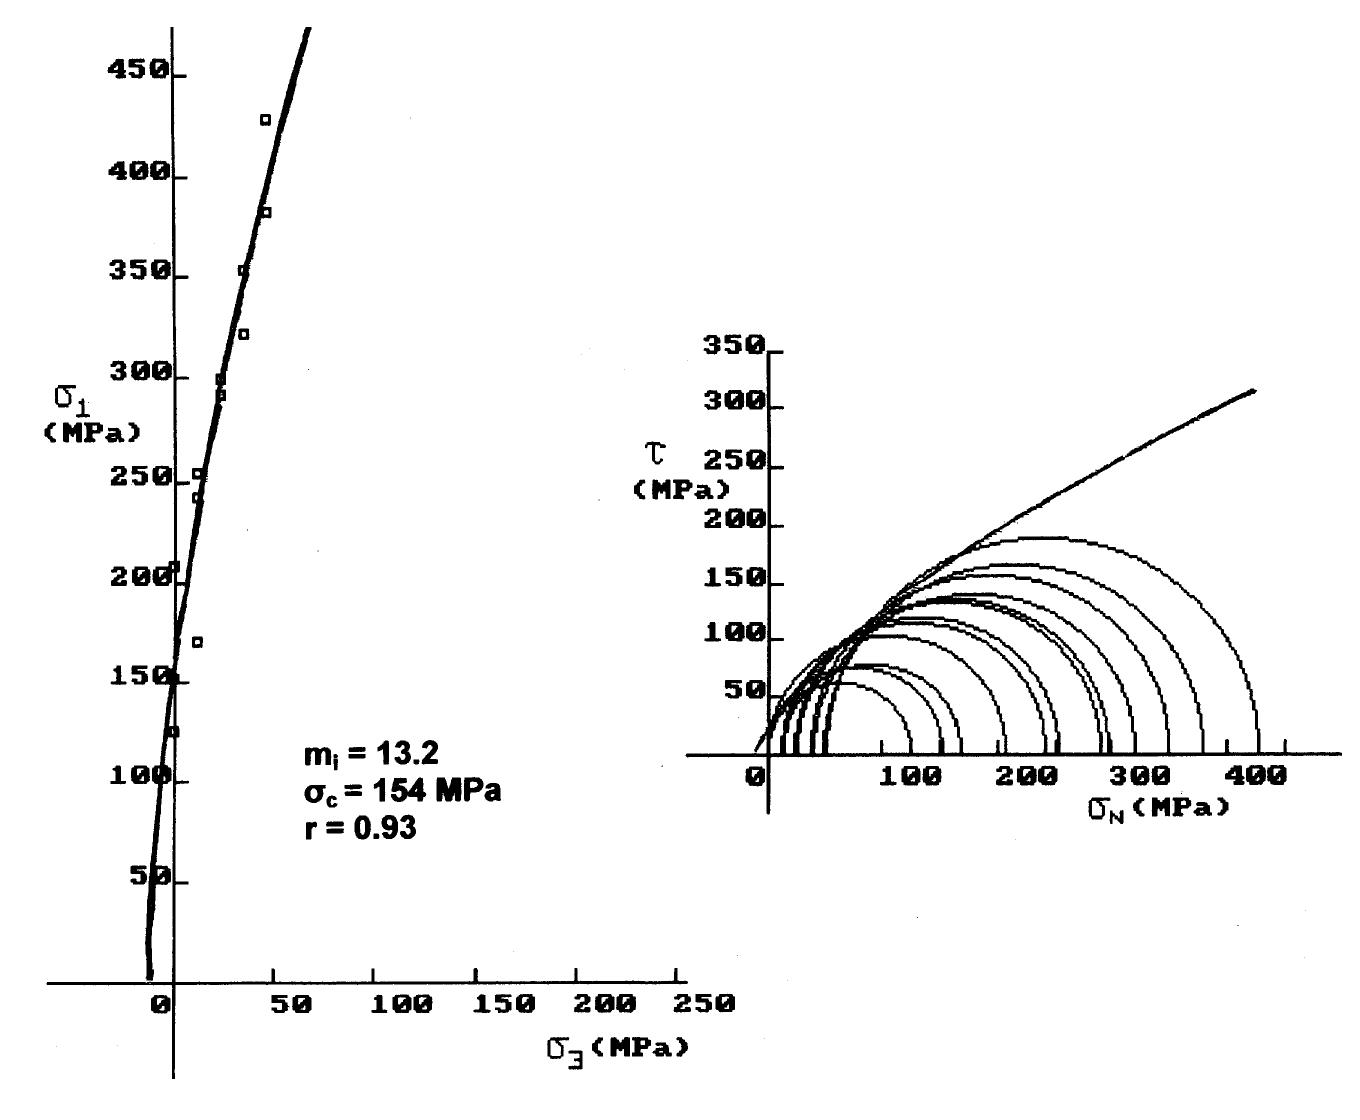
Fig. 10. Intact rock strength envelopes and mj; estimation for Pelasgia limestones.
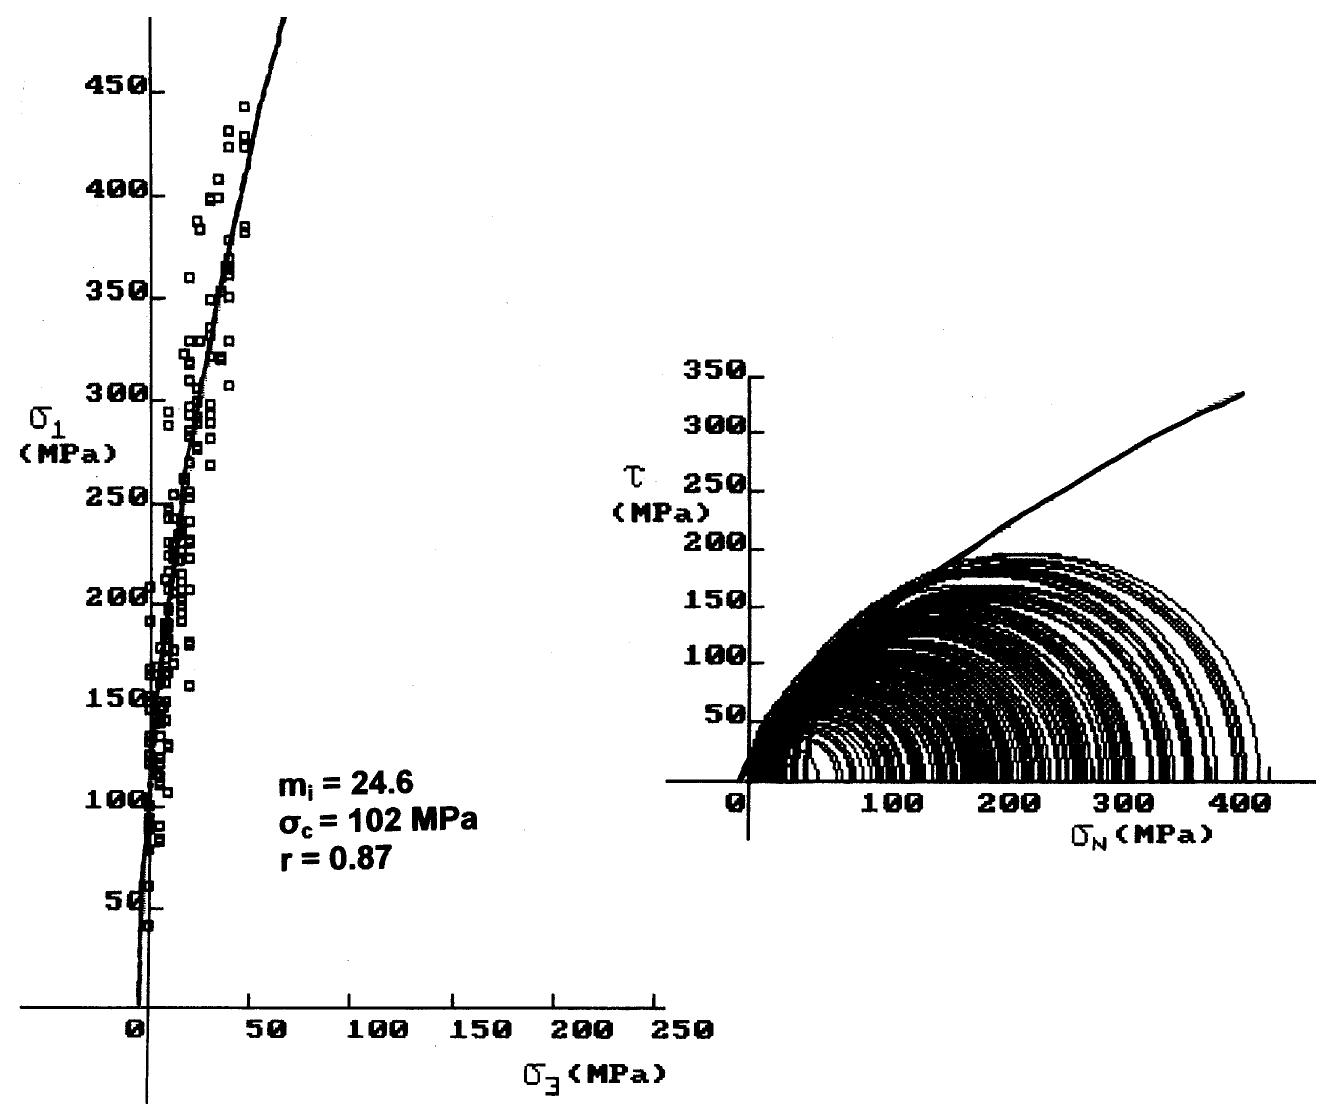
Fig. 11. Intact rock strength envelopes and estimation of the mean value of m; for the total number of limestones tested

Loading Preview
Sorry, preview is currently unavailable. You can download the paper by clicking the button above.
References (29)
- Al Jassar, S.H., Hawkins, A.B., 1979. Geotechnical properties of the carboniferous limestone of the Bristol area-the influence of petrography and chemistry. 4th ISRM Conference, Montreau, vol. 1, pp. 3 -14.
- Alber, M., Heiland, J., 2001. Investigation of a limestone Pillar failure: Part 1. Geology, laboratory testing and numerical mo- deling. Rock Mech. Rock Eng. 34 (3), 167 -186.
- ASTM, 1986a. Standard test method of unconfined compressive strength of intact rock core specimens, D2938.
- ASTM, 1986b. Standard test method for triaxial compressive strength of undrained rock core specimens without pore pressure measurement, D2664.
- Bieniawski, Z.T., 1974. Estimating the strength of rock materials. J. S. Afr. Inst. Min. Metall. 74, 312 -320.
- Bieniawski, Z.T., 1975. Point load test in geotechnical practice. Engineering Geology (1). Elsevier, pp. 1 -11.
- British Standard Institution, (BS), 1981. Code of Practice for Site Investigations. BS 5930 HMSO, London.
- Broch, E.M., Franklin, J.A., 1972. The point load strength test. Int. J. Rock Mech. Min. Sci. Geomech. Abstr. 9, 669 -697.
- Brook, N., 1985. The equivalent core diameter method of size and shape correction in point load test. Int. J. Rock Mech. Min. Sci. Geomech. Abstr. 22, 61 -70.
- Chau, K.T., Wong, R.H.C., 1996. Uniaxial compressive strength and point load strength of rocks. Int. J. Rock Mech. Min. Sci. Geomech. Abstr. 33, 183 -188.
- Hawkins, A.B., 1998. Aspects of rock strength. Bull. Eng. Geol. Environ., vol. 57. Springer, Berlin, pp. 17 -30.
- Hawkins, A.B., Olver, J.A.G., 1986. Point load tests: correlation factor and contractual use. An example from the Corallian at Weymouth. In: Hawkins, A.B. (Ed.), Site Investigation Practice: Assessing BS 5930. Geological Society, London, pp. 269 -271.
- Hoek, E., 1994. Strength of rock masses. ISRM News J. (2), 4 -16.
- Hoek, E., 2000. Practical Rock Engineering (course notes available at the internet site: http://www.rocscience.com).
- Hoek, E., Brown, E.T., 1980. Underground excavations in rock. Inst. Min. Metall., London.
- Hoek, E., Brown, E.T., 1988. The Hoek -Brown failure criterion- a 1988 update. In: Curran, J.C. (Ed.), Proc. 15th Canadian Rock Mech. Symp. University of Toronto, Toronto, pp. 31 -38.
- Hoek, E., Brown, E.T., 1997. Practical estimates or rock mass strength. Int. J. Rock Mech. Min. Sci. Geomech. Abstr. 34 (8), 1165 -1186.
- Hoek, E., Marinos, P., Benissi, M., 1998. Applicability of the Geological Strength Index (GSI) classification for very weak and sheared rock masses. The case of the Athens Schist For- mationBull. Eng. Geol. Environ., vol. 57 (2). Springer, Berlin, pp. 151 -160.
- Hoek, E., Carranza Torres, C., Corkum, B., 2002. The Hoek - Brown failure criterion-a 2002 edition. Proc. 5th North Amer- ican Rock Mechanics Symposium and 17th Tunneling Associ- ation of Canada Conference: NARMS-TAC. University of Toronto Press, Toronto, Canada, pp. 267 -271.
- ISRM Suggested Methods, 1981. In: Brown, E.T. (Ed.), Rock Characterization Testing and Monitoring. Pergamon, Oxford, pp. 113 -116 and 123 -127.
- ISRM Suggested Methods, 1985. Suggested method for deter- mining point-load strength. Int. J. Rock Mech. Min. Sci. Geo- mech. Abstr. 22, 53 -60.
- Kahraman, S., 2001. Evaluation of simple methods for assessing the uniaxial compressive strength of rock. Int. J. Rock Mech. Min. Sci. 38, 981 -994.
- Marinos, P., Hoek, E., 2000. GSI-a geologically friendly tool for rock mass strength estimation. Proc. GeoEng2000 Conference, Melbourne. Invited Papers, vol. 1. Technomic Publishing Co., Inc., Pennsylvania, pp. 1422 -1440.
- Marinos, P., Hoek, E., 2001. Estimating the geotechnical properties of heterogeneous rock masses such as flysch. Bull. Int. Assoc. Eng. Geol. 60, 85 -92.
- Norbury, D.R., 1986. The point load test. In: Hawkins, A.B. (Ed.), Site Investigation Practice: Assessing BS 5930. Geological So- ciety, London, pp. 325 -329.
- Ramamurthy, T., 2001. Shear strength response of some geological materials in triaxial compression. Int. J. Mech. Min. Sci. 38, 683 -697.
- Rockdata, P., 1991 -2001. Analysis of Laboratory Strength Data. Rocscience, Inc., Toronto, Canada (software program).
- Romana, M., 1999. Correlation between uniaxial compressive and point-load (Franklin test) strengths for different rock classes. 9th ISRM Congress, vol. 1. Balkema, Paris, pp. 673 -676.
- Thuro, K., Plinninger, R.J., 2001. Scale effects in rock properties: Part 2. Point load test and point load strength index. In: Sarkka, P., Eloranta, P. (Eds.), EUROCK Swets and Zeitlinger, Lisse, pp. 175 -180.