Quantifying the Relative Importance of Predictors in Multiple Linear Regression Analyses for Public Health Studies (original) (raw)
Abstract
AI
Quantifying the relative importance of predictors in multiple linear regression analysis is crucial for understanding the influence of different factors on outcome variables. This paper examines various definitions of predictor relative importance, focusing on dispersion importance, which reflects the proportion of variance in the response variable accounted for by each predictor. Using data from public health studies, the authors present methodologies for calculating relative importance indices, comparing their effectiveness through examples and comprehensive statistical analyses.
Figures (8)
To cite this Article: Chao, Yi-Chun E., Zhao, Yue, Kupper, Lawrence L. and Nylander-French, Leena A. (2008) ‘Quantifying the Relative Importance of Predictors in Multiple Linear Regression Analyses for Public Health Studie: Journal of Occupational and Environmental Hygiene, 5:8, 519 — 529
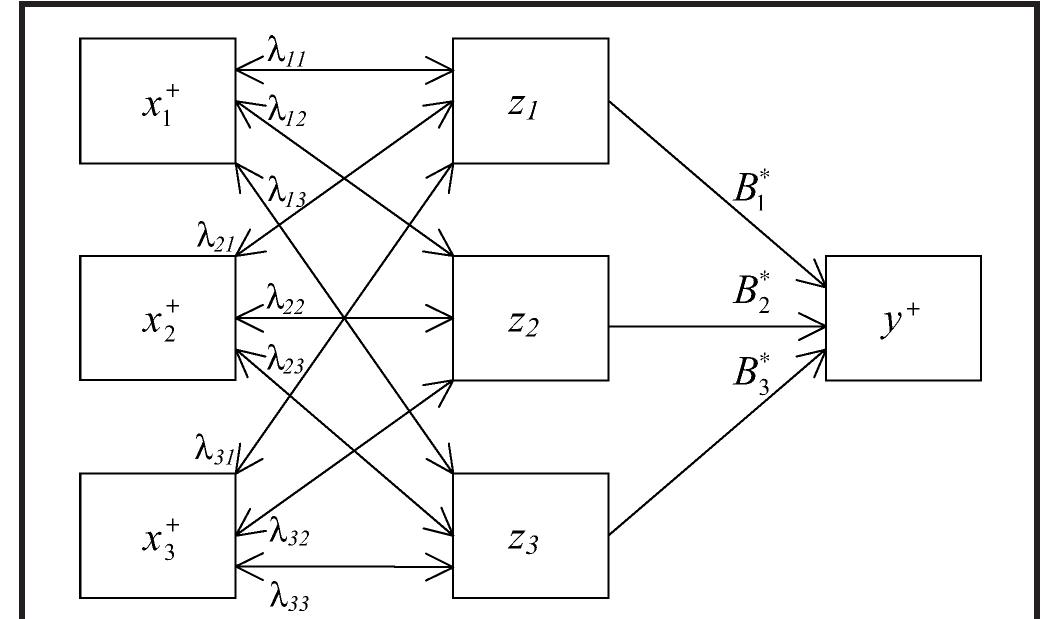
FIGURE 1. Graphic representation of Johnson’s Relative Weight for a regression model with three predictors (adapted from Refer- ence 9). The original predictors x}, x7, and x are transformed to their maximally related orthogonal counterparts, z;, z2, and 23. The regression coefficients of y* on z;, z2, and z3 are represented by By, B3, and B, respectively, and the regression coefficients of x7 on z, are represented by jx, where j=1,2,3 and k=1, 2, 3. For example, the regression coefficients of wf or x; on Z1, 22, and z3 are represented by Ait, Aiz2, and A13, respectively. Johnson’s Relative Weight for xy or x; would then be calculated gece. — )2 Bx2 172 px2 1 72- ao 7-192.
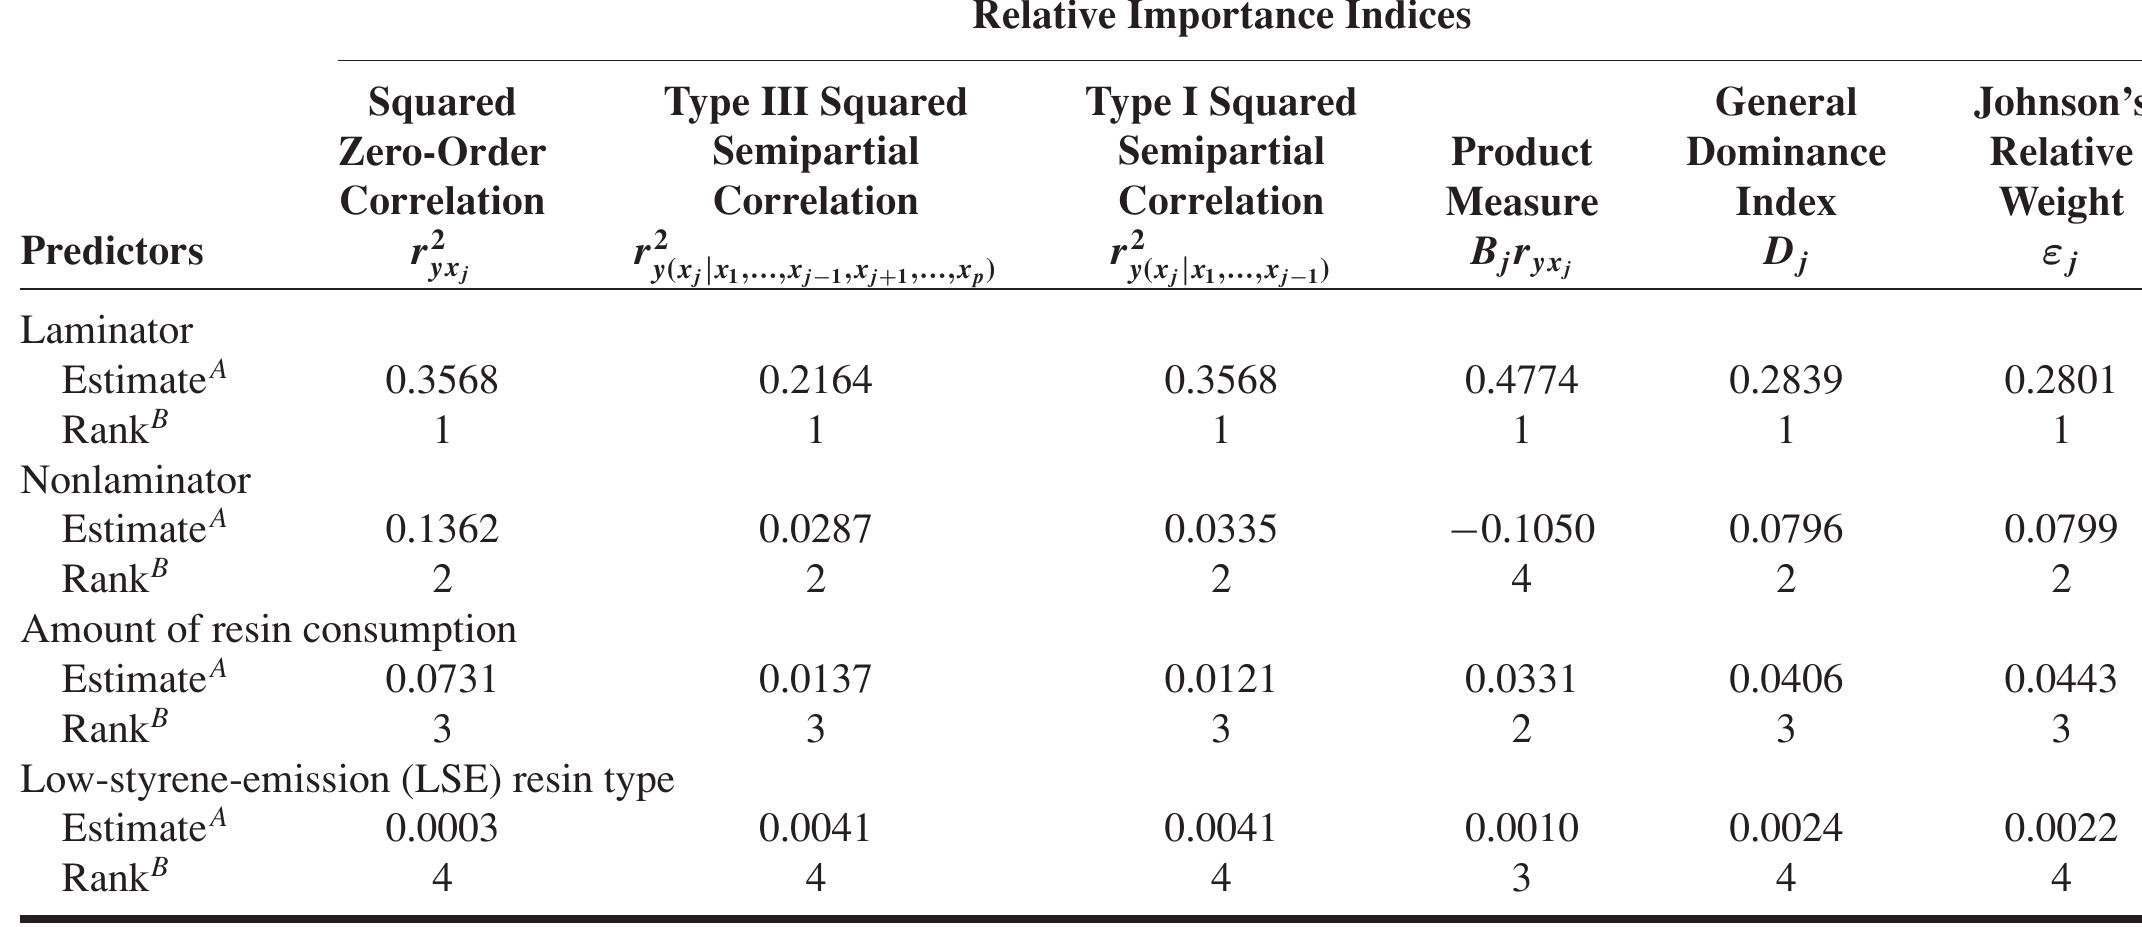
Note: Example 1, Styrene exposure level as the outcome variable, n = 214. AThe value of the relative importance index estimated from the original data set. ® The rank is determined by comparing the estimated relative importance values. The rank of | indicates the most important predictor, the rank of 2 indicates the second most important predictor, etc. TABLE I. Measures of Relative Importance for Example 1
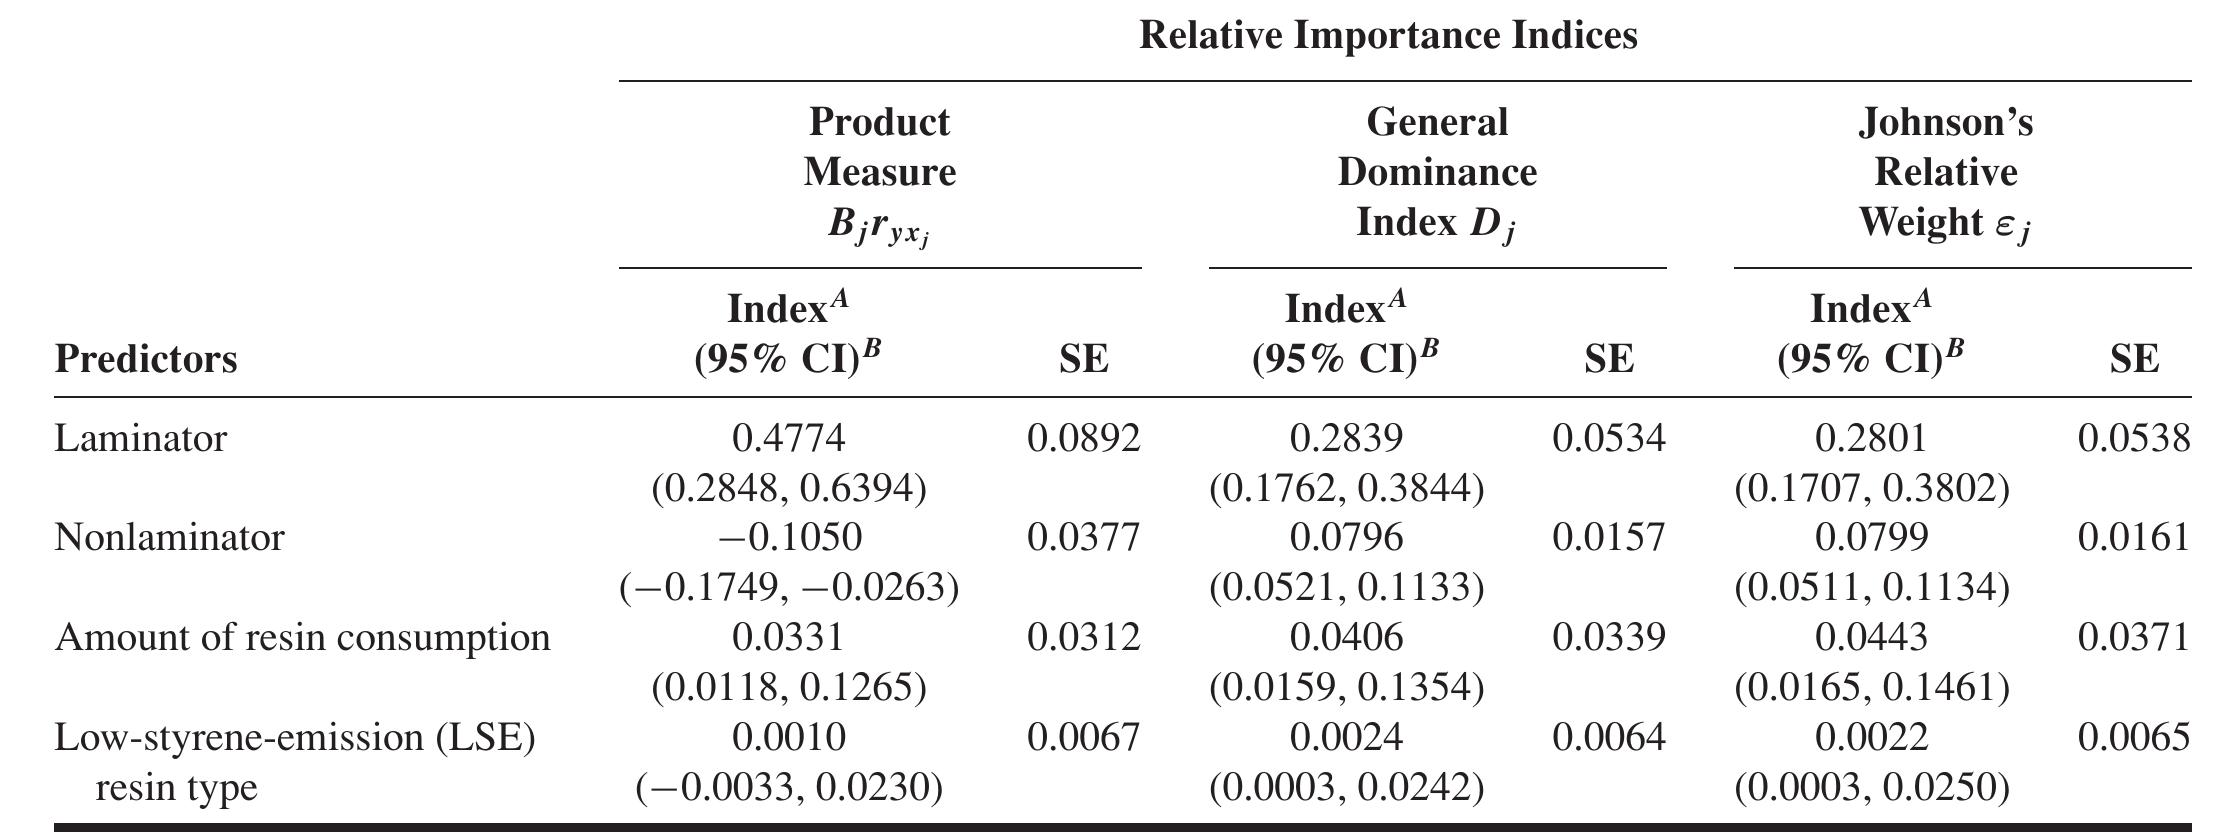
Note: Example 1, 1500 bootstrap replications. AThe single value above the 95% Cl is the value of the relative importance index estimated from the original data set 8 The 95% bootstrap confidence interval for the corresponding relative importance index. TABLE Il. Bootstrap Standard Errors (SE) and 95% Confidence Intervals (Cl) for Three Relative Importance Indices Used in Example 1
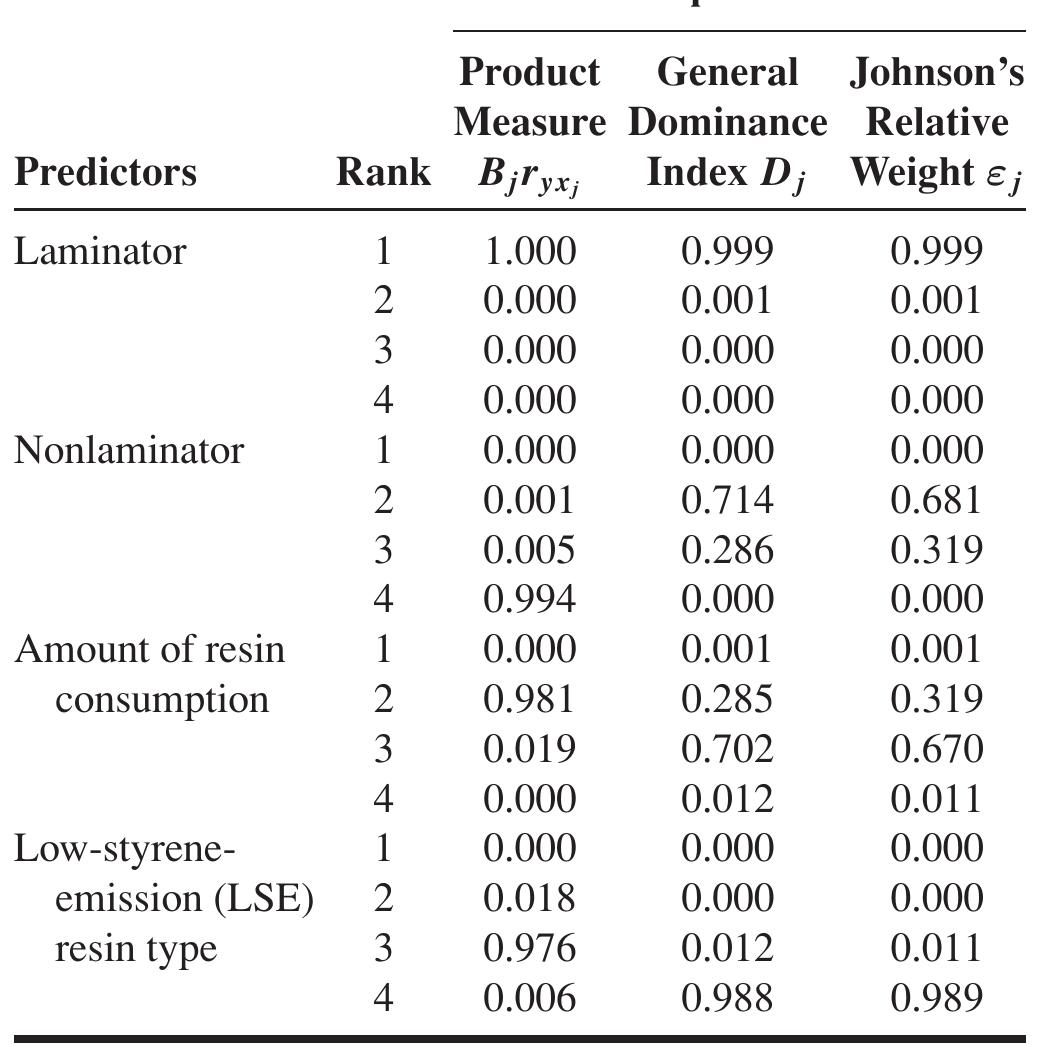
Notes: Example 1, 1500 bootstrap replications. The rank of | indicates the most important predictor, the rank of 2 indicates the second most important predictor, etc.
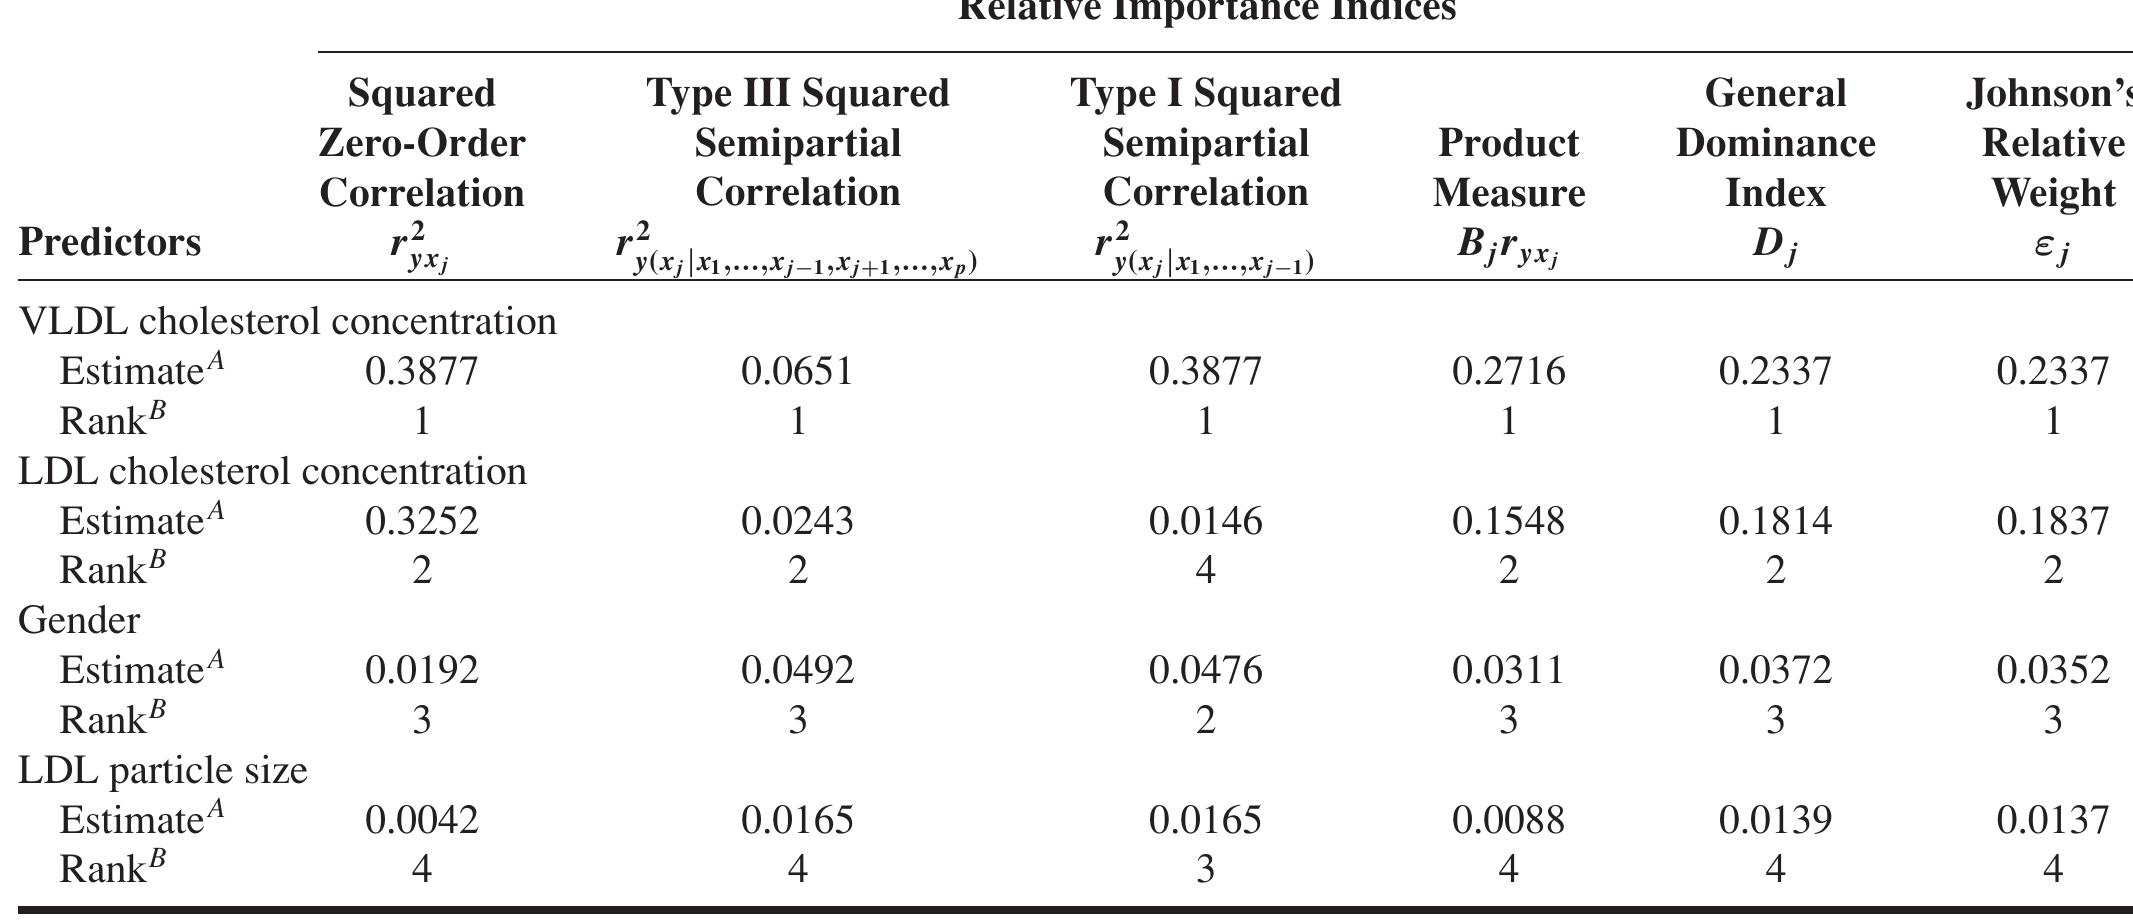
Note: Example 2, aortic cholesterol concentration as the outcome variable (n = 153). AThe value of the relative importance index estimated from the original data set. ® The rank is determined by comparing the estimated relative importance values. The rank of | indicates the most important predictor, the rank of 2 indicates the second most important predictor, etc. TABLE IV. Measures of Relative Importance for Example 2
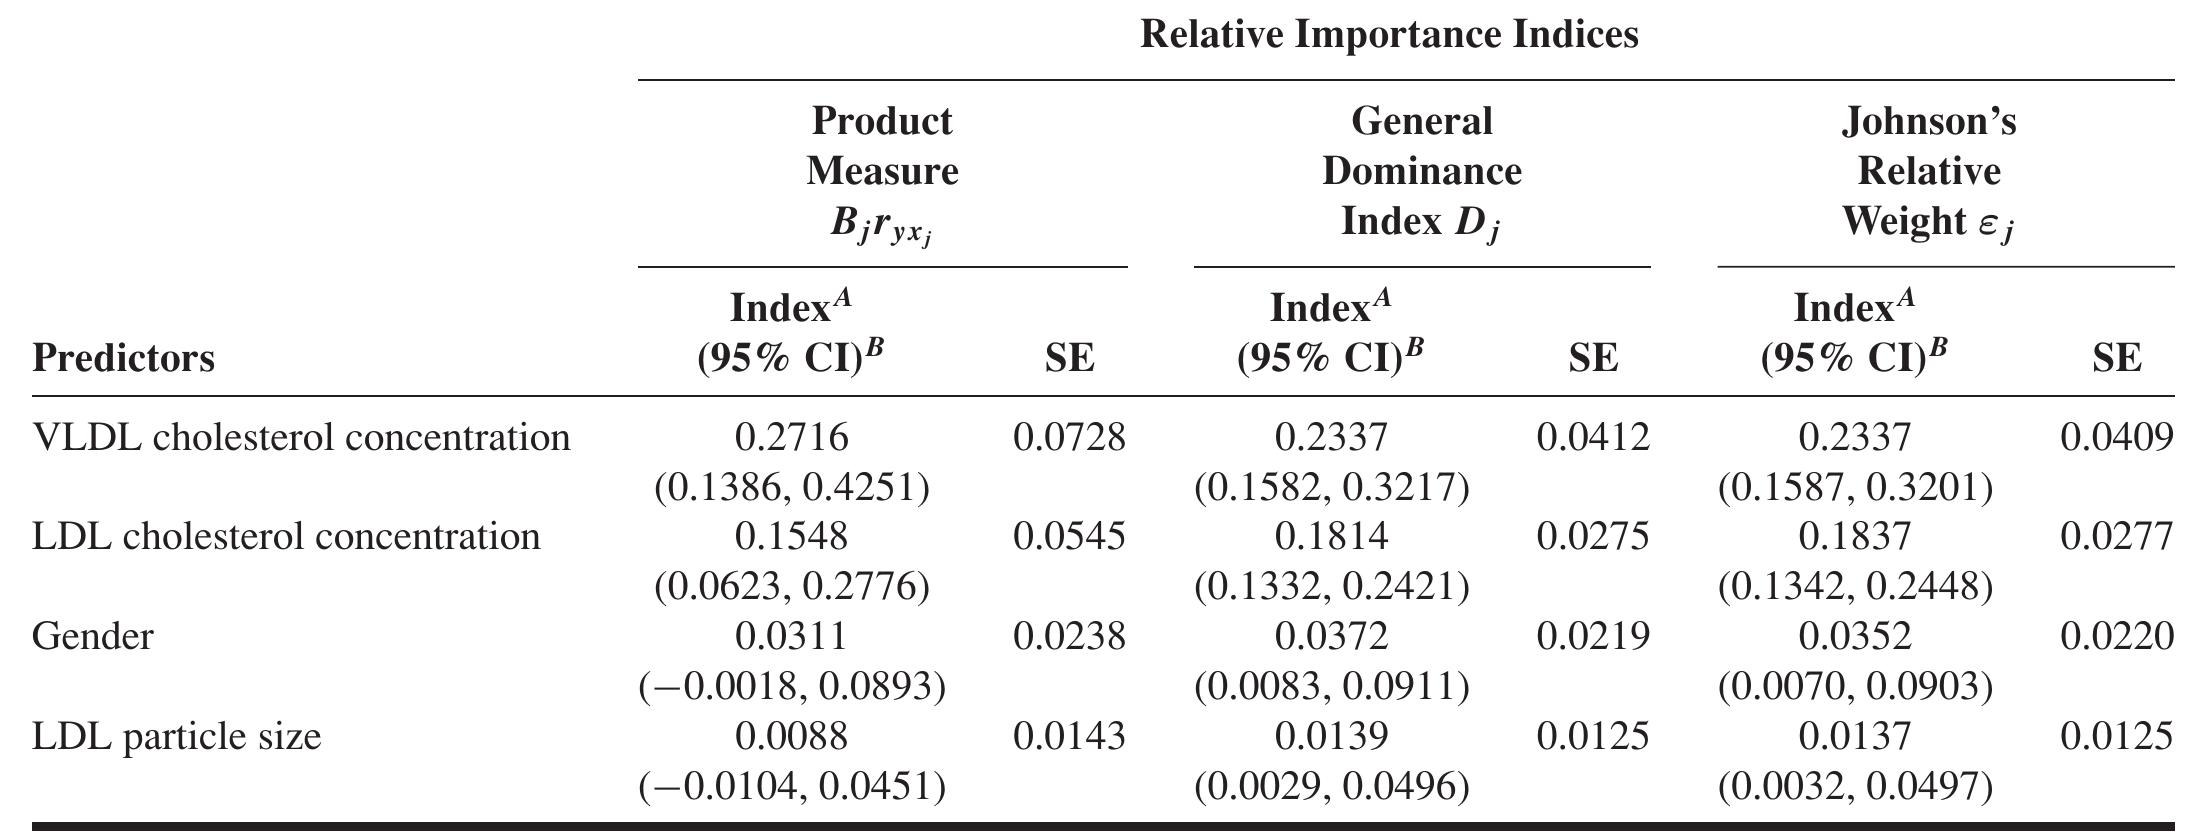
Note: Example 2, 1500 bootstrap replications. AThe single value above the 95% Cl is the value of the relative importance index estimated from the original data set ® The 95% bootstrap confidence interval for the corresponding relative importance index. TABLE V. Bootstrap Standard Errors (SE) and 95% Confidence Intervals (Cl) for Three Relative Importance Indices Used in Example 2
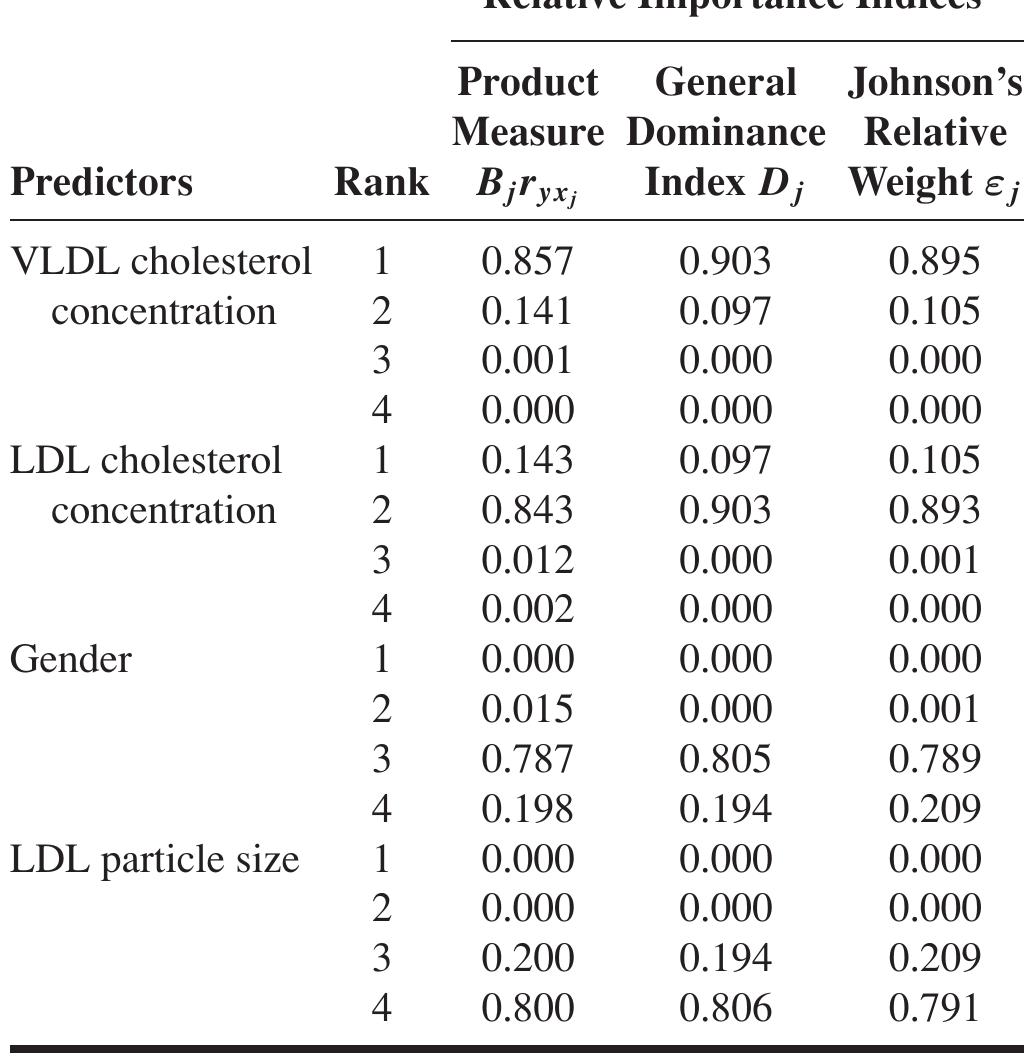
Notes: Example 2, 1500 bootstrap replications. The rank of | indicates the most important predictor, the rank of 2 indicates the second most important predictor, etc. TABLE VI. Bootstrap Relative Frequency Distribu- tion for Predictor Rankings Based on Three Impor- tance Indices Used in Example 2

Loading Preview
Sorry, preview is currently unavailable. You can download the paper by clicking the button above.
References (46)
- Boogaard, P.J., and N.J. van Sittert: Urinary 1-hydroxypyrene as biomarker of exposure to polycyclic aromatic hydrocarbons in workers in petrochemical industries: baseline values and dermal uptake. Sci. Total. Environ. 163:203-209 (1995).
- Chao, Y.C., L.L. Kupper, B. Serdar, et al.: Dermal exposure to jet fuel JP-8 significantly contributes to the production of urinary naphthols in fuel-cell maintenance workers. Environ. Health Perspect. 114:182-185 (2006).
- Malcoe, L.H., R.A. Lynch, M.C. Keger, et al.: Lead sources, be- haviors, and socioeconomic factors in relation to blood lead of native American and white children: A community-based assessment of a former mining area. Environ. Health Perspect. 110 (Suppl 2):221-231 (2002).
- Eskenazi, B., P. Mocarelli, M. Warner, et al.: Relationship of serum TCDD concentrations and age at exposure of female residents of Seveso, Italy. Environ. Health Perspect. 112:22-27 (2004).
- Healey, M.J.R.: Measuring importance. Stat. Med. 9:633-637 (1990).
- Achen, C.H.: Interpreting and Using Regression. Beverly Hills, Calif.: Sage Publications, 1982.
- Bring, J.: How to standardize regression coefficients. Am. Stat. 48:209- 213 (1994).
- Bring, J.: A geometric approach to compare variables in a regression model. Am. Stat. 50:57-62 (1996).
- Johnson, J.W., and J.M. LeBreton: History and use of relative impor- tance indices in organizational research. Organ. Res. Methods 7:238-257 (2004).
- Kruskal, W.: Relative importance by averaging over orderings. Am. Stat. 41:6-10 (1987).
- Pratt, J.: Dividing the invisible: Using simple symmetry to partition variance explained. In Second International Tampere Conference in Statistics. Department of Mathematical Sciences, University of Tampere, Tampere, Finland, 1987.
- Thomas, R.D., E. Hughes, and B.D. Zumbo: On variable importance in linear regression. Soc. Indic. Res. 45:253-275 (1998).
- Ward, J.H.: Comments on "The Paramorphic Representation of Clinical Judgement." Psychological Bulletin 59:74-76 (1962).
- Gibson, W.A.: Orthogonal predictors: A possible resolution of Hoffman- ward controversy. Psychological Reports 11:32-34 (1962).
- Anderson-Sprecher, R.: Model comparisons and R 2 . Am. Stat. 48:113- 117 (1994).
- Kruskal, W., and R. Majors: Concepts of relative importance in recent scientific literature. Am. Stat. 43:2-6 (1989).
- Hoffman, P.J.: The paramorphic representation of clinical judgment. Psychol. Bull. 59:77-80 (1960).
- Lindeman, R.H., Merenda, P.F., and Gold, R.Z.: Introduction to Bivariate and Multivariate Analysis. Glenview, Ill.: Scott, Foresman and Company, 1980.
- Budescu, D.V.: Dominance analysis: A new approach to the problem of relative importance of predictors in multiple regression. Psychol. Bull. 114:542-551 (1993).
- Johnson, J.W.: A heuristic method for estimating the relative weight of predictor variables in multiple regression. Multivar. Behav. Res. 35:1-19 (2000).
- Cohen, J., and P. Cohen: Applied Multiple Regression/Correlation Analysis for the Behavioral Sciences, 2nd ed. Edison, N.J.: Lawrence Erlbaum Associates, Inc., 1983.
- Cyrys, J., M. Pitz, W. Bischof, et al.: Relationship between indoor and outdoor levels of fine particle mass, particle number concentrations and black smoke under different ventilation conditions. J. Expo. Anal. Environ. Epidemiol. 14:275-283 (2004).
- Ettinger, A.S., M.M. Tellez-Rojo, C. Amarasiriwardena, et al.: Effect of breast milk lead on infant blood lead levels at 1 month of age. Environ. Health Perspect. 112:1381-1385 (2004).
- Fustinoni, S., D. Consonni, L. Campo, et al.: Monitoring low ben- zene exposure: comparative evaluation of urinary biomarkers, influence of cigarette smoking, and genetic polymorphisms. Cancer Epidemiol. Biomarkers Prev. 14:2237-2244 (2005).
- Harris, S.A., A.M. Sass-Kortsak, P.N. Corey, et al.: Development of models to predict dose of pesticides in professional turf applicators. J. Expo. Anal. Environ. Epidemiol. 12:130-144 (2002).
- Levesque, B., P. Ayotte, A. LeBlanc, et al.: Evaluation of dermal and respiratory chloroform exposure in humans. Environ. Health Perspect. 102:1082-1087 (1994).
- Scherer, G., U. Kramer, I. Meger-Kossien, et al.: Determinants of children's exposure to environmental tobacco smoke (ETS): A study in Southern Germany. J. Expo. Anal. Environ. Epidemiol. 14:284-292 (2004).
- Serdar, B., P.P. Egeghy, R. Gibson, et al.: Dose-dependent production of urinary naphthols among workers exposed to jet fuel (JP-8). Am. J. Ind. Med. 46:234-244 (2004).
- Van Rooij, J.G., M.M. Bodelier-Bade, and F.J. Jongeneelen: Estima- tion of individual dermal and respiratory uptake of polycyclic aromatic hydrocarbons in 12 coke oven workers. Br. J. Ind. Med. 50:623-632 (1993).
- Waidyanatha, S., Y. Zheng, B. Serdar, et al.: Albumin adducts of naphthalene metabolites as biomarkers of exposure to polycyclic aromatic hydrocarbons. Cancer Epidemiol. Biomarkers Prev. 13:117-124 (2004).
- Wong, R.H., C.Y. Kuo, M.L. Hsu, et al: Increased levels of 8- hydroxy-2-deoxyguanosine attributable to carcinogenic metal expo- sure among schoolchildren. Environ. Health. Perspect. 113:1386-1390 (2005).
- Johnson, R.M.: The minimal transformation of orthonormality. Psy- chometrika 31:61-66 (1966).
- Efron, B.: Bootstrap method: Another look at the Jackknife. Ann. Stat. 7:1-26 (1979).
- Efron, B., and R. Tibshriani: An Introduction to the Bootstrap. In Monographs on Statistics and Applied Probability Series. New York: Chapman and Hall/CRC, 1993.
- Nylander-French, L.A., L.L. Kupper, and S.M. Rappaport: An investigation of factors contributing to styrene and styrene-7,8-oxide exposures in the reinforced-plastics industry. Ann. Occup. Hyg. 43:99- 105 (1999).
- Rudel, L.L., K. Kelley, J.K. Sawyer, et al.: Dietary monounsaturated fatty acids promote aortic atherosclerosis in LDL receptor-null, human ApoB100-overexpressing transgenic mice. Arterioscler. Thromb. Vasc. Biol. 18:1818-1827 (1998).
- Lin, C., R. Kim, S.W. Tsaih, et al.: Determinants of bone and blood lead levels among minorities living in the Boston area. Environ. Health Perspect. 112:1147-1151 (2004).
- Schafer, J.H., T.A. Glass, J. Bressler, et al.: Blood lead is a predictor of homocysteine levels in a population-based study of older adults. Environ. Health Perspect. 113:31-35 (2005).
- Wright, J.M., J. Schwartz, T. Vartiainen, et al.: 3-Chloro-4- (dichloromethyl)-5-hydroxy-2(5H)-furanone (MX) and mutagenic activ- ity in Massachusetts drinking water. Environ. Health Perspect. 110:157- 164 (2002).
- de la Paz, M.P., R.M. Philen, F. Gerr, et al.: Neurologic outcomes of toxic oil syndrome patients 18 years after the epidemic. Environ. Health Perspect. 111:1326-1334 (2003).
- Fertmann, R., I. Tesseraux, M. Schumann, et al.: Evaluation of ambient air concentrations of polycyclic aromatic hydrocarbons in Germany from 1990 to 1998. J. Expo. Anal. Environ. Epidemiol. 12:115-123 (2002).
- Yiin, L.M., G.G. Rhoads, and P.J. Lioy: Seasonal influences on childhood lead exposure. Environ. Health Perspect. 108:177-182 (2000).
- Azen, R., and D.V. Budescu: The dominance analysis approach for comparing predictors in multiple regression. Psychol. Methods 8:129- 148 (2003).
- Lebreton, J.M., R.E. Ployhart, and R.T. Ladd: A Monte Carlo comparison of relative importance methodologies. Organ. Res. Methods 7:258-282 (2004).
- Darlington, R.B.: Multiple regression in psychological research and practice. Psychological Bulletin 69:161-182 (1968).
- Green, P.E., J.D. Carroll, and W.S. De Sarbo: A new measure of new predictor variable importance in multiple regression. Journal of Marketing Research 15:356-360 (1978).
