Physicochemical and Microbiological Analyses of Bacterial Isolates from Drinking Water Distribution Systems of Some Higher Institutions in Edo State, Nigeria (original) (raw)
Physicochemical and Microbiological Analyses of Bacterial Isolates from Drinking Water Distribution Systems of Some Higher Institutions in Edo State, Nigeria
*1ENAIGBE, AA; 2{ }^{2} EKHAISE, FO; 2{ }^{2} IDEMUDIA, IB; 1{ }^{1} AKPOKA, AO
1{ }^{1} Department of Microbiology, College of Applied and Natural Sciences, Igbinedion University, Okada, Nigeria.
2{ }^{2} Department of Microbiology, Faculty of Life Sciences, University of Benin, Benin City, Nigeria
*Corresponding Author Email: andrewenaigbe89@gmail.com; Tel.: +2348131230105
Abstract
In drinking water systems, a large number of microorganisms live in complex communities in a selfproduced extracellular polymeric matrix associated with inner surfaces of pipes, walls and floors of storage tanks, joints and faucets. This study was aimed at analyzing the physicochemical and microbiological characteristics of bacterial isolates of drinking water distribution systems in some higher institutions in Edo State. The physicochemical parameters were determined by using standard protocol and microbiological water quality was conducted using the standard microbiological methods. The results of the physicochemical analysis showed that, the pH values ranged between 4.17 and 5.89. The highest (5.89) was recorded with samples from OK-R and the least (4.17) was obtained from UB-T. The electrical conductivity (EC) values for SA-R (104.8μ S/cm)(104.8 \mu \mathrm{~S} / \mathrm{cm}), AA-R (105.5μ S/cm)(105.5 \mu \mathrm{~S} / \mathrm{cm}) and OKR (114.8μ S/cm)(114.8 \mu \mathrm{~S} / \mathrm{cm}) exceeded the permissible threshold value of 100μ S/cm100 \mu \mathrm{~S} / \mathrm{cm}. Concentrations of lead for AA-R (0.02mg/L)(0.02 \mathrm{mg} / \mathrm{L}) and OK-R (0.03mg/L)(0.03 \mathrm{mg} / \mathrm{L}) were significantly higher than the acceptable level of 0.01mg/L0.01 \mathrm{mg} / \mathrm{L}. The mean total heterotrophic bacterial counts ranged from 3.3 ±0.3×10²cfu/mL\pm 0.3 \times 10^{2} \mathrm{cfu} / \mathrm{mL} to 9.3±0.3×10³cfu/mL9.3 \pm 0.3 \times 10^{3} \mathrm{cfu} / \mathrm{mL}, with the least and highest counts recorded for UB-R and AA-R. Phenotypically identified bacteria were the Citrobacter, Klebsiella, Bacillus, Pseudomonas, Proteus and Providencia species. The study revealed that drinking water system of biofilms is a reservoir for microorganisms that could cause public health concerns which is impacted by the presence of available nutrient, environmental conditions and heavy metals.
DOI: https://dx.doi.org/10.4314/jasem.v23i5.22
Copyright: Copyright © 2019 Enaigbe et al. This is an open access article distributed under the Creative Commons Attribution License (CCL), which permits unrestricted use, distribution, and reproduction in any medium, provided the original work is properly cited.
Dates: Received: 28 April 2018; Revised: 21 May 2019; Accepted 23 May 2019
Keywords: biofilm, bacterial load, physicochemical, regression and level of significance.
The consumption of contaminated water by large population in University communities is a major cause of diarrhea-disease related mortality. This is heightened as the health risk from biofilms in distribution systems has resulted in high incident rate of gastrointestinal disorders, urinary and respiratory tract infections, induced aesthetic features consisting of odour, colour and taste degradation due to chemical compounds released by the host microbes (Onifade and Iiori (2008). In compliance with stipulated standards for monitoring the presence of pathogens in biofilm water samples, the conventional heterotrophic bacterial count and assessment of pollution indicator organisms like culturable total and faecal coliforms, are relatively and frequently used. Similarly, besides the microbiological status of these source waters, their physicochemical and heavy metals characteristics are other useful parameters employed to evaluate their qualities (Joanne, et al., 2011; Razafitsiferana et al., 2017).
The aim of this study was to determine the physicochemical and microbiological parameters of
drinking water distribution systems of some higher institutions in Edo State, Nigeria
MATERIALS AND METHODS
Sample collections: The biofilm water samples were collected from the reservoir stations (storage tanks), distribution pipelines and collection points (taps) from five higher institutions in Edo State (UB, OK, AA, SA and AC) from the three senatorial districts in Edo State, Nigeria. The samples were collected by scrapping the surfaces or walls in contact with water with sterile steel blades.
Physicochemical Analysis: The pH , temperature, turbidity and electrical conductivity were determined according to standard methods (Ademoroti, 2006). The concentrations of metals and salts viz: Sodium, potassium, calcium, phosphorus, iron, lead, chloride, nitrate, nitrite, ammonium, phosphate and bicarbonate were done using Atomic Absorption Spectrophotometer (AAS). The total carbon was analyzed by the standard methods for the examination
of water and waste water by the American Public Health Association (APHA, 2005; Ackah et al., 2012).
Isolation and Enumeration of bacteria: Isolation of bacteria from biofilm water samples was performed by standard methods of pour plating using nutrient agar and MacConkey agar. The plates were incubated at 28 ±2∘C\pm 2^{\circ} \mathrm{C} for 24 hr and distinct bacterial colonies in the nutrient agar and MacConkey agar plates were used to respectively deduce the heterotrophic bacteria counts (HBC) and total coliform counts (TCC). (Geldreich, 1999; Barrow and Feltham, 2003; Tiwari and Singh, 2014).
Identification and characterization of bacteria: Six bacterial colonies were picked based on their different colonial morphologies and each of them was phenotypically characterized with prescribed standard methods (Barrow and Feltham, 2003; APHA, 2005).
Statistical Analysis: The statistical significance was performed using students T- test to compare the means of physicochemical parameters of the water sample. One way analysis of variance was applied to determine the means of parameters of the different sampling sites. The correlation between sample counts and physicochemical parameters was done using Pearson’s correlation coefficient values.
RESULTS AND DISCUSSION
The results of the physicochemical analyses revealed that, the pH values ranged from 4.17 to 5.89 for all samples studied and were less than the standard range (6.5 to 8.5 ). The electrical conductivity (EC) of SA-R (104.8μ S/cm)(104.8 \mu \mathrm{~S} / \mathrm{cm}), AA-R (105.5μ S/cm)(105.5 \mu \mathrm{~S} / \mathrm{cm}) and OK-R (114.8 μS/cm\mu \mathrm{S} / \mathrm{cm} ) were significantly higher than the permissible
limit of 100μ S/cm100 \mu \mathrm{~S} / \mathrm{cm} (Table 1). The concentration of iron (Fe)(\mathrm{Fe}) for AA(0.3mg/L)\mathrm{AA}(0.3 \mathrm{mg} / \mathrm{L}) was recorded above the permissible limit of 0.2mg/L0.2 \mathrm{mg} / \mathrm{L}. Concentrations of lead (Pb)(\mathrm{Pb}) for AA (0.02mg/L)(0.02 \mathrm{mg} / \mathrm{L}) and OK (0.03mg/L)(0.03 \mathrm{mg} / \mathrm{L}) were significantly higher than standard level of 0.01mg/L0.01 \mathrm{mg} / \mathrm{L}. The nitrite concentration of AA (0.3mg/L)(0.3 \mathrm{mg} / \mathrm{L}) exceeded the maximum threshold level (0.2mg/L)(0.2 \mathrm{mg} / \mathrm{L}) (Table 2). The mean total heterotrophic bacterial counts (HBC) was reported to range between 3.3±0.3×10²cfu/mL3.3 \pm 0.3 \times 10^{2} \mathrm{cfu} / \mathrm{mL} and 9.3±0.3×10²cfu/mL9.3 \pm 0.3 \times 10^{2} \mathrm{cfu} / \mathrm{mL}. The lowest count, 3.3±3.3 \pm 0.3×10²cfu/m0.3 \times 10^{2} \mathrm{cfu} / \mathrm{m} was recorded for UB-R and the highest count, 9.3±0.3×10²cfu/mL9.3 \pm 0.3 \times 10^{2} \mathrm{cfu} / \mathrm{mL} was recorded for AA-R (Tables 2). Nevertheless, the investigated water samples were relatively of low coliform counts compared to the heterotrophic bacteria counts. In addition, the bacterial isolates phenotypically identified were Citrobacter, Klebsiella, Bacillus, Pseudomonas, Proteus and Providencia species (Table 3). The highest frequency (percentage) was recorded for Bacillus and Pseudomonas species (23.8 %) and Providencia the least ( 4.78%4.78 \% ) (Table 4). The analysis of the physicochemical parameters revealed that the average pH values ranged from 4.17 to 5.89 (acidic) and all the water samples were below the maximum permissible values of 6.5 to 8.5 outlined by the public water quality standards (Table 1). The pH generally signifies the degree of acidity and alkalinity of a water sample and may be attributed to the carbonic acid fraction of the bicarbonate ions left(mathrmHCO3−right)\left(\mathrm{HCO}_{3}^{-}\right)left(mathrmHCO3−right)in the water samples. Acidity of samples could be responsible for corrosion that caused leakages of pipes, where contaminants gained entrance into the distribution systems leading to increase in turbidity. Low pH causes metals to precipitate as carbonate and hydroxyl and leads to irritation of the eye, skin and mucous membrane (Venkeswara, 2011; Bakker et al., 2014).
Table1. Physicochemical analyses of biofilm water samples
| Sample Sources | Temp | pH | EC | DOC | Col. | Turb | TSS | TDS | TOC | HCO3\mathrm{HCO}_{3} |
|---|---|---|---|---|---|---|---|---|---|---|
| 1. SA-R | 22.3 | 4.61 | 104.9 | 0.047 | ND | ND | 0.0 | 50.2 | 9.3 | 23.7 |
| 2. SA-D | 20.4 | 5.03 | 48.6 | 0.022 | ND | ND | 0.0 | 23.3 | 10.2 | 6.1 |
| 3. AA-T | 22.7 | 4.92 | 60.7 | 0.027 | ND | ND | 0.0 | 29.0 | 8.8 | 13.7 |
| 4. OK-T | 24.1 | 5.89 | 98.7 | 0.045 | ND | ND | 0.0 | 47.2 | 10.5 | 22.3 |
| 5. AA-R | 25.6 | 5.82 | 105.5 | 0.050 | 13.9 | 10.1 | 28.3 | 26.6 | 49.7 | 12.5 |
| 6. SA-T | 24.1 | 4.91 | 53.8 | 0.024 | ND | ND | 0.0 | 25.7 | 9.1 | 10.1 |
| 7. AA-D | 28.4 | 5.14 | 70.4 | 0.032 | 1.4 | 1.1 | 5.9 | 34.8 | 37.6 | 18.8 |
| 8. AC-R | 22.0 | 5.28 | 65.5 | 0.030 | ND | ND | 0.0 | 31.3 | 7.5 | 14.8 |
| 9. OK-R | 25.8 | 4.45 | 114.8 | 0.052 | 15.7 | 12.8 | 31.6 | 54.9 | 54.3 | 27.9 |
| 10. OK -D | 23.2 | 5.27 | 113.1 | 0.051 | 3.3 | 2.7 | 10.4 | 52.8 | 29.1 | 25.5 |
| 11. UB -T | 22.1 | 5.39 | 53.3 | 0.024 | ND | ND | 0.0 | 25.5 | 11.2 | 12.0 |
| 12. UB -R | 22.4 | 4.46 | 63.2 | 0.029 | ND | ND | 0.0 | 30.2 | 6.5 | 14.3 |
| 13. UB -D | 20.5 | 4.17 | 60.7 | 0.027 | ND | ND | 0.0 | 29.0 | 13.8 | 10.7 |
| 14. AC -D | 20.2 | 4.99 | 49.3 | 0.022 | ND | ND | 0.0 | 23.6 | 7.4 | 11.1 |
| 15. AC -T | 23.3 | 4.84 | 68.6 | 0.031 | ND | ND | 0.0 | 36.8 | 8.6 | 15.5 |
| NDWQS/WHO. | 28.0 | 6.5−8.56.5-8.5 | 100 | 0.050 | 15 | 5 | 25 | 50 | 50 | 150 |
| Std. |
ENAIGBE, AA; EKHAISE, FO; IDEMUDIA, IB; AKPOKA, AO
KEY: E.C (Electrical Conductivity), Col.(Colour), TSS (Total suspended solid), TOC(Total organic carbon), TDS (Total dissolved solids), ND (Not detected), NDWQS/WHO (Nigerian drinking water quality standard/World Health Organization), UB, OK, SA, AA and AC represented the institutions; RR (reservoir), TT (Tap), DD (Distribution pipeline)
Table 2. Physicochemical analysis of biofilm water samples
| Sample Sources | Na | K | Ca | Mg | Cl | P | NH4N\mathbf{N H}_{4} \mathbf{N} | NO2\mathbf{N O}_{2} | NO3\mathbf{N O}_{3} | SO4\mathbf{S O}_{4} | Fe | Pb |
|---|---|---|---|---|---|---|---|---|---|---|---|---|
| 1. SA-R | 0.96 | 0.15 | 1.69 | 0.65 | 27.7 | 0.047 | 0.049 | 0.031 | 1.12 | 0.84 | ND | ND |
| 2. SA-D | 0.53 | 0.08 | 0.93 | 0.36 | 12.8 | 0.75 | 0.078 | 0.018 | 1.79 | 0.32 | ND | ND |
| 3. AA-T | 0.74 | 0.11 | 1.30 | 0.50 | 16.0 | 0.39 | 0.040 | 0.026 | 0.93 | 0.55 | ND | ND |
| 4. OK-T | 0.82 | 0.19 | 1.72 | 0.55 | 26.1 | 0.81 | 0.084 | 0.033 | 1.93 | 0.79 | 0.1 | ND |
| 5. AA-R | 0.48 | 0.07 | 1.84 | 0.32 | 14.7 | 4.16 | 0.431 | 0.174 | 7.10 | 0.44 | 0.3 | 0.02 |
| 6. SA-T | 0.59 | 0.09 | 1.33 | 0.44 | 14.2 | 0.29 | 0.030 | 0.015 | 0.69 | 0.33 | ND | ND |
| 7. AA-D | 0.68 | 0.10 | 1.20 | 0.56 | 18.6 | 1.20 | 0.124 | 0.078 | 3.86 | 0.56 | 0.2 | ND |
| 8. AC-R | 0.79 | 0.12 | 1.39 | 0.43 | 17.3 | 0.77 | 0.080 | 0.051 | 1.23 | 0.62 | ND | ND |
| 9. OK-R | 1.23 | 0.19 | 2.16 | 0.92 | 30.3 | 5.92 | 0.615 | 0.292 | 8.17 | 0.92 | 0.6 | 0.03 |
| 10. OK -D | 1.11 | 0.17 | 1.95 | 0.85 | 29.9 | 1.58 | 0.167 | 0.104 | 5.76 | 0.80 | 0.1 | ND |
| 11. UB -T | 0.61 | 0.09 | 1.52 | 0.41 | 14.1 | 0.81 | 0.084 | 0.053 | 1.93 | 0.43 | ND | ND |
| 12. UB -R | 0.72 | 0.05 | 1.27 | 0.59 | 17.7 | 0.64 | 0.066 | 0.042 | 1.52 | 0.51 | ND | ND |
| 13. UB -D | 0.64 | 0.10 | 1.80 | 0.43 | 16.0 | 0.36 | 0.037 | 0.024 | 0.86 | 0.49 | ND | 0.01 |
| 14. AC-D | 0.58 | 0.11 | 1.72 | 0.39 | 13.0 | 0.95 | 0.099 | 0.063 | 2.26 | 0.38 | ND | ND |
| 15. AC -T | 0.71 | 0.09 | 1.25 | 0.68 | 18.1 | 0.53 | 0.055 | 0.035 | 1.27 | 0.51 | ND | ND |
| NDWQS/W | 200 | 200 | 75 | 0.2 | 200 | 100 | 100 | 0.2 | 50 | 200 | 0.3 | 0.01 |
| HO. Std. |
KEY: (Not detected), NDWQS/WHO (Nigerian drinking water quality standard/World Health Organization), UB OK, SA, AA and AC (the institutions); RR (reservoir), TT (Tap), DD (distribution pipeline)
The concentration of heterotrophic bacterial count (HBC) increases with pH and there was no significant difference between the two variables. (Fig.1). There was an increase in the concentration of HBC to turbidity, but the regression was not significant P>\mathrm{P}> 0.05 (Fig. 1.3). The increase in turbidity may indicate the presence of heterotrophic pathogenic microbes in water sources from where these samples were collected. The levels of turbidity exceeded the maximum acceptable limits of 5 NTU in samples 5, 7, 9 and 10 (Table 1.1). The total suspended solids (TSS) and total dissolved solids (TDS) in the turbid samples enhanced the increased turbidity and also provided excellent sources of nutrition, thus creating a reservoir of pathogenic microbes hosted by the biofilm, which could be released to further contaminate the water.
The electrical conductivity (EC) measures the ability of an aqueous solution to transmit an electric current and directly related to the dissolved ions present in water, mobility, valence and temperature (Geldreich, 1999; Ackah et al., 2012). The observed EC values for the water samples ranged from 48.6 to 114.8μ S/cm114.8 \mu \mathrm{~S} / \mathrm{cm} with values for SA-R (104.9μ S/cm)(104.9 \mu \mathrm{~S} / \mathrm{cm}), AA-R (105.5μ S/cm)(105.5 \mu \mathrm{~S} / \mathrm{cm}), OK-D (113.1μ S/cm)(113.1 \mu \mathrm{~S} / \mathrm{cm}) and OK-R (114.8μ S/cm)(114.8 \mu \mathrm{~S} / \mathrm{cm}) exceeding the threshold value of 100 μS/cm\mu \mathrm{S} / \mathrm{cm} (Table1.1). The concentration of HBC has a linear relationship with electricity conductivity and regression was significant, P<0.05\mathrm{P}<0.05 (Fig 2).
In this study, the values for nitrate (NO3)\left(\mathrm{NO}_{3}\right) were within the standard (10.0mg/L)(10.0 \mathrm{mg} / \mathrm{L}), while most of the nitrite (NO2)\left(\mathrm{NO}_{2}\right) values were recorded lower than maximum limit of 0.2mg/L0.2 \mathrm{mg} / \mathrm{L}. However, samples AA-R ( 0.217 mg/L\mathrm{mg} / \mathrm{L} ) and OK-R (0.292mg/L)(0.292 \mathrm{mg} / \mathrm{L}) were significantly
higher than the standard (Table 2). This, therefore posed great risk associated with methanoglobinaemia and blue baby syndrome (Rethlefsen, 2013). The concentration of Iron (Fe) level was not detected in most samples investigated, but was recorded only in OK-R (0.6mg/l)(0.6 \mathrm{mg} / \mathrm{l}) and higher than standard limit ( 0.3 mg/l)\mathrm{mg} / \mathrm{l}) (Table 2). The concentration of HBC increases with iron, but the regression was not significant (Fig. 2). Excess accumulation of iron in parts of the body where they are stored results in disease condition referred to as hemochromatosis. Iron has also been associated with liver cirrhosis, heart, pancreatic damages, diabetics, nausea, vomiting and stains surfaces, giving water metallic taste and different colour (Razafitsiferana et al., 2017).
Table 2. Bacterial Load of biofilm water samples
| S/N | Sample | Heterotrophic Bacteria Count (HBC) cfu/ml 110−1\mathbf{c f u} / \mathbf{m l ~}^{1} \mathbf{1 0}^{-1} | Total Coliform Count (TCC)(\mathbf{T C C}) cfu/ml\mathbf{c f u} / \mathbf{m l} 10−1\mathbf{1 0}^{-1} |
|---|---|---|---|
| 1 | SA-R | 7.0±0.67.0 \pm 0.6 | 3.5±0.33.5 \pm 0.3 |
| 2 | SA- D | 6.6±0.56.6 \pm 0.5 | 2.4±0.22.4 \pm 0.2 |
| 3 | AA-T | 8.3±028.3 \pm 02 | 2.7±0.42.7 \pm 0.4 |
| 4 | OK -T | 6.3±0.36.3 \pm 0.3 | 2.1±0.22.1 \pm 0.2 |
| 5 | AA-R | 9.3±0.39.3 \pm 0.3 | 3.5±0.23.5 \pm 0.2 |
| 6 | SA-T | 4.3±0.14.3 \pm 0.1 | 2.7±0.42.7 \pm 0.4 |
| 7 | AA-D | 3.7±0.33.7 \pm 0.3 | 2.2±0.22.2 \pm 0.2 |
| 8 | AC-R | 6.1±0.16.1 \pm 0.1 | 2.7±0.22.7 \pm 0.2 |
| 9 | OK-R | 6.1±0.36.1 \pm 0.3 | 2.6±0.22.6 \pm 0.2 |
| 10 | OK-D | 3.7±0.23.7 \pm 0.2 | 2.2±0.22.2 \pm 0.2 |
| 11 | UB-D | 7.1±0.57.1 \pm 0.5 | 2.7±0.42.7 \pm 0.4 |
| 12 | UB-R | 3.3±0.33.3 \pm 0.3 | 3.1±0.23.1 \pm 0.2 |
| 13 | UB-T | 9.0±0.39.0 \pm 0.3 | 2.9±0.22.9 \pm 0.2 |
| 14 | AC-D | 6.2±0.26.2 \pm 0.2 | 3.3±0.33.3 \pm 0.3 |
| 15 | AC-T | 3.7±0.43.7 \pm 0.4 | 2.0±0.12.0 \pm 0.1 |
Key: UB, OK, SA, AA and AC (Institutions), R (Reservoir), D (Distribution pipeline), T (Tap); heterotrophic plate count (HPC), total coliform count (TCC).
The concentrations of lead (Pb)(\mathrm{Pb}) were recorded for AAR (0.02mg/l)(0.02 \mathrm{mg} / \mathrm{l}) and OK−R(0.03mg/l)\mathrm{OK}-\mathrm{R}(0.03 \mathrm{mg} / \mathrm{l}) and exceeded the recommended limit of 0.01mg/l0.01 \mathrm{mg} / \mathrm{l} (Table 2). Excess lead has been linked to cause cancer, kidney and liver malfunction, low blood haemoglobin and high blood pressure. It can cross the placenta barrier to affect the unborn by damaging the baby nervous system and brain (Bakker et al., 2014). The presence of metals
such as zinc, iron and lead in water environment are important parameters for bacterial growth and proliferation. Magnesium (Mg), calcium (Ca), and bicarbonate (HCO3)\left(\mathrm{HCO}_{3}\right) were significantly below the acceptable standards and principal hardness causing ions in water, resulting in insoluble precipitate and pipe corrosion. The salts of sodium, potassium and calcium constitute chlorides in water and impart adverse taste effect and deteriorate plumbing materials (WHO, 2011).
Table 3. Phenotypic characterization of isolates obtained from biofilm water samples
| MorphologicalZ examination | BiochemicalZ examination | ||||||
|---|---|---|---|---|---|---|---|
| Colonial Characteristics on nutrient agar (SIA) | Colonial Characteristics on MacConkey agar (MA) | Gram Staining |  |
Isolates | |||
| Large gray colony with serrated margin | Colmurless colony with serrated margin | negative rods | ++ | - | ++ | ++ | - |
| Opaque colony with serrated margin | Pinkish colony with serrated margin | negative rods | ++ | - | - | ++ | - |
| Dry colony with serrated margin | Pinkish colony with serrated margin | positive rods | ++ | ++ | - | ++ | ++ |
| Greenish pigmented colony with an entire margin | Colmurless colony with an entire margin | negative rods | ++ | ++ | - | ++ | - |
| Mucoid swarming colony with an entire margin | Colmurless colony with an entire margin | negative rods | ++ | - | - | ++ | - |
| Mucoid colony with an entire margin | Pinkish colony with an entire margin | negative rods | ++ | - | - | - | - |
| Mucoid colony with an entire margin | Colmurless colony with entire margin | positive rods | ++ | ++ | - | ++ | ++ |
| Mucoid swarming colony -with an entire margin | Colmurless colony with an entire margin | negative rods | ++ | - | - | ++ | - |
On the determination of degree of significance, the concentrations of electrical conductivity (EC - 0.047), total dissolved solids (TDS - 0.024), bicarbonate (HCO3−0.042)\left(\mathrm{HCO}_{3}-0.042\right) and chloride (CL−0.016)(\mathrm{CL}-0.016) were lesser than 0.05 and significantly different (P<0.05)(P<0.05). Contrarily, the other parameters like pH , turbidity, all the metals and nonmetals such as calcium, magnesium, iron and lead were greater than 0.05 and therefore were not significantly different (P>0.05)(P>0.05). However, only potassium (K=0.003)(\mathrm{K}=0.003) was very highly significantly different (P<0.005)(P<0.005) (Table 2).
The mean total heterotrophic bacterial counts (HBC) was reported to range between 3.3±0.3×10²cfu/mL3.3 \pm 0.3 \times 10^{2} \mathrm{cfu} / \mathrm{mL} and 9.3±0.3×10²cfu/ml9.3 \pm 0.3 \times 10^{2} \mathrm{cfu} / \mathrm{ml}. The lowest count, 3.3±0.33.3 \pm 0.3 ×10²cfu/ml\times 10^{2} \mathrm{cfu} / \mathrm{ml} was recorded for (UB-R) and the highest count, 9.3±0.3×10²cfu/mL9.3 \pm 0.3 \times 10^{2} \mathrm{cfu} / \mathrm{mL} was recorded for AA-R. The lowest bacterial counts recorded in UB-R ( 3.3±3.3 \pm 0.3×10²cfu/ml0.3 \times 10^{2} \mathrm{cfu} / \mathrm{ml} ) was as a result of effective treatment process and the reservoir-type of material that was made up of iron/steel that partially has no capacity to retain accumulating bacteria.
In addition, the complete absence of observable levels of turbidity and total suspended solids, lower levels of total organic carbon (13.8), total dissolved solids (10.2) and dissolved organic carbon (0.03) contributed
little or no sedimentation to support the growth of bacteria (Table 2).
Comparatively, the highest bacterial count ( 9.3±0.39.3 \pm 0.3 ×10²cfu/ml\times 10^{2} \mathrm{cfu} / \mathrm{ml} ) recorded in AA-R, was attributed to the non-functioning treatment management process and the cemented construction material (Table 2) that could serve as source of bicarbonate into distribution system due to over-use, shearing and age of construction. In addition, increased turbidity (20.1), total suspended solids (28.3), total dissolved solids (34.8) and total organic carbon (54.3) have also contributed to the bacterial growth. Subsequently, some metals and salts such as, phosphorus (4.16), chloride (27.7), ammonium (0.43), nitrite ( 0.170 ), iron (0.30)(0.30) and lead (0.02)(0.02) were also significantly higher in AA-R than in UB-R.
The results from AA-R can be attributed to the reservoir (storage tank) that was located in premises that harboured personnel, community members (the natives) directly collecting water for domestic use and the High-Powered Industrial Generator that emits unwanted chemicals and gases. The bacterial isolates phenotypically identified were Citrobacter, Klebsiella, Bacillus, Pseudomonas, Proteus and Providencia (Table 3). The highest frequency (percentage) was recorded for Bacillus and
Pseudomonas (23.8%) and Providencia, the least (4.80%) (Table 4). The investigated biofilms proved to be extremely active bacteria consortia with high concentrations of cultivable bacteria: heterotrophs and opportunistic bacteria.
Table 4. Percentage (distribution) of the bacterial isolates
| Organisms | Frequency | Percentage (%) |
|---|---|---|
| Klebsiella sp. | 4 | 19.0 |
| Citrobacter sp. | 3 | 14.3 |
| Pseudomonas sp. | 5 | 23.8 |
| Proteus sp. | 3 | 14.3 |
| Providencia sp. | 1 | 4.78 |
| Bacillus sp. | 5 | 23.8 |
| Total | 21 | 100 |
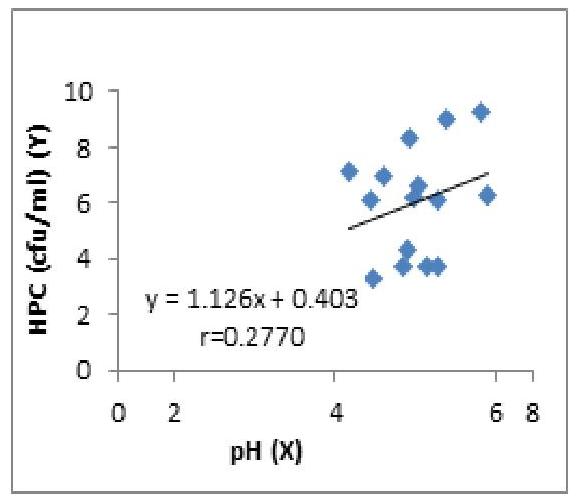
Fig. 1: The Regression of HPC (cfu/ml) on pH
The concentration of HPC increases with pH but the regression is not significant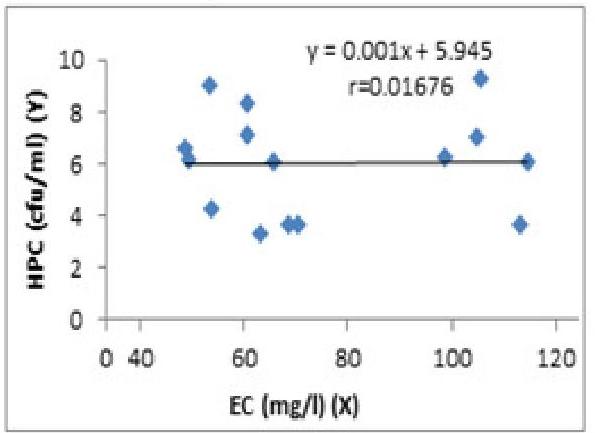
Fig. 2. The Regression of HPC (cfu/ml) on EC.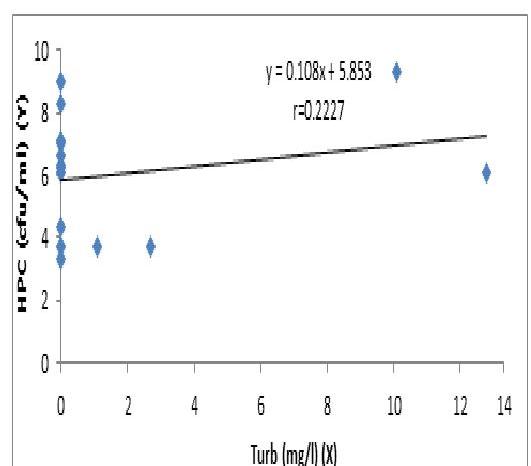
Fig. 3. The Regression of HPC (cfu/ml) on Turbidity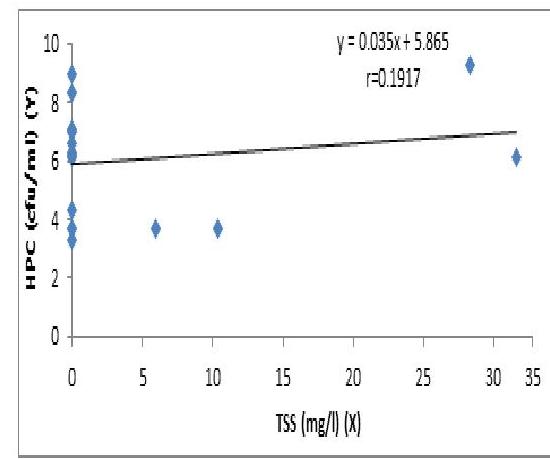
Fig 4. The Regression of HPC (CFU/ml) on TSS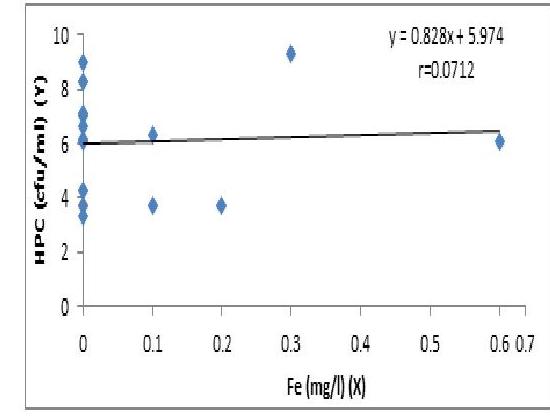
Fig. 5. The Regression of HPC (cfu/ml) on Fe.
Table 5.1. Concentration of HPC on pH
| ANOVA | Df | SS | MS | F | Significance F |
|---|---|---|---|---|---|
| Regression | 1 | 4.136222 | 4.136222 | 1.080 | 0.31761 |
| Residual | 13 | 49.78111 | 3.829316 | ||
| Total | 14 | 53.91733 |
No significant regression (P>0.05)(P>0.05)
The concentration of HPC increases with pH but the regression is not significant
Table 5.2. Concentration of HPC on EC
| ANOVA | df | SS | MS | F | Significance F |
|---|---|---|---|---|---|
| Regression | 1 | 0.015139 | 0.015139 | 0.004 | 0.024736 |
| Residual | 13 | 53.90219 | 4.146323 | ||
| Total | 14 | 53.91733 |
Significant regression ( P<0.05\mathrm{P}<0.05 )
The concentration of HPC has a linear relationship with EC but the regression is significant
Table 5.3. Concentration of HPC on Turbidity
| ANOVA | df\boldsymbol{d f} | SS\boldsymbol{S S} | MS\boldsymbol{M S} | F\boldsymbol{F} | Significance F\boldsymbol{F} |
|---|---|---|---|---|---|
| Regression | 1 | 2.67318 | 2.67318 | 0.678 | 0.425074 |
| Residual | 13 | 51.24415 | 3.941858 | ||
| Total | 14 | 53.91733 |
No significant regression (P>0.05)(P>0.05)
The concentration of HPC increases with Turbidity but the regression is not significant
Table 5.4. Concentration of HPC on TSS
| ANOVA | dfd f | SSS S | MSM S | FF | Significance FF |
|---|---|---|---|---|---|
| Regression | 1 | 0.054059 | 0.054059 | 0.013 | 0.910805 |
| Residual | 13 | 53.86327 | 4.143329 | ||
| Total | 14 | 53.91733 |
No significant regression (P>0.05)(\mathrm{P}>0.05)
The concentration of HPC has a linear relationship with TSS but the regression is not significant
Table 5.5. Concentration of HPC on Fe
| ANOVA | dfd f | SSS S | MSM S | FF | Significance FF |
|---|---|---|---|---|---|
| Regression | 1 | 0.272971 | 0.272971 | 0.066151 | 0.801052 |
| Residual | 13 | 53.64436 | 4.126489 | ||
| Total | 14 | 53.91733 |
No significant regression (P>0.05)(\mathrm{P}>0.05)
The concentration of HPC increases with Fe but the regression is not significant
The Pseeudomonas and Klebsiella species are responsible for nosocomial infections in susceptible patients and difficult to eradicate due to high intrinsic resistance to a variety of antibiotics, including β\beta lactams, aminoglycosides and fluroquinolones and produce many putative virulence factors (Bakker et al., 2014). The Citrobacter, Proteus and Providencia (coliforms) were relatively low in samples investigated which are used to measure the quality of drinking water, though not generally referred to as pathogenic organisms. However, there were no faecal coliforms such as Esherichia coli, Streptococcus faecalis and Clostridium perfringes detected in biofilm from the water samples, which thus complied with the standard ( 0cfu/100 mL0 \mathrm{cfu} / 100 \mathrm{~mL} ) (Onifade and Ilori, 2008; Joanne et al., 2011).
Conclusion: Findings from this study revealed that, the drinking water distribution system has become contaminated due to increased levels of turbidity, total suspended and dissolved solids, nitrite, bicarbonate, iron and lead which have contributed to the enhanced sources of nutrition to the growth of pathogenic organisms like Pseudomonas and Bacillus. This indicated that, the maximum permissible limits were at a level of pollution and may cause deleterious public heath challenges to the consumers.
Acknowledgement: I express my profound gratitude to the College of Natural and Applied Science,
Igbinedion University, Okada, Nigeria for funding this research work.
REFERENCES
Ackah, M; Anim, AK; Gyamfi, ET; Acquah, J. (2012). Assessment of the quality of sachet water consumed in urban township of Ghana using physicochemical indicators: A preliminary study. Adv. in Appl. Sc. Res.3: 2120 - 2127.
American Public Health Association (2005). Standard Methods for Examination of Water and Wastewater. Washington D.C. Pp311.
Bakker, DP; Postmus, BR; Busscher, HJ; Vander, HC. (2014). Bacterial strains isolated from different nitches can exhibit different patterns of adhesion to substrata. Environ. Microbiol. 70: 758 - 760.
Barrow, GI; Feltham, CE. (2003). Manual for the Identification of Medical Bacteria. (3 3rd 3^{\text {rd }} Edition). Cowen and Steel, UK. Pp 60.
Geldreich, EE. (1999). A Handbook of Community Water Samples. McGraw-Hill. N.Y. Pp 49.
Joanne, MW; Linda, MS; Christopher, JW. (2011). Methods of Microbial Ecology and Environmental Microorganisms of Significance. The McGraw Hill Inc. N. Y. Pp 360.
Onifade, AK; Ilori, PM. (2008). Microbiological analysis of sachet water vended in Ondo State, Nigeria. Environ. Res. J. 2: 107 - 110.
Razafitsiferana,T; Bruno, RM; Rabesiaka; MA. (2017). Analysis of physico-chemical parameters and quality control of water. Res. and Environ. 7(5) 124−130124-130.
Rethlefsen, Ml. (2013). Addressing the challenges of providing access to clean drinking water. Biotech. Bioeng. 2: 23-30.
Tiwari, AK; Singh, AK. (2014). Hydrochemical investigation and ground-water quality assessment of Pratatgarh District, Uttar Pradesh. J. Geol. Soc. India. 83(3) 329 - 343.
WHO (2008). Guidelines for drinking-water quality ( 4th 4^{\text {th }} ed.) World Health Organization ( 3rd 3^{\text {rd }} edition). Geneva. Pp 136.