Classification of Malicious Code Variants using Deep Learning (original) (raw)

International Journal for Research in Applied Science & Engineering Technology (IJRASET)
ISSN: 2321-9653; IC Value: 45.98; SJ Impact Factor: 7.429
Volume 8 Issue XI Nov 2020- Available at www.ijraset.com
Classification of Malicious Code Variants using Deep Learning
Souparnika Dinesh 1{ }^{1}, Kavitha N2\mathrm{N}^{2}
1,2{ }^{1,2} Department of Computer Science and Engineering, College of Engineering Trivandrum
Abstract
Malware attacks are increasing exponentially with usage of the internet. The first step towards safeguarding from malware attacks is by distinguishing malware files from benign ones and classifying them to known classes. Classification of malware is helpful for the analyst as it helps them to get a better insight into the functioning of the malware. This paper proposes a classification system for the malware variants into there families using Convolutional Neural Network along with Spatial Pyramid Pooling layer. This system involves the visualization of malware binary file and uses the texture based similarity in the images of same families for classification. Convolutional Neural Network along with Spatial Pyramid Pooling layer allows to use multi scale images which improved the classification accuracy.
Keywords: Malware Variants, Classification, Grayscale image, Convolutional Neural Network, Spatial Pyramid Pooling, Deep learning.
I. INTRODUCTION
Malicious code is a general term that can be used to denote the variety of malware. The malware variants include Virus, Trojan, Worms, Rootkit and so on. The malware are any malicious software or files that will enter into a user’s com- puter or network without their authorization and will steal the important information from the user’s computer without their knowledge. It also causes harm to the computer or network of the user and will cause financial loss too. The number of malware programs are increasing in a huge rate which leads to increase the challenge to the security community too. A study by MS-ISAC shows that the malware activity of top 10 malware is increased by 61%61 \% from December 2018 to January 2019 [1]. Such a large increase in the malware activity increased the threat to the information security also. Even if there are many detection methods available, which all have some limitations. So, it is very essential to find new efficient methods for the malicious code variants detection. For malware detection, first of all it must be analyzed by collecting the malicious code related information. By analyzing the performance of the program at different levels and aspects, it will give the information needed for the malicious behaviour of the program. For the information collection, it mainly consider the operations like API call monitoring, code auditing, virtual execution of the code and so on. From the information collected, it will extract the program features that shows the malicious behaviour and it is used as the basis for detecting a program as a malware. After malware detection, it is also important to understand the type of that malicious file. For that, it is required to classify the malware into known families. For each malware type, there are different families which have some unique features. The malware families will have some typical form of behavioural or static patterns which uniquely identify each family. So, by understanding the unique behavioural or static feature, it is possible to classify unknown malware samples to known malware families. In recent years, many methods have been proposed for the classification of malicious codes using the most recent and efficient techniques like Machine learning, deep learning, data mining, graph theory etc.
The remainder of this paper is organized as follows. Section II reviews related works. A description about the different types of malware and malware analysis techniques is provided in Section III and Section IV respectively. Section V details the proposed approach. Experimental evaluations of the proposed approach is given in Section VI. Finally, Section VII concludes the paper.
II. RELATED WORKS
Several methods have been proposed by researchers for the malware detection. This section present the researches related to malware including malware detection based on feature analysis, Malware visualization and malware detection based on Deep Learning. All the methods has its own merits and some limitations too.
A. Malware detection based on Feature Analysis
As we discussed above, there are mainly two categories of feature analysis techniques: static and dynamic. In static, the code is analysed and extract static features like opcode sequence, signature etc. [11] proposes an ensemble learning based approach along with the advantages of static analysis for andriod malware detection. The features are selected from API calls and command sets. Features are extracted from both Dalvik executable files and Manifest files. They used Random forest, Naive Bayes and simple logistic algorithm for ensemble learning.
International Journal for Research in Applied Science & Engineering Technology (IJRASET)
ISSN: 2321-9653; IC Value: 45.98; SJ Impact Factor: 7.429
Volume 8 Issue XI Nov 2020- Available at www.ijraset.com
In dynamic analysis, the behaviour is analysed by exe- cutting the code and extract dynamic features. Graph based malware clustering based on dynamic feature API calls is proposed[6], which used family dependency graph to show the association between different malware families. Here the API calls is denoted as each nodes of the graph. If there is any relationship between two API calls, then an edge is provided between two nodes. The relationship means that, if two subsequent API calls have same type and value arguments or if two share same substring. For each malware sample, the API calls are traced and API call dependency graph is constructed. Then it will be compared against the family graphs in database. If the two API call dependency graph belongs to one family, then they are combined to form a family dependency graph. Incorporating the idea of graph for malware clustering provides a good result but with some overhead.
B. Malware Visualization
We all know that one picture says 1000 words. So visu- alization gives us more information. Malware codes can be visualised as color or grey scale images and features can be extracted to detect a malware. [3] proposes a malware analysis method using visualization of malware binary files. Figure 2 shows the visualization of the malware binary file as grey scale images by taking the binary as a 8 bit vector and converting it into grey scale images. Then based on the texture analysis, the images feature vectors are formed. They used K-Nearest Neighbour(KNN) for the classification of the malwares.
[4] also proposes the visualization of malware by con- sidering the static feature. The binary file is converted into assembly code by using disassembler. Then the sequence of opcode is formed as individual blocks. Then block of opcode sequence is used to create the image matrices by serving it into two hash functions, simhash and djb2, which produces the X,Y\mathrm{X}, \mathrm{Y} cordinate value and R,G,B\mathrm{R}, \mathrm{G}, \mathrm{B} value respectively. They used selective area matching to calculate the similarities between image matrices to classify the them. It would be better when considered more information from the binary file for visualization.
The reference [5] also uses the visualisation of malware code for the classification. Instead of static analysis, they extracted the sequence of API calls using dynamic analysis. Then used the color mapping rules to create the feature im- ages representing the malware behavior. The color mapping rules means that they counted the number of occurrences of each API category in a unit time, then different categories are mapped to different colors. Then they use the Convolutional Neural Networks(CNN) for the classification of malware. They suggest that the accuracy can be improved with better dynamic execution.
Another malware classification by visualizing the binary samples into RGB image is proposed[9]. From the RGB col- ored image the global features are extracted. They used Grey- level co-occurrence matrix to describe the global features and color moments to describe the color features. By using this features they performed malware classification using the classification algorithms like random forest, K-Nearest Neighbour and SVM. [10] proposed a machine learning based malware analysis system which accurately detect not only known malware, but unknown malware also. The features are extracted from the grey scale images of malware binary, opcode-ngram and import functions. Then the detection module classify the malware using features extracted above. The detection module utilized a Shared Nearest Neighbor(SNN) clustering algorithm.
Malware visualization as color images and classification using ResNet-50 is proposed [13]. In this paper, they pro- posed a new scheme for the formation of image. Here color images are used instead of grey scale images, which is proposed earlier. They have taken the binary files and converted into strings of ones and zeros. Then they divided the strings to 8 -bit units. For every 8 -bit units, the lower and upper nibbles are considered as indices of 2-dimensional color map that stores the RGB value corresponding to that unit. This process is repeated for all the 8 -bit units from the binary file to get a sequence of RGB pixel values. Then all these values are considered as a 2-dimensional matrix, which results in a color image representation of a binary file. Here, they fixed the width of the matrix as 384 bytes or units and the height will depend on the size of the binary file. They used ResNet-50 for the classification of malware into their classes.
C. Malware Detection based on Deep Learning
Deep learning method is used for the classification of malware[7]. The malware binary file is converted into as- sembly language using disassembler. Then the opcode words are concatenated and given as input to word2vec. Word2vec is a a two layer neural network which takes text corpus as input and output is a set of feature vectors. Gradient Boosting machine is used for the classification of the malware samples. Most of the conventional signature and token based sys- tems for malware detection do not detect a majority of new malware variants. [2] proposes a new method of sig- nature generation and classification using deep learning. The method uses a Deep Belief Network(DBN) for the malware signature generation, where DBN is implemented by stacking of denoising auto encoders. The signature generated by DBN is used for the accurate classification of the new malware variants using either completely supervised or unsupervised framework.

International Journal for Research in Applied Science & Engineering Technology (IJRASET)
ISSN: 2321-9653; IC Value: 45.98; SJ Impact Factor: 7.429
Volume 8 Issue XI Nov 2020- Available at www.ijraset.com
Android has been most popular mobile OS since 2012. There are countless malware are hidden in number of Android applications which is a serious security threat to mobiles with Android OS. Since we are going through malware detection, Android malware is also an area which has to be taken into account. [8] proposes a Android malware classification method using deep learning techniques. They have done a hybrid analysis for feature extraction. Then the extracted static and dynamic features are used to classify and detect the Android malware using a Deep Neural Network.
[12] proposes the classification of malware using visual- ization technique along with deep learning. They used the same technique which in used in [3] for the visualization of the malware as grey scale images. Malimg dataset consists of 9339 grey scale images of 25 different malware families are used. Convolutional Neural Network is used for the classification of malware. Since the dataset is imbalanced, they used data augmentation technique to make them almost balanced. Then they also proposed a Dynamic Resampling Bat Algorithm to address the problem of weight combination. The experiments are conducted in three different stages. Since CNN can accept only images of fixed size, they designed different network structure for each of the image size, which limited there model. In final stage, they compared the obtained results with the previous works and found better performance by the proposed model.
III. MALWARE TYPES
The malware is a generalized term for a variety of malicious codes. The classification of malicious code is a difficult process. The malware can be classified into different categories based on its mode of propagation and the actions they performed on infected machine using the malicious code. In each category there are number of families too. The malicious codes of each family have its own common characteristics. The common types of malware are listed below.
- Virus: Virus is a type of computer program that will infect other programs in the system by injection its malicious code. Viruses are not independent; they need a host to propagate its effect. It will cause failure of system, corrupt data, wasting resources etc.
- Worms: Computer worms are standalone malware pro- grams, which doesn’t request a host to spread its effect. It consumes the bandwidth of the computer network to spread itself by exploiting the vulnerabilities in target systems. This also causes to steal the information from the computer, system failure etc.
- Trojan Horse: A Trojan is a type of malicious code that looks as legitimate but its purpose is to take control over the computer. It is sometimes called as Trojan virus, but the fact is that it can’t execute and replicate themselves as a virus do. A user has to execute the Trojan.
- Spyware: As like its name denotes, it’s a malicious software that “spies” on your computer. Spyware can be installed when you install another program that has a spyware installer attached to it or by other means also. Then the spyware can capture information like passwords, usernames, browsing habits etc. from the infected computer.
- Adware: Adware also as like its name suggests, it will show unwanted advertisements to the user, sometimes in the form of a pop-up or sometimes in an “unclosable window”. This piece of code is generally set into free downloaded software.
- Botnet: Botnet is a network which comprises of a number of malicious code injected hosts called Bots, controlled by a controller. These Botnets can be used to perform Distributed Denial of Attacks, steal data, send spam and allow the attacker to access the device and its connections.
IV. ANALYSIS TECHNIQUES
Malicious code analysis must be done for an effective malware detection and classification. The aim of the analysis techniques is to identify whether a piece of code is malicious or not, by going through the purpose and functionality of that code. There are mainly three types of malware analysis which are described in below section. The aim of all these analyses is same, but the difference lays in the tools, skills and time required for all these techniques. The Figure 1 illustrate the three important types of analysis techniques.
International Journal for Research in Applied Science & Engineering Technology (IJRASET)
ISSN: 2321-9653; IC Value: 45.98; SJ Impact Factor: 7.429
Volume 8 Issue XI Nov 2020- Available at www.ijraset.com
A. Static Analysis Techniques
The static analysis techniques also called as code analysis, doesn’t involve the execution of any malicious code and extracting the dynamic features. It involves examining the code and extracting the static features like opcode sequence, signature etc. The static detection method will provide a safer and faster testing environment. But the problem with static detection techniques is that, it will be easily affected by the obfuscation techniques. With static analysis, the executable file is disassembled using any of the disassembler tools, then the opcode can be extracted and used as a feature for statically analyse the malicious code.
B. Dynamic Analysis Techniques
The Dynamic analysis technique also called as behavioural analysis, involves the execution of the malicious code and extracts the behavior of the program. Based on the behaviour, it is identified that whether a code is malicious or not. In order to extract the dynamic features of the code, it must be executed in a controlled environment and must satisfy all the needs of the executing program. The dynamic method can accurately identify the malicious behaviour and it also unaffected by obfuscation techniques. This accurately analyse the known as well as unknown malware variants.
C. Hybrid Analysis Techniques
Hybrid Analysis technique is the combination of both static and dynamic analysis techniques which overcomes the limitations of both. It firstly analyses the static feature of any malicious code and then combines it with the other behavioural parameters.
V. PROPOSED SYSTEM
There are several steps are involved in the classification purpose. Here a malware visualization approach is used other than a static or dynamic analysis. After image formation, the classification is done using Convolutional Neural Network along with Spatial Pyramid Pooling layer. We all know that it is not only important to distinguish between whether a file is benign or malware, yet also to understand what kind of malicious file it is. Here the malware is classified into families/classes. By knowing such classes, it will be helpful for the analyst to get a better insight into the functioning of the malware. The main steps involved are image formation, training and testing. An overall design of the approach is given in Fig.2.
Fig. 2. Proposed System
A. Image Formation
In Figure 3 shows the steps involved in visualisation of the malware binary file as grey scale image [3]. The executable file of the malware is taken and which is taken as a 8 bit vector. Then that 8 -bit vector values are converted into decimal number of ranges 0 to 255 , where 0 denotes black, 255 denotes white and values between 0 and 255 denotes the shades of grey. These values are treated as 2D matrix to form grey scale image, where the height will varying and width will be fixed based on the file size. So for each malware binary file from different families, the grey scale image is formed. The specifications for image width is provided in the Table I [2].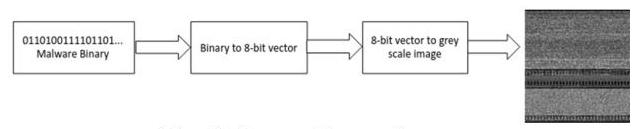
Fig. 3. Image Formation
International Journal for Research in Applied Science & Engineering Technology (IJRASET)
ISSN: 2321-9653; IC Value: 45.98; SJ Impact Factor: 7.429
Volume 8 Issue XI Nov 2020- Available at www.ijraset.com
B. Convolutional Neural Network
Convolutional Neural Network(CNN or ConvNet) is a type of neural network mainly used for image classification and recognition. The architecture of a CNN was inspired from the organisation of the visual cortex and is similar to that of the connectivity pattern of Neuron in the human brain. The general architecture of a CNN mainly consists of 3 layers: convolutional layer, pooling layer and fully connected layer.
| File size | Image width |
|---|---|
| <10kB<10 \mathrm{kB} | 32 |
| 10kB−30kB10 \mathrm{kB}-30 \mathrm{kB} | 64 |
| 30kB−60kB30 \mathrm{kB}-60 \mathrm{kB} | 128 |
| 60kB−100kB60 \mathrm{kB}-100 \mathrm{kB} | 256 |
| 100kB−200kB100 \mathrm{kB}-200 \mathrm{kB} | 384 |
| 200kB−500kB200 \mathrm{kB}-500 \mathrm{kB} | 512 |
| 500kB−1000kB500 \mathrm{kB}-1000 \mathrm{kB} | 768 |
| >1000kB>1000 \mathrm{kB} | 1024 |
| Table i |
Image width for various file sizes
- Convolutional Layer: Convolutional layers are the ma-jor building blocks of CNN, which extract features from an input image. A CNN can contain one or more than one convolutional layers. Input layer of a CNN is the convolutional layer, where it performs convolution operation in the input. Filters/kernels are applied over the input which results in an activation. A feature map is obtained as a result of repeated application of the filters over the input. The convolution operation is a mathematical operation that takes 2 values, such as image matrix and a filter, then produces a feature map as output. By using different filters, we perform multiple convolution on the input which results in distinct feature maps. The number of feature maps produced from a convolutional layer will depend on the number of filters used in that layer. So the output of convolutional layer are set of feature map.
- Pooling Layer: The output from convolutional layer is received by the pooling layer. Pooling layer performs the dimensionality reduction of each feature maps, which enables to reduce the number of parameters, shortens the training time and combats over fitting. Pooling can be of different types:
a) Max pooling
b) Average pooling
c) Sum pooling
In Max pooling, the maximum value of each filter of the feature map is taken. In Average pooling, calculates the average of values in each filter. Sum of all elements of each filter of the feature map is taken in sum pooling.
The pooling layer will produces down sampled or pooled feature map, which is the summarised version of the features detected from the input.
3) Fully Connected Layer: The Fully Connected layer takes the output of the previous layer,that is, from the last pooling layer. The main purpose of this layer is classification. The first layer in fully connected layer will flattens the feature map received into a single dimensional vector. Then the vector is passed to the fully connected layers and it applies weights to predict the correct labels. The number of layers and neurons can be decided based on the problem to be solved. The fully connected output layer will gives the final probabilities for each label. The number of neurons in the output layer will be equal to the number of labels we have.
International Journal for Research in Applied Science & Engineering Technology (IJRASET)
ISSN: 2321-9653; IC Value: 45.98; SJ Impact Factor: 7.429
Volume 8 Issue XI Nov 2020- Available at www.ijraset.com
C. Spatial Pyramid Pooling Layer
The convolutional layer can accept multi scale images which will lead into generation of feature maps of different size. This is to given as input for a fully connected layer.
But a fully connected layer cannot accept variable sized vectors, it requires fixed sized vectors. That limits several deep networks to take input of fixed size. This constrain can be overcame by replacing last pooling layer with a Spatial pyramid pooling layer which will take feature maps of any size and generate a fixed sized vector [14].
Fig. 4. Spatial Pyramid Pooling Layer
Generally, to make deep networks adapt to input images of any sizes, the spatial pyramid pooling uses multi-level spatial bins to substitute max-pooling layers or average- pooling layers, which has been shown to be robust. Here used a 3-level pooling with filters of size 1,2 and 4 . Then the outputs are taken using max pooling. The outputs from this 3 filters are concatenated together to form a vector of size 21 , which will be fed to the fully connected layer.
D. Classification
Malware that shares common characteristics are grouped as a family and antivirus vendors are naming each such families. So here malware images are classified into corre- sponding families based on the features extracted by CNN. CNN with SPP layer will allows training and classification of multi scale images. So malware images of any size can be classified using SPP-CNN with sufficient accuracy.
VI. EXPERIMENTAL EVALUATION
In this section, present the evaluation to show the per- formance of the proposed method. The experiments is done using the malware dataset from the Vision Research Lab[3]. The keras library in python is used to build and train the CNN. The experiments are ran on Google Co-lab with GPU activated.
A. Dataset and Experimental Settings
The dataset used consists of 9339 samples of grey scale images in 25 malware families[3]. The dataset is highly imbalanced, which will cause problem like overfitting. So, to make the image dataset a balanced one, we can use augmentation technique. Image augmentation helps to create training images artificially through different operations like random rotation, shifts, flips etc. Here, ImageDataGenerator API in keras is used to create augmented images and stored in a folder [15]. The methods applied along with its value is provided in Table II [12].
Table II
Settings For Image Augmentation [12]
| Methods | Settings |
|---|---|
| rotation_range | 0.1 |
| width_shift | 0.1 |
| height_shift | 0.1 |
| rescale | 1/2551 / 255 |
| shear_range | 0.1 |
| zoom_range | 0.1 |
| horizontal_flip | true |
| fill_mode | nearest |
The CNN network here used consists of 6 convolutional layers, 5 pooling layers and 2 dense layers. Out of 5 pooling layer, one is spatial pyramid pooling layer which has 3 levels of pooling. From 9339 number of samples, 7481 is used for training and 1858 for testing purpose. Training is done in 10 epoch with sgd as optimizer with learning rate 0.01 , where images of size 224,192 and 96 is taken for training. For evaluation metrics, we used the accuracy, precision and recall. These can be defined as follows:
Precision = TP TP +FP1P Recall =1P TP +FNTP+TN Accuracy =TP+TNTP+TN+FP+FN\begin{aligned} \text { Precision } & =\frac{\text { TP }}{\frac{\text { TP }+F P}{1 P}} \\ \text { Recall } & =\frac{1 P}{\frac{\text { TP }+F N}{T P}+T N} \\ \text { Accuracy } & =\frac{TP+T N}{T P+T N+F P+F N} \end{aligned}
where True Positive (TP) and False Positive (FP) are the number of file samples correctly and wrongly classified as malicious, respectively. Similarly, True Negative (TN) and False Negative (FN) are the number of file samples correctly and wrongly classified as benign, respectively.
B. Experimental Results
In this section, the performance of the system is evaluated by training and testing using images of different sizes. In previous work[12], they considered images of size 24∗24,48∗48,96∗9624 * 24,48 * 48,96 * 96 and 192∗192192 * 192. Here selected image sizes 96∗9696 * 96 and 192∗192192 * 192 as like the previous work and excluded sizes 24∗2424 * 24 and 48∗4848 * 48 due to bad results. Apart from these sizes, performance using images with size 224∗224224 * 224 is also evaluated.
The advantage of using SPP-CNN is understood by con- ducted an analysis of the results obtained while training and testing of the network with different sizes of malware images. The accuracy of the network trained with image of size 224∗224224 * 224 and testing with different sizes is shown in the Table III.
Table III
Test Accuracy
| Image size | Test Accuracy |
|---|---|
| 224 | 96.2 |
| 220 | 95.6 |
| 200 | 95.12 |
| 192 | 94.14 |
| 190 | 89.4 |
From the Table III we can understand that the testing accuracy is decreasing with decrease in image size. So, if we train the network with any of the smaller image size then we can notice an increase in test accuracy. Here trained the network with size 192*192 to see the variation in accuracy, then we got a test accuracy of 96.8%96.8 \% which is better than previous one. Table IV shows the accuracy of the network trained with 192*192 size and tested using different image size. Here also we can notice the same trend as above. Then by training the same network with size 96∗9696 * 96 leads to improve the test accuracy from 30.8 to 95.8 .
Table IV
| Test Accuracy | |
|---|---|
| Image size | Test Accuracy |
| 192 | 96.8 |
| 190 | 95.2 |
| 170 | 94.2 |
| 96 | 48.7 |
| 92 | 30.8 |
The Fig 5 shows the graphical representation for both the tables above, where blue color line indicates the accuracy of network trained with image of size 224∗224224 * 224 and green color line shows accuracy of the network trained with image of size 192*192. This all shows the effectiveness of using SPP-CNN in malware classification problem.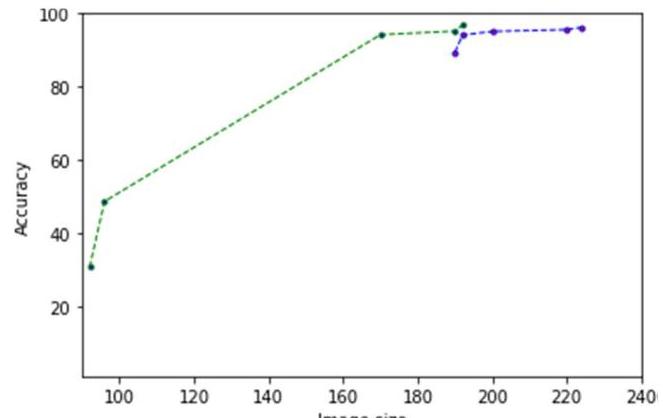
Fig. 5. Graph showing test accuracy results of different image sizes
VII. CONCLUSIONS AND FUTURE WORK
This paper proposed a classification system for the mal- ware variants into there families using Convolutional Neural Network along with Spatial Pyramid Pooling layer. This system involves the visualization of malware binary file which will helps to overcome the preprocessing time required in both static and dynamic analysis techniques. In the pre- vious scheme, the requirement of CNN framework to have fixed size input image limited their model. This model used Convolutional Neural Network along with Spatial Pyramid Pooling layer, which allows multi scale images and improved the classification accuracy. As a future work, it will be better to go for new representation of malware files by including more features, which would result in good classification rate.
REFERENCES
[1] https://www.cisecurity.org/blog/top-10-malware-january-2019/.
[2] Omid E. David and Nathan S Netanyahu, “DeepSign: Deep Learning for Automatic Malware Signature Generation and Classification ,” In Neural Networks (IJCNN), 2015 International Joint Conference on, pages 1-8. IEEE, 2015.
[3] L. Nataraj, S. Karthikeyan, G. Jacob, and B. Manjunath. “Malware images: visualization and automatic classification.” In Proceedings of the 8th international symposium on visualization for cyber security, page 4. ACM, 2011.
[4] K. Han, J. H. Lim, and E. G. Im. “Malware analysis method using visualization of binary files”, In Proceedings of the 2013 Research in Adaptive and Convergent Systems, pages 317-321. ACM, 2013.
[5] Mingdong Tang and Quan Qian, “Dynamic API call Sequence Visual- ization for Malware classification,” IET Information Security, Volume- 13, pages 367 377, 2019 .
[6] BINLIN CHENG, QIANG TONG, JIANHONG WANG, AND WEN- HUI TIAN, “Malware Clustering Using Family Dependency Graph,” IEEE Access, Vol. 7, pp. 72267 - 72272, March 2019.
[7] Bugra Cakir and Erdogan Dogdu ,“Malware Classification Using Deep Learning Methods,” ACMSE '18 Proceedings of the ACMSE 2018 Conference, March 2018.
[8] Zhenlong Yuan, Yongqiang Lu, and Yibo Xue ,“Droiddetector: android malware characterization and detection using deep learning,” Tsinghua Science and Technology, Vol. 21, pp. 114 - 123, Feb. 2016.
[9] JIANWEN FU, JINGFENG XUE, YONG WANG , ZHENYAN LIU, AND CHUN SHAN ,“Malware Visualization for Fine-Grained Clas- sification,” IEEE Access, vol. 6, pp. 14510 - 14523, Feb. 2018.
[10] Liu Liu, Bao-sheng Wang, Bo Yu, and Qiu-xi Zhong,“Automatic malware classification and new malware detection using machine learning,” Frontiers of Information Technology Electronic Engineer- ing, Vol. 18, Issue 9, pp 1336-1347, September 2017.
[11] Suleiman Y. Yerima, Sakir Sezer, and Igor Muttik, “High Accuracy Android Malware Detection Using Ensemble Learning,” IET Informa- tion Security, vol. 9, pp. 313 - 320, October 2015.
[12] Zhihua Cui, Fei Xue, Xingjuan Cai, Yang Cao, Gai-ge Wang and Jinjun Chen, “Detection of Malicious Code Variants Based on Deep Learning,” IEEE TRANSACTIONS ON INDUSTRIAL INFORMAT-ICS,2018.
[13] Ajay Singh, Anand Handa, Nitesh Kumar, and Sandeep Kumar Shukla, "Malware Classification Using Image Representation,"International Symposium on Cyber Security Cryptography and Machine Learning, pp. 75-92, 2019.
[14] Kaiming He, Xiangyu Zhang, Shaoqing Ren, and Jian Sun, “Spatial Pyramid Pooling in Deep Convolutional Networks for Visual Recogni- tion”, IEEE Transactions on Pattern Analysis and Machine Intelligence (TPAMI) 2015.
[15] https://keras.io/api/preprocessing/image/

(ab)
crossref
10.22214/13RASET
INDEX
COPERNICUS
45.98
IMPACT FACTOR:
7.129
©
TOGETHER WE REACH THE GOAL
IMPACT FACTOR:
7.429
INTERNATIONAL JOURNAL FOR RESEARCH
IN APPLIED SCIENCE & ENGINEERING TECHNOLOGY
Call: 08813907089 © (24*7 Support on Whatsapp)