Modeling runoff with satellite-based rainfall estimates in the Niger basin (original) (raw)
Received: 31 May 2017
Accepted: 31 July 2017
First Published: 04 August 2017
*Corresponding author: Ganiyu Titilope Oyerinde, Faculty of Agriculture, Department of Soil Science, University of Abuja, Abuja, Nigeria
E-mail: ganiyuoyerinde@yahoo.com
Reviewing editor:
Manuel Tejada Moral, University of
Seville, Spain
Additional information is available at the end of the article
SOIL & CROP SCIENCES | RESEARCH ARTICLE Modeling runoff with satellite-based rainfall estimates in the Niger basin
Ganiyu Titilope Oyerinde 1∗{ }^{1 *}, Ibukunoluwa O. Fademi 2{ }^{2} and Olubunmi A. Denton 2{ }^{2}
Abstract
Effective runoff modeling in the Niger basin has been hampered by inadequate and deteriorating amount of reliable observation stations. Satellite-based rainfall products have increasingly been considered an important component in addressing these data gaps. We compared the Global Precipitation Climatology Project (GPCP) one degree daily estimate and interim reanalysis data of the European Centre for Medium-Range Weather Forecasts (ECMWF) named ERA-Interim rainfall estimates with observed rainfall. The suitability of the two rainfall products for runoff modeling was also assessed. Rainfall data were averaged over a well gauged catchment (Sota) and compared. They were subsequently used to calibrate a hydrological model and their modeling efficiencies were evaluated. The better of the two datasets was subsequently used in regional simulation on 10 Niger basin catchments. GPCP rainfall estimates had good fit to observed rainfall with Nash values of 0.93, 0.94 and 0.84 for monthly, seasonal and daily climatological comparisons. River discharge simulated with the GPCP showed closer correlation with observed than the ERA-Interim. GPCP appropriately simulate river discharge in all 10 evaluated Niger basin catchments. Based on our findings, we proposed the integration of GPCP rainfall estimates in runoff modeling, especially in data scarce river basins.
Subjects: Environmental Sciences; Agriculture and Food; Soil Sciences; Hydrology; Environmental Impact Assessment; River Management
Keywords: Niger basin; hydrology; water resources; precipitation; runoff
ABOUT THE AUTHORS
Ganiyu Titilope Oyerinde is a lecturer at the Department of Soil Science, University of Abuja, Nigeria. He is a Hydro-climatologist with key research interest in water resources, climate change, hydrology and soil physics.
Mr Ibukunoluwa O. Fademi is a scientist at the Institute of Agricultural Research and Training (IAR&T), Ibadan, Nigeria. His research focus is in Soil physics, Agrology, Agronomy and climate change.
Mrs Olubunmi A. Denton is a Soil Survey/Land Evaluation expert and also a scientist at the IAR&T, Ibadan, Nigeria. She is interested in sustainable land use management and planning, Geographical information systems, and Digital Soil mapping.
PUBLIC INTEREST STATEMENT
The Niger River basin is the largest basin in West Africa. Water resources on the basin have been under concurrent influence of climate change with adverse visible effects of drought and floods on different sections of the basin. Inadequate observed meteorological and hydrological data on the basin have made it difficult for water resources mangers to make adequate planning and management of extreme hydrological events. This study evaluates the potential of using rainfall products derived from remote sensing to simulate river discharge at both regional and local perspectives. Results indicate the suitability of datasets for water resources modeling and their integration in hydrological studies in the Niger basin was recommended.
1. Introduction
The Niger River Basin, home to over 100 million people, is a vital and complex asset for West Africa which has highly variable water resources. In the past 50 years, a 10 to 30%30 \% decrease in mean annual rainfall in the basin has led to a reduction of 20 to 60%60 \% in river discharge (Oyebande & Odunuga, 2010). Even with no change in precipitation, the availability of per capita renewable water resources in the basin is declining as a result of a large population growth; the population in the basin is expected to double from 94 million in 2005 to over 150 million by the year 2050, and competing demands have led to challenges in water allocation among different users and countries (Ogilvie et al., 2010). The recently identified “Sahelian paradox” which is an observed runoff increase in some of the basin’s Sahelian catchments such as in Nakanbe (Burkina Faso), Sirba (Niger) and Mekrou (Benin) despite a decrease in rainfall (Descroix et al., 2009) is also an important challenge for modeling water availability in the basin. Amogu et al. (2010) attributed the sahelian paradox to soil crusting and land degradation as a result of unsustainable land use in the basin. A sustainable management strategy is therefore needed to cope with challenges arising from increases in water demand and changes in the variability of supply in the basin.
Effective evaluation of water resources requires availability of high quality hydro-meteorological data which are inadequate in the Niger basin and 70%70 \% of available rainguage have deteriorated between 1985-2004 (Lebel & Ali, 2009). With the advent and progress of remote data collection and development of complex earth system models, satellite rainfall estimates is becoming readily available for end-users offsetting the limitations posed by data scarcity. A number of algorithms and mathematical approaches have been developed to model rainfall process with varying complexity in representations of the natural process, theoretical concepts and assumptions, temporal and spatial scale, computational efficiency, data requirement, etc. Their application ranges from simple daily rainfall estimation/forecast to simulation of complex hydrological processes that supplement decision (Dessu & Melesse, 2013).
Several authors have investigated the potential of these datasets from the global to regional scales. Wada, Wisser, and Bierkens (2013) found a non substantial deviation between ERA-Interim and MERRA global simulated irrigation water requirements and the FAO AQUASTAT database. Ricko, Carton, and Birkett (2011) reported the superiority of the Global Precipitation Climatology Project (GPCP) over ERA-Interim reanalysis and TRMM in the estimation of water level for 12 tropical lakes and reservoirs. Also, other authors such as (Dessu & Melesse, 2013; Negrón Juárez, Li, Fu, Fernandes, & de Oliveira Cardoso, 2009; Romilly & Gebremichael, 2011) reported good potentials for the utilization of satellite rainfall estimates in several parts of Africa. However, the potential of these rainfall products in effective catchment runoff simulation is still a great research challenge in the region. In west Africa, Gosset and Viarre (2013) reported good correlation between satellite modeled rainfall and observed but witnessed large bias in simulated outflow due to weak capacity of the Gr4j hydrological model utilized in the study. In view of this, this study aim at evaluating two prominent rainfall estimates in the Niger River basin. The objectives are to evaluate the accuracies of GPCP and ERAInterim rainfall estimates and conduct local and regional scale evaluation of the hydrological modeling potentials of the two rainfall datasets in the Niger basin.
2. Materials and methods
2.1. Study area
The Niger River Basin covers 2.27 million km2\mathrm{km}^{2} (Ogilvie et al., 2010) and with 4,200 km4,200 \mathrm{~km} in length the Niger is the third longest river in Africa. The basin consists of ten countries which are Algeria, Benin, Burkina Faso, Cameroon, Chad, Coted’Ivoire, Guinea, Mali, Niger and Nigeria with a source located close to the Fouta Djallon Mountains in the South of Guinea (Oguntunde & Abiodun, 2013). Precipitation ranges from 250 to 1,000 mm/1,000 \mathrm{~mm} / year from the sahelian/desert zone to over 2,000 mm/2,000 \mathrm{~mm} / year close to the river mouth in the Guinean/coaster zone (Oguntunde & Abiodun, 2013). The river flows Northeast through the Upper Niger basin and enters the Inner Delta in Mali. During the rainy season, the delta forms a large flood plain of 20,000−30,000 km220,000-30,000 \mathrm{~km}^{2}, facilitating the cultivation of rice,
cotton and wheat as well as cattle herding and fishing (KfW, 2010). The size of the flooded area is subject to strong annual variations, depending on the discharge of the Upper basin. A large part of the water is lost in the delta due to evaporation and seepage. Its main tributary, the Benue River, flows from highlands of Cameroon and joins the Niger at Lokoja, Nigeria, before reaching the Atlantic Ocean at the Gulf of Guinea (Oguntunde & Abiodun, 2013). Average annual river discharge in the Niger Basin, based on observations from 1980-2013, at the Lokoja station is about 5000 m3/s5000 \mathrm{~m}^{3} / \mathrm{s}.
2.2. Model description
The model used in the present study, is a lumped parameter, conceptual rainfall-runoff model, based on unit hydrograph (Jakeman, Littlewood, & Whitehead, 1990) which was implemented on the R package Hydromad (Andrews, Croke, & Jakeman, 2011). The model consists of two modules, a non-linear IHACRES loss module, where losses of water occur, to convert rainfall to effective rainfall. Generally the best configuration of, IHACRES model in semi-arid regions or for ephemeral streams is a one store loss module with a linear routing model (Ye, Bates, Viney, & Sivapalan, 1997). Here, we replaced the linear routing module with the auto-regressive, moving average, with exogenous inputs (ARMAX) model (Andrews et al., 2011; Dutta, Welsh, Vaze, Kim, & Nicholls, 2011) to route the effective rainfall to streamflow. This model structure was identified as the most appropriate for use in this study region (Oyerinde et al., 2017, 2016). The loss module is defined by just five parameters(Table 1), which together predict daily effective rainfall (Jakeman & Hornberger, 1993) while the ARMAX routing module has an additional four parameters (Dutta et al., 2011). The loss module involves calculation of an index of catchment storage sks_{k}, at each time step kk (daily in this paper) based upon an exponentially decreasing weighting of precipitation and evapotranspiration (or temperature) conditions (Jakeman & Hornberger, 1993; Ye et al., 1997). The effective rainfall uku_{k} was computed from incidence precipitation rkr_{k}, the storage index sks_{k}, moisture threshold ( ll ) and power on soil moisture (p)(p) (Equation (1)).
uk=(sk−l)prku_{k}=\left(s_{k}-l\right)^{p} r_{k}
ifs k>luk=0_{k}>l u_{k}=0
During a model calibration, four of the nine model parameters are determined directly from the raw rainfall, streamflow and temperature data, while the remaining are calibrated using a trial and error search procedure, optimising the model fit to the observed daily streamflow record. The equations underlying the loss module are to be found in (Jakeman & Hornberger, 1993; Ye et al., 1997) while the ARMAX routing module are well described in (Dutta et al., 2011). In this study, the optimum model parameters were obtained by an automatic calibration with the “fitByOptim” algorithm on R which selects the optimum parameters that gives the best preferred model performance statistics (here taken as Nash Coefficient) (Andrews et al., 2011).
2.3. Data
The model requires daily precipitation, evapotranspiration and river discharge. GPCP ( 1∘×1∘1^{\circ} \times 1^{\circ} ) and ERA-Interim ( 0.5∘×0.5∘0.5^{\circ} \times 0.5^{\circ} ) daily precipitation were evaluated in the Niger basin (Figure 1). GPCP dataset is based on a combination of satellite and gauge measurements with daily temporal resolution
Table 1. Efficiency coefficients for model calibration in the Niger basin
| Symbol | Full name and range | Reference |
|---|---|---|
| Nash | Nash-Sutcliffe efficiency (→≤(\rightarrow \leq Nash ≤1)\leq 1) | Nash and Sutcliffe (1970) |
| d | Index of agreement (0≤d≤1)(0 \leq d \leq 1) | Legates and McCabe (1999) |
| md | Modified index of agreement | Krause, Boyle, and Bäse (2005) |
| rr | Pearson correlation coefficient (−1≤r≤1)(-1 \leq r \leq 1) | |
| R2R^{2} | Coefficient of determination (0≤R2≤1)\left(0 \leq R^{2} \leq 1\right) | Krause et al. (2005) |
| KGE | Kling-Gupta efficiency (0≤(0 \leq KGE ≤1)\leq 1) | Kling, Fuchs, and Paulin (2012) |
Figure 1. Distribution of selected catchments on the Niger basin.
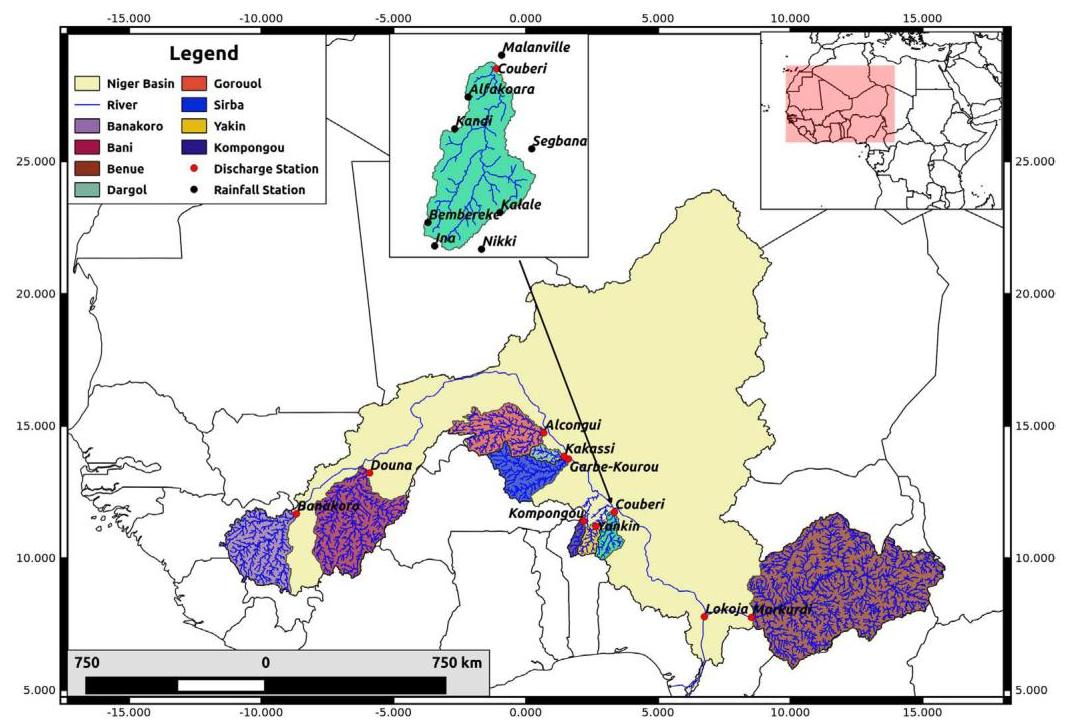
(Huffman et al., 2001) while ERA-Interim is a precipitation re-analysis. The selection of the products was motivated first by their availability over the region of interest and the fact that they are commonly used in hydrological research studies (Gosset & Viarre, 2013; Jobard, Chopin, Berges, & Roca, 2011; Negrón Juárez et al., 2009; Oyerinde et al., 2017, 2016). Evaluated catchments were selected based on discharge data acquired from the Niger basin authority. Catchment boundary of the Niger basin was obtained from Hydrosheds. Boundaries of selected sub-catchments were delineated with a preconditioned DEM from Hydrosheds using the Hortonian drainage networks analysis (Jasiewicz & Metz, 2011). Basin satellite rainfall and temperature series were calculated as the weighted average of all grid boxes by latitudes. This was done to follow the patterns of rainfall and temperature distribution in West Africa which is as a result of the back and forth movement of the Inter Tropical Convergence Zone (ITCZ) in the region (Lucio et al., 2012). The movement of the ITCZ follows the position of maximum surface heating associated with meridional displacement of the overhead position of the sun, lower latitudes experience higher rainfall and lower temperature, whereas higher latitudes experience lower rainfall and higher temperatures. For extraction of rainfall, higher latitudes were given lower weights than the lower latitudes while the reverse was applied for temperature.
We computed catchment evapotranspiration from MERRA 2 meter daily air temperature on each catchment with the Hamon model (Oudin et al., 2005). This evapotranspiration model was selected based on the recent findings that very simple evapotranspiration models relying on mean daily temperature are as efficient as more complex models such as the Penman model and its variants (Oudin et al., 2005).
2.4. Local evaluation
The two satellite modeled rainfall estimates were compared with rain gauge data in the Sota catchment (Figure 1) using six efficiency criteria described in Table 1. They were also used to force the hydrological model and their six efficiency criteria were compared with that of the observed hydrological simulation. Good discharge data were available for a 7 years period from 2004 to 2010 in the catchment. Consequently, automatic calibration was done on the catchment with regard to the optimization of the Nash efficiency from 2004 to 2007 and the simulations were validated from 2008
to 2010. Fitness of observed and simulated discharge was evaluated with the six efficiency coefficients (Table 1) during calibration and validation.
2.5. Regional evaluation
Due to dearth of rain-gauge observations, regional Niger basin simulation in the 10 catchments was done with the better of the two evaluated rainfall estimates in the pre-evaluation phase described above. The hydrological model was calibrated with observed discharge for selected periods based on data availability. Good discharge data were available for a 7 years period from 2004 to 2010 in most of the catchments except at Bani and Dargol where good 7 years discharge data were available from 1997 to 2003. Automatic calibration was done on each catchment with regard to the optimization of the Nash efficiency. Due to lack of quality 7 years data for model validation in three of the catchments, model was validated in all the simulation period from 1997 to 2010. Fitness of observed and simulated discharge was evaluated with the six efficiency coefficients (Table 1) during calibration and validation.
3. Results
3.1. Local
Table 2 provides a comparison between the satellite products and the gauges. High Nash values of 0.93,0.960.93,0.96 and 0.76 were recorded in GPCP monthly, seasonal and daily climatological comparisons while ERA-Interim values were 0.73,0.780.73,0.78 and 0.58 . Other five efficiency criteria were also higher in GPCP than ERA-Interim. Optimum model calibration results presented in Table 2 revealed the superiority of rain gauge observations relative to the satellite estimates. Optimum NSE values of 0.7,0.670.7,0.67 and 0.45 were recorded for rain gauge observation, GPCP and ERA-Interim. Other efficiency criteria also followed similar pattern as the NSE. During model validation, greater NSE value of 0.82 was
Table 2. Efficiency coefficients of the two products compared to rain-gauge measurements
| Efficiency coefficients | GPCP | ERA-Interim |
|---|---|---|
| Monthly | ||
| NSE | 0.93 | 0.73 |
| dd | 0.98 | 0.91 |
| md | 0.9 | 0.79 |
| rr | 0.96 | 0.9 |
| R2R^{2} | 0.93 | 0.81 |
| KGE | 0.93 | 0.63 |
| Seasonal | ||
| NSE | 0.96 | 0.78 |
| dd | 0.99 | 0.93 |
| md | 0.91 | 0.8 |
| rr | 0.98 | 0.96 |
| R2R^{2} | 0.96 | 0.91 |
| KGE | 0.94 | 0.63 |
| Climatological daily | ||
| NSE | 0.76 | 0.58 |
| dd | 0.93 | 0.85 |
| md | 0.81 | 0.75 |
| rr | 0.87 | 0.8 |
| R2R^{2} | 0.76 | 0.64 |
| KGE | 0.84 | 0.56 |
Table 3: Hydrological modeling efficiency of the two precipitation datasets compared to raingauge measurements
| Efficiency coefficients | Observed | GPCP | ERA-Interim |
|---|---|---|---|
| Calibration | |||
| NSE | 0.7 | 0.67 | 0.45 |
| dd | 0.91 | 0.9 | 0.8 |
| mdm d | 0.75 | 0.75 | 0.71 |
| rr | 0.84 | 0.82 | 0.69 |
| R2R^{2} | 0.7 | 0.67 | 0.47 |
| KGE | 0.78 | 0.76 | 0.57 |
| Validation | |||
| NSE | 0.71 | 0.82 | 0.58 |
| dd | 0.92 | 0.95 | 0.87 |
| mdm d | 0.79 | 0.82 | 0.75 |
| rr | 0.85 | 0.91 | 0.77 |
| R2R^{2} | 0.73 | 0.83 | 0.59 |
| KGE | 0.85 | 0.88 | 0.73 |
recorded in the GPCP followed gauge data ( 0.71 ) and the least was ERA-Interim ( 0.58 ). Other efficiency criteria also followed similar pattern of the NSE (Table 3).
Hydrographs of the calibration and validation on the Sota catchment during pre-evaluation periods are presented in Figures 2 and 3. River discharge simulated with the rain gauge measurements was compared to observed river discharge and there was a good fit in the structure of the hydrographs. Precipitation and runoff simulated from gauged data were then compared with that of GPCP and ERA-Interim. ERA-Interim underestimated the precipitation amount during both calibration and validation and also has some outliers while GPCP smoothly replicated the observed rainfall pattern. The two precipitation products adequately captured the seasonality of flow on all evaluated catchments. However GPCP has a better fit to the observed especially in the validation period.
3.2. Regional
The distribution of optimum calibration coefficients of runoff simulated with GPCP precipitation estimates are presented in Table 4. Mean of 0.67,0.91,0.78,0.86,0.740.67,0.91,0.78,0.86,0.74 and 0.72 with corresponding standard deviations of 0.25,0.06,0.08,0.08,0.140.25,0.06,0.08,0.08,0.14 and 0.23 were recorded for Nash-Sutcliffe Efficiency (NSE), Index of Agreement (d), Modified Index of Agreement (md), Pearson Correlation coefficient ®, Coefficient of Determination ( R2R^{2} ) and Kling-Gupta Efficiency (KGE) respectively across the ten catchments. Hydrographs of the calibration periods presented in Figure 4 showcased that GPCP adequately captured the seasonality of flow on all evaluated catchments. GPCP also captured the peaks and low flow discharge periods in all catchments except Lokoja and Sirba. At Lokoja, the product underestimated the low flow periods throughout the calibration period while peak discharge was over estimated at the Sirba catchment.
Figure 2. Model calibration with rain-gauge measurements and two satellite rainfall estimates in the Sota catchment.
Note: Black, red and green bars represents observed rainfall, ERA-Interim and GPCP while blue, black, red and green lines are observed runoff, simulated runoff from observed rainfall, simulated runoff from ERAInterim and simulated runoff from GPCP respectively.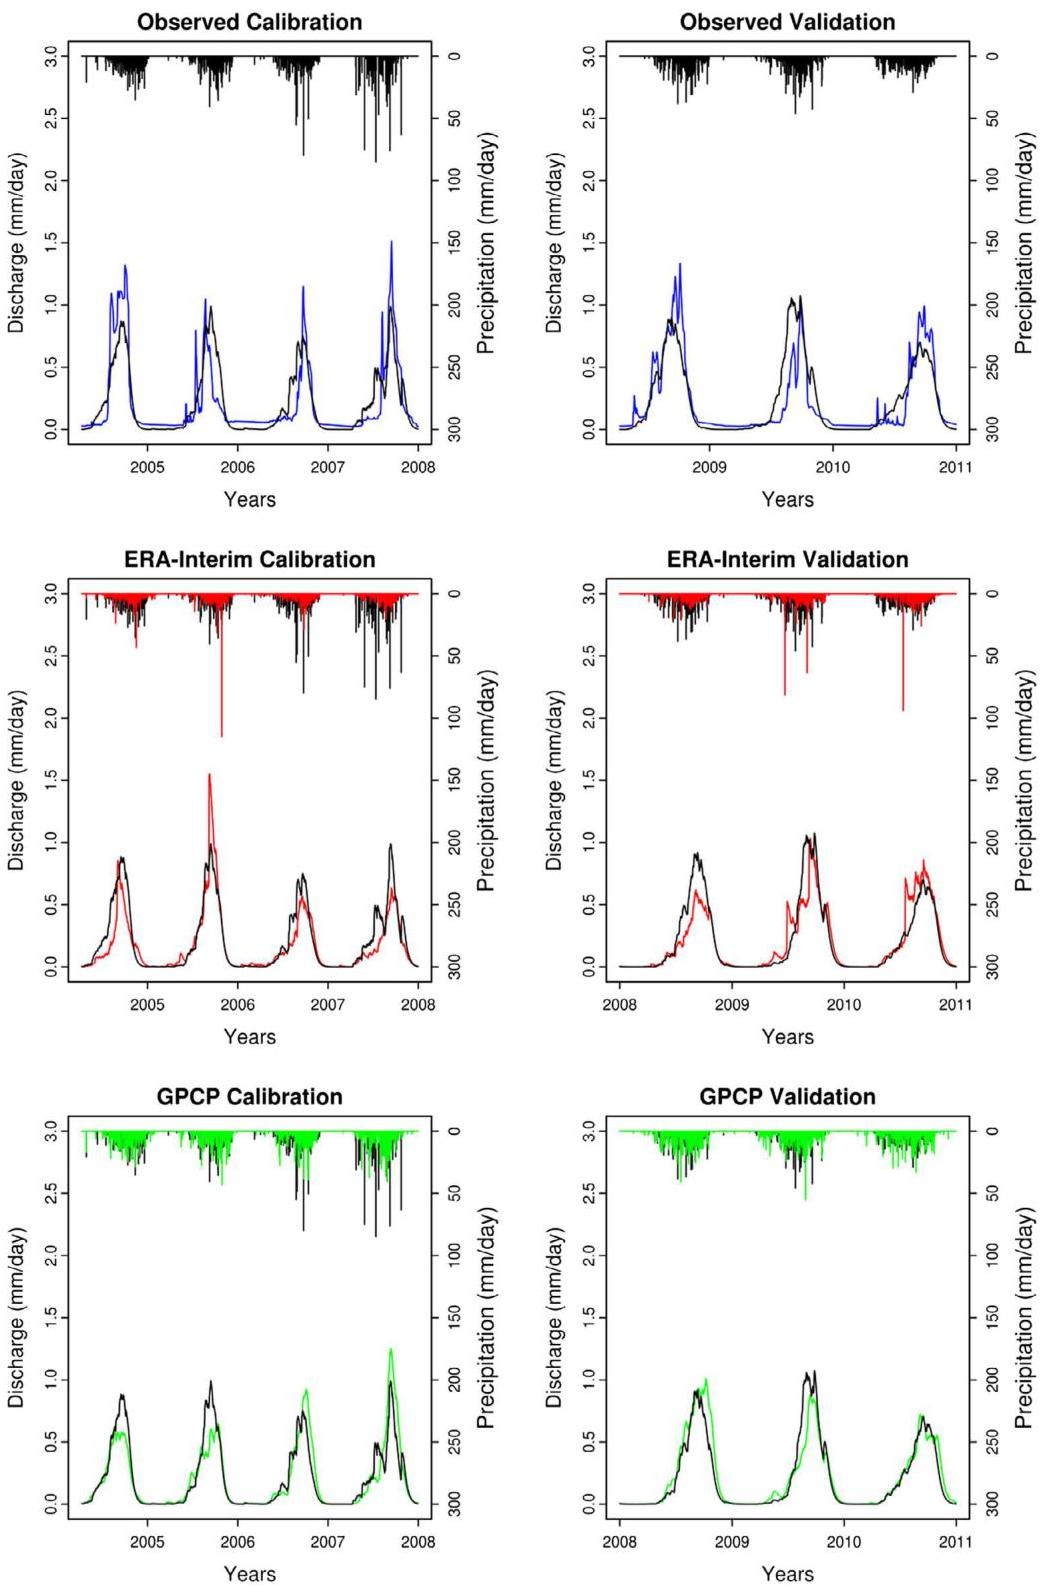
Figure 3. Model calibration with GPCP in the Niger basin.
Note: Green bars represents GPCP rainfall while blue and green lines are observed runoff and simulated runoff from GPCP respectively.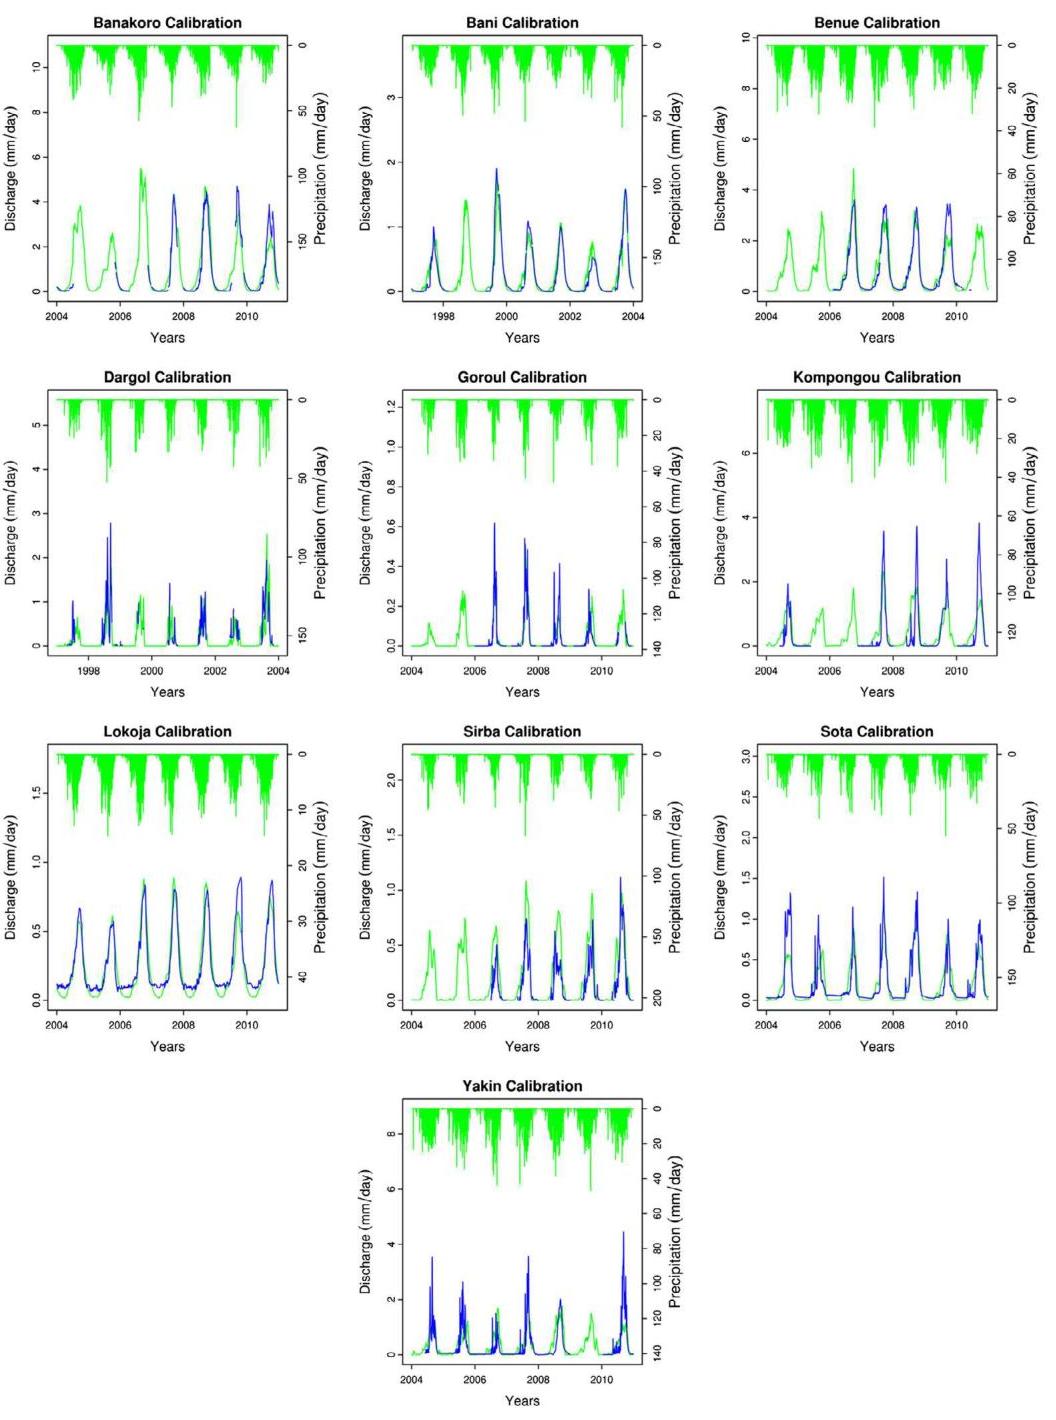
Figure 4. Validation of simulated discharge with GPCP in the Niger basin.
Note: Green bars represents GPCP rainfall while blue and green lines are observed runoff and simulated runoff from GPCP respectively.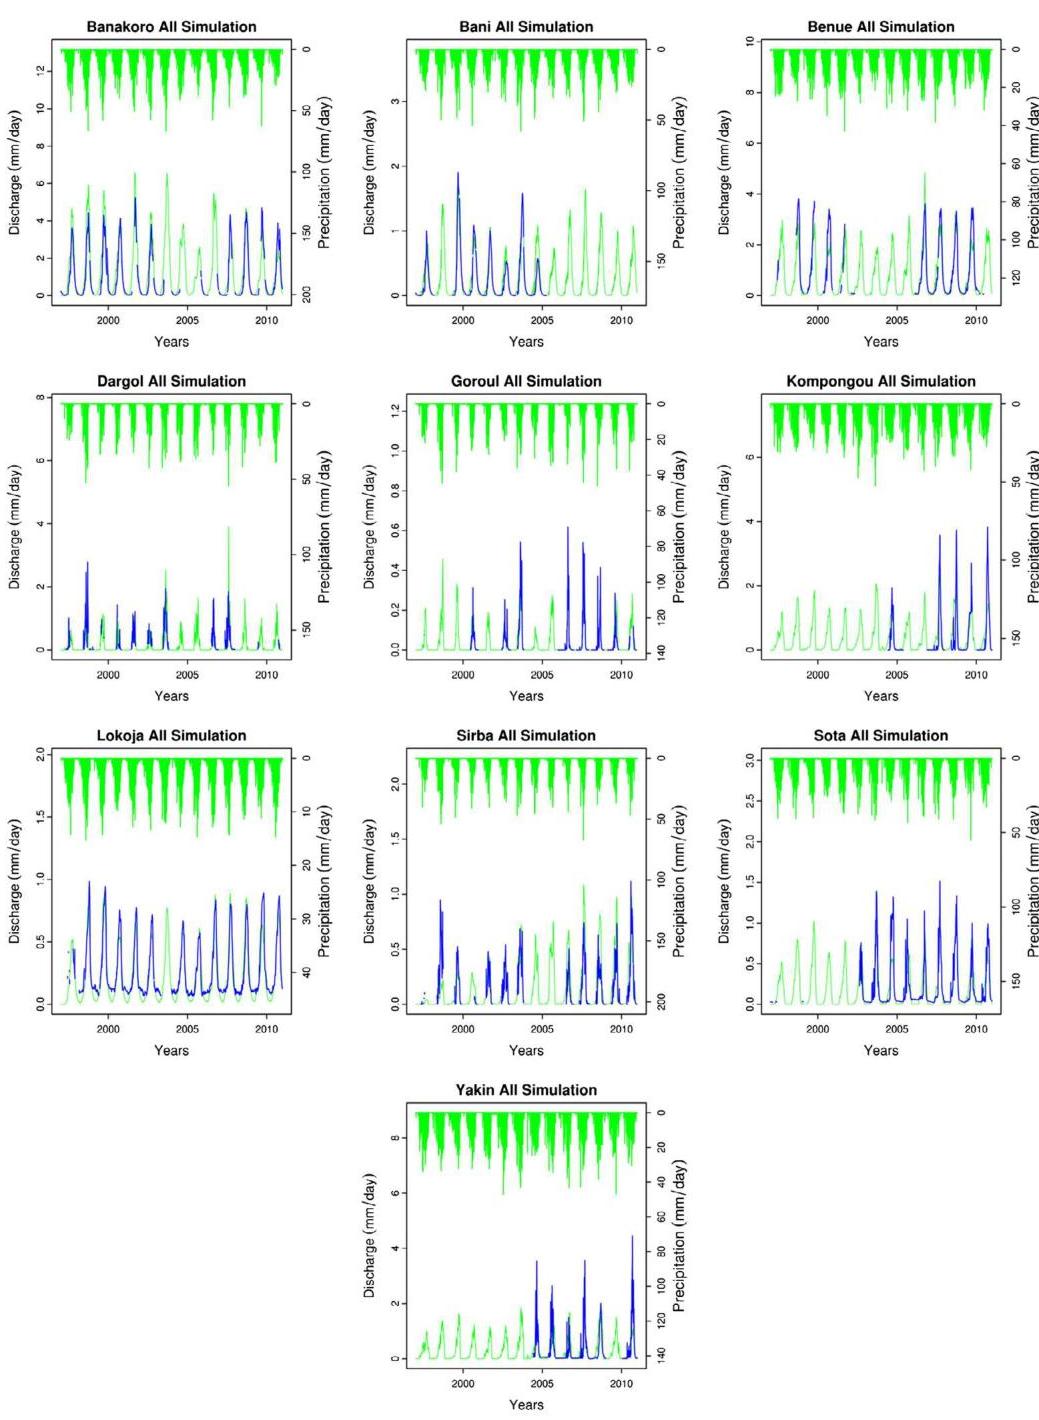
Table 4. Hydrological modeling efficiency of GPCP across the 10 catchments
| Efficiency coefficients | Calibration | All simulation | ||
|---|---|---|---|---|
| Mean | Std. dev. | Mean | Std. dev. | |
| NSE | 0.67 | 0.25 | 0.65 | 0.21 |
| dd | 0.91 | 0.06 | 0.90 | 0.06 |
| md | 0.78 | 0.08 | 0.77 | 0.06 |
| rr | 0.86 | 0.08 | 0.84 | 0.09 |
| R2R^{2} | 0.74 | 0.14 | 0.71 | 0.14 |
| KGE | 0.72 | 0.23 | 0.72 | 0.11 |
The distribution of optimum validation coefficients of discharge simulated with GPCP precipitation estimates are presented in Tables 3 and 4 . Mean of 0.65,0.90,0.77,0.84,0.710.65,0.90,0.77,0.84,0.71 and 0.72 with corresponding standard deviations of 0.21,0.06,0.06,0.09,0.140.21,0.06,0.06,0.09,0.14 and 0.11 were recorded for NSE, d,md,r,R2d, \mathrm{md}, r, R^{2} and KGE respectively. Hydrographs of model validation are presented in Figure 4. GPCP precipitation product was able to adequately predict the flow seasonality in non calibration periods even when there was little or no data as witnessed at Yakin (1993-2003), Bani (2004-2010), Dargol (2004-2010), Kompongou (1993-2003) and Sota (1993-2003). At Iokoja, GPCP underestimation continued in the model validation while over estimation of peak flows at Sirba was slightly decreased.
4. Discussion and conclusions
Close correlation between GPCP’s calibration and validation efficiency coefficients recorded during pre-evaluation indicates that GPCP precipitation estimates are adequate for hydrological simulation in the Niger basin. This is against the previous opinion that satellite modeled rainfall estimates can’t be used directly for forcing hydrological models in West Africa (Gosset & Viarre, 2013). However, observed weakness of the ERA-Interim shows superiority of satellite related precipitation observations over reanalysis. Similar observation was made by Ricko et al. (2011) where ERAInterim precipitation was attributed with weakening of the seasonal cycle at Lake Chad and also had a spurious interannual variability at Kainji Reservoir. Capability of the GPCP precipitation estimates in adequately simulating discharge in the validation periods (even when there was little or on data) gives some prospects for their applicability in poorly and ungauged basins such as Niger. These rainfall estimates could be used in filling missing precipitation gauge observations. In addition the methodology used in this study could be used in replacing missing hydrological data for detailed hydrological analysis. In ability of the model to adequately simulate river discharge in the Sirba and Lokoja might be due to the effects of land use and presence of large upstream dams which are not included in this simulation. The Sirba is one of the sahelian catchment where discharge is increasing despite a decrease in rainfall due to unsustainable land use change (Amogu et al., 2010; Descroix et al., 2009). Further research should aim at evaluating the ungauged basin applications of the GPCP rainfall estimate.
Acknowledgments
We thank the Niger Basin Authority, the Agence pour la Securite de la Navigation Aerienne en Afrique et a Madagascar (ASECNA) and the Benin Hydrological Service for providing the hydro-meteorological data. Prof Bernd Diekkrüger and Dr Fabien C.C. Hountandji are appreciated for reading and correcting the manuscript. We appreciate the R project (www.r-project.org) and the Hydromad group (www. hydromad.catchment.org) for creating enabling modelling environments. The Global Precipitation Climatology Project (GPCP), Modern Era Retrospective-analysis for Research and Applications (MERRA) and ECMWF are acknowledged for making available their rainfall and temperature datasets.
Funding
The authors received no direct funding for this research.
Author details
Ganiyu Titilope Oyerinde 1{ }^{1}
E-mail: ganiyuoyerinde@yahoo.com
Ibukunoluwa O. Fademi 2{ }^{2}
E-mail: fademiibukun@gmail.com
Olubunmi A. Denton 3{ }^{3}
E-mail: bunmidenton@gmail.com
ORCID ID: http://orcid.org/0000-0001-9820-1617
1{ }^{1} Faculty of Agriculture, Department of Soil Science, University of Abuja, Abuja, Nigeria.
2{ }^{2} Land and Water Ressources Management Program, Institute of Agricultural Research and Training, Obafemi Awolowo University, Moor Plantation, Ibadan, Nigeria.
Citation information
Cite this article as: Modeling runoff with satellite-based rainfall estimates in the Niger basin, Ganiyu Titilope Oyerinde, Ibukunoluwa O. Fademi & Olubunmi A. Denton, Cogent Food & Agriculture (2017), 3: 1363340.
References
Amogu, O., Descroix, L., Yéro, K. S., Le Breton, E., Mamadou, I., Ali, A., … Belleudy, P. (2010). Increasing river flows in the Sahel? Water, 2, 170-199. doi:10.3390/w2020170
Andrews, F. T., Croke, B. F. W., & Jakeman, A. J. (2011). An open software environment for hydrological model assessment and development. Environmental Modelling & Software, 26, 1171-1185. doi:10.1016/j.envsoft.2011.04.006
Descroix, L., Mahé, G., Lebel, T., Favreau, G., Galle, S., Gautier, E., … Cappelaere, B. (2009). Spatio-temporal variability of hydrological regimes around the boundaries between Sahelian and Sudanian areas of West Africa: A synthesis. Journal of Hydrology, 375, 90-102. doi:10.1016/j. jhydrol.2008.12.012
Dessu, S., & Melesse, A. (2013). Evaluation and comparison of satellite and GCM rainfall estimates for the Mara River Basin, Kenya/Tanzania. In T. Younos & C. A. Grady (Eds.), Climate change and water resources (Vol. 25, pp. 29-45). Springer Berlin Heidelberg. https://doi. org/10.1007/698_2013_219
https://doi.org/10.1007/978-3-642-37586-6
Dutta, D., Welsh, W., Vaze, J., Kim, S., & Nicholls, D. (2011). Improvement in short-term streamflow forecasting using an integrated modelling framework. 19th International Congress on Modelling and Simulation, Perth, Australia, 12-16 December.
Gosset, M., & Viarre, J. (2013). Evaluation of several rainfall products used for hydrological applications over West Africa using two high-resolution gauge networks. Quarterly Journal of the Royal Meteorological Society, 139, 923-940. doi:10.1002/qj. 2130
Huffman, G. J., Adler, R. F., Morrissey, M. M., Bolvin, D. T., Curtis, S., Joyce, R., … Susskind, J. (2001). Global precipitation at one-degree daily resolution from multisatellite observations. Journal of Hydrometeorology, 2, 36-50. doi:10.1175/1525-7541(2001)002<0036:GPAOOD>2.0.CO;2
Jakeman, A., & Hornberger, G. (1993). How much complexity is warranted in a rainfall-runoff model? Water Resources Research, 29, 2637-2649. https://doi. org/10.1029/93WR00877
Jakeman, A. J., Littlewood, I. G., & Whitehead, P. G. (1990). Computation of the instantaneous unit hydrograph and identifiable component flows with application to two small upland catchments. Journal of Hydrology, 117, 275-300. https://doi.org/10.1016/0022-1694(90)90097-H
Jasiewicz, J., & Metz, M. (2011). A new GRASS GIS toolkit for Hortonian analysis of drainage networks. Computers & Geosciences, 37, 1162-1173. doi:10.1016/j. cageo.2011.03.003
Jobard, I., Chopin, F., Berges, J. C., & Roca, R. (2011). An intercomparison of 10-day satellite precipitation products during West African monsoon. International Journal of Remote Sensing. doi:10.1080/01431161003698286
KfW. (2010). Adaptation to climate change in the upper and middle Niger River Basin. Retrieved February 12, 2017, from https://ccsl.iccip.net/niger\_river\_basin.pdf
Kling, H., Fuchs, M., & Paulin, M. (2012). Runoff conditions in the upper Danube basin under an ensemble of climate change scenarios. Journal of Hydrology, 424-425, 264277. https://doi.org/10.1016/j.jhydrol.2012.01.011
Krause, P., Boyle, D., & Bâse, F. (2005). Comparison of different efficiency criteria for hydrological model assessment. Advances in Geosciences, 5, 89-97. https://doi.org/10.5194/adgeo-5-89-2005
Lebel, T., & Ali, A. (2009). Recent trends in the Central and Western Sahel rainfall regime (1990-2007). Journal of Hydrology, 375, 52-64. doi:10.1016/j.jhydrol.2008.11.030
Legates, D. R., & McCabe, G. J. (1999). Evaluating the use of “goodness-of-fit” measures in hydrologic and hydroclimatic model validation. Water Resources Research, 35, 233-241. https://doi.org/10.1029/1998WR900018
Lucio, P., Molion, L., Valadão, C., Conde, F., Ramos, A., & Dias de Melo, M. (2012). Dynamical outlines of the rainfall variability and the ITCZ role over the West Sahel. Atmospheric and Climate Sciences, 2, 337-350. https://doi.org/10.4236/acs.2012.23030
Nash, J. E., & Sutcliffe, J. V. (1970). River flow forecasting through conceptual models part I - A discussion of principles. Journal of Hydrology. doi:10.1016/0022-1694(70)90255-6
Negrón Juárez, R. I., Li, W., Fu, R., Fernandes, K., & de Oliveira Cardoso, A. (2009). Comparison of precipitation datasets over the tropical South American and African Continents. Journal of Hydrometeorology, 10, 289-299. doi:10.1175/2008JHM1023.1
Ogilvie, A., Mahé, G., Ward, J., Serpantié, G., Lemoalle, J., Morand, P., … Clanet, J. C. (2010). Water, agriculture and poverty in the Niger River basin. Water International, 35, 594-622. https://doi.org/10.1080/02508060.2010.515545
Oguntunde, P. G., & Abiodun, B. J. (2013). The impact of climate change on the Niger River Basin hydroclimatology, West Africa. Climate Dynamics, 40, 81-94. doi:10.1007/ s00382-012-1498-6
Oudin, L., Henieu, F., Michel, C., Perrin, C., Andréossian, V., Anctil, F., & Loumagne, C. (2005). Which potential evapotranspiration input for a lumped rainfall-runoff model? Journal of Hydrology, 303, 290-306. doi:10.1016/j. jhydrol.2004.08.026
Oyerinde, G., Hountondji, F. C. C., Lawin, A. E., Odofin, A. J., Afouda, A., & Diekkrüger, B. (2017). Improving hydroclimatic projections with bias-correction in Sahelian Niger Basin, West Africa. Climate, 5(8), 1-18. doi:10.3390/ cll5010008
Oyerinde, G. T., Wisser, D., Hountondji, F. C. C., Odofin, A. J., Lawin, A. E., Afouda, A., & Diekkrüger, B. (2016). Quantifying uncertainties in modeling climate change impacts on hydropower production. Climate, 4(34), 1-15. doi:10.3390/cll4030034
Oyebande, L., & Odunuga, S. (2010). Climate change impact on water resources at the transboundary level in West Africa: The cases of the Senegal, Niger and Volta basins. Special Issue Analysis of Climate Change Impacts on Water Resources for Developing Economies Successes and Challenges, 4, 163-172.
Ricko, M., Carton, J. A., & Birkett, C. (2011). Climatic effects on Lake Basins. Part 1: Modeling tropical lake levels. Journal of Climate, 24, 2983-2999. doi:10.1175/2010JCLI3602.1
Romilly, T. G., & Gebremichael, M. (2011). Evaluation of satellite rainfall estimates over Ethiopian river basins. Hydrology and Earth System Sciences, 15, 1505-1514. https://doi.org/10.5194/hess-15-1505-2011
Wada, Y., Wisser, D., & Bierkens, M. F. P. (2013). Global modeling of withdrawal, allocation and consumptive use of surface water and groundwater resources. Earth System Dynamics Discussions, 4, 355-392. doi:10.5194/ esdd-4-355-2013
Ye, W., Bates, B. C., Viney, N. R., & Sivapalan, M. (1997). Performance of conceptual rainfall-runoff models in lowyielding ephemeral catchments. Water Resources Research, 33, 153-166. https://doi.org/10.1029/96WR02840
2017 The Author(s). This open access article is distributed under a Creative Commons Attribution (CC-BY) 4.0 license.
You are free to:
Share - copy and redistribute the material in any medium or format
Adapt - remix, transform, and build upon the material for any purpose, even commercially.
The licensor cannot revoke these freedoms as long as you follow the license terms.
Under the following terms:
Attribution - You must give appropriate credit, provide a link to the license, and indicate if changes were made. You may do so in any reasonable manner, but not in any way that suggests the licensor endorses you or your use. No additional restrictions
You may not apply legal terms or technological measures that legally restrict others from doing anything the license permits.
Cogent Food & Agriculture (ISSN: 2331-1932) is published by Cogent OA, part of Taylor & Francis Group.
Publishing with Cogent OA ensures:
- Immediate, universal access to your article on publication
- High visibility and discoverability via the Cogent OA website as well as Taylor & Francis Online
- Download and citation statistics for your article
- Rapid online publication
- Input from, and dialog with, expert editors and editorial boards
- Retention of full copyright of your article
- Guaranteed legacy preservation of your article
- Discounts and waivers for authors in developing regions