IgG production in hybridoma batch culture: kinetics of IgG mRNA, cytoplasmic-, secreted- and membrane-bound antibody levels (original) (raw)
Short Communication
IgG production in hybridoma batch culture: kinetics of IgG mRNA, cytoplasmic-, secretedand membrane-bound antibody levels
Michel Leno 1{ }^{1}, Otto-Wilhelm Merten 1{ }^{1}, Françoise Vuillier 2{ }^{2} and Jean Hache 3{ }^{3}
1{ }^{1} Technologie Cellulaire and 2{ }^{2} Immuno-Hématologie, Institut Pasteur, Paris, France and 3{ }^{3} Division Génie Chimique et Biochimique, Bertin et Cie, Plaisir, France
(Received 15 January 1991; revision accepted 10 April 1991)
Abstract
Summary During batch cultivation of the I.13.17. hybridoma cell line, there is a 15 to 20 -fold decrease in the levels of cytoplasmic and membrane-bound mAb , and a 7 to 10 -fold decrease in the cellular levels of kappa and gamma chain mRNAs, as the cells pass from the exponential into the decline phase of growth. The profile of the specific mAb production rate does not correlate with the kinetics of either the cytoplasmic mAb or the specific mRNAs throughout the culture. Flow cytometry analyses have revealed that dead cells, which account for 40 to 70%70 \% of total cells during the decline phase, might significantly interfere with the determination of cytoplasmic mAb levels of cell-lysates ELISA and with the calculation of the specific mAb production rate. Possible influences of these parameters on mAb synthesis and secretion during hybridoma batch culture are discussed.
IgG mRNA; Flow cytometry; Cytoplasmic-bound mAb; Total cell-associated mAb; Membrane-bound mAb; Hybridoma
Introduction
It has been demonstrated that a number of hybridoma and lymphoid cell lines synthesize immunoglobulins during a limited portion of their mitotic cycle (Buell
- Correspondence to: O.-W. Merten, Technologie Cellulaire, Institut Pasteur, 28 Rue du Docteur Roux, 75724 Paris cedex 15, France. ↩︎
and Fahey, 1969; Takahashi et al., 1969; Suzuki and Ollis, 1989; Al-Rubeai and Emery, 1990b) and that the specific antibody production rate varies throughout the different phases of a batch culture (Merten et al., 1985; Merten, 1988; Emery, 1986).
Although our understanding of immunoglobulin gene expression during Blymphocyte differentiation has been greatly extended by the elucidation of the primary structure of light and heavy chain genes (Tasuku et al., 1979; Rochaix et al., 1978), there is still much to be learned about the molecular mechanisms responsible for the regulation of mAb synthesis at various physiological stages of the hybridoma cells during the culture. Regulation of antibody synthesis may be affected at several levels including transcription of the genes, processing of the primary transcripts, mRNA stability and translation of mRNA on polysomes. Our previous results, based on in situ hybridization of hybridoma cells have indicated that the amount of kappa and gamma chain mRNAs varies significantly during the different phases of batch cultures (Merten et al., 1990b).
Similarly, although we know from the gene structure that there are two alternative coding units for the 3′3^{\prime} end of the heavy chain mRNA (Blattner and Tucker, 1984), little is known about the mechanisms by which a cell, at a given physiological stage, makes predominantly membrane immunoglobulin or, alternatively, predominantly secreted immunoglobulin. Otherwise, unresolved questions remain as to whether membrane immunoglobulin is released into the growth medium or stays anchored to the cell surface throughout the culture; or if a considerable or only transient cytoplasmic IgG pool exists.
Unfortunately, it is difficult to quantify properly the time course of cytoplasmic and membrane bound antibody by ELISA analysis of cell-lysate extracts, because it is difficult to differentiate between viable and dead cells. A useful alternative strategy, therefore, has been to use flow cytometry (FC) procedures.
In the present report, we focus on these problems by examining the accumulation of light and heavy chain mRNAs; secreted-, cytoplasmic-, cell-surface and total cell-associated mAb at various stages of hybridoma batch culture. Kinetic studies are shown and correlations between these parameters are postulated.
Materials and Methods
Cell line and cell propagation
A murine hybridoma cell line, I.13.17., producing a monoclonal IgG1 antibody, was used. It was derived by fusing X63.653 cells with lymphocytes of a BALB/cmouse. The cells were mycoplasma-negative (tested by the mycoplasma service of the Institut Pasteur). The nutritive medium was Dulbecco’s Modified Eagle’s Medium (DMEM) (Laboratory-mixed, using reagents from Merck, Sigma, Gibco), supplemented with 5%5 \% fetal calf serum (Medical and Veterinary Suppliers Ltd., Botoloph Claydon). Duplicate cultures were performed in roller vessels ( 500 ml working volume) at 37∘C37^{\circ} \mathrm{C}, in 5%CO25 \% \mathrm{CO}_{2} humidified atmosphere.
Cell growth and antibody assays
Viable and dead cell concentrations were estimated using the trypan blue exclusion method. Triplicate cell counts were performed daily, using a haemocytometer. For determination of the amount of secreted and total cell-associated antibody, a standard anti-mouse IgG ELISA was used (Merten, 1988).
Extraction of cytoplasmic and total cell-associated mAb
Total cell-associated mAb were extracted according to Meilhoc and coworkers (1989). Cytoplasmic mAb was isolated by 3 times freezing-thawing a suspension of 10610^{6} cells. The final solution was centrifuged for 30 min at 8000 rpm .
Molecular techniques
Extraction of total cellular RNA was performed as previously described (Chomczynski and Sacchi, 1987). The amount of total cellular RNA extracted was estimated by spectrophotometric measurements at 260 nm . Dot blotting, prehybridization and hybridization experiments were carried out using standard techniques as described by Sambrook et al. (1990).
DNA probes
The heavy chain region probe was a 2.5 kb SacI fragment, encompassing domains C1-C3 of the mouse gamma1 gene subcloned into Bluescript (Tasuku et al., 1979). The light chain region probe was a 830 bp fragment spanning in part, the constant domain of the mouse kappa gene cloned by oligo(dC).oligo(dG) tailing in the Pst I site of pBR 322 (Rochaix et al., 1978). DNA probes used in binding assays were prepared by [32P]\left[{ }^{32} \mathrm{P}\right]-labelling the restriction enzyme digests, using a Multiprime labelling kit (Amersham) and purified by passage over a Sephadex G-50 column. Their specific activity was 2.5×10⁸cpm2.5 \times 10^{8} \mathrm{cpm} per μg\mu \mathrm{g}. Autoradiography was carried out overnight with an intensifying screen at −80∘C-80^{\circ} \mathrm{C}. Specific RNA was quantified by densitometric scanning of the autoradiograms.
Flow cytometric analysis
Staining for membrane-bound IgG
Daily harvested cells were washed twice in phosphate-buffered saline (PBS pH 7.4). Aliquots of 10610^{6} cells were incubated for 60 min at 4∘C4^{\circ} \mathrm{C} in 100μl100 \mu \mathrm{l} of fluorescein-conjugated anti-mouse IgG (gamma specific), fluorescein-conjugated anti-mouse IgG (whole molecule) (Sigma), or fluorescein-conjugated anti-mouse IgG (kappa specific) (Nordic immunological laboratories) at 1/101 / 10 dilution. Following two washes in cold PBS containing 2%2 \% bovine serum albumin and 0.02%0.02 \% sodium azide, cells were resuspended in PBS for FACS analysis.
Staining for cytoplasmic IgG\operatorname{Ig} G
In order to minimize the interference of surface IgG\operatorname{IgG} reactivity with the determination of cytoplasmic IgG\operatorname{IgG}, we specifically blocked surface-membrane IgG\operatorname{IgG} as follows. Aliquots of 10610^{6} washed cells were incubated with 50μl50 \mu \mathrm{l} ( 20μ g20 \mu \mathrm{~g} of a F(ab′)2\mathrm{F}\left(\mathrm{ab}^{\prime}\right) 2 purified goat anti-mouse IgG (Sigma). Cells were then washed twice in PBS and fixed in 2%2 \% paraformaldehyde solution as described by Lakhanpal et al. (1987). Cells which react with 1/101 / 10 dilution of FITC goat anti-mouse IgM (Sigma), served as a control for non-specific binding.
All cytofluorometric analyses were performed using a flow cytometer, FC (EPICS 752-Coulter, HIALEAH-FL). The cells were excited with a 488 nm argon ion laser. For colour analysis, a 530 nm short-pass filter for FITC was employed. Analysis was restricted to viable cells, by gating cells on the basis of forward and right-angle light scatters.
Results and Discussion
Batch growth and mAb production kinetics of the I.13.17. hybridoma
Figs. 1A, B display viable hybridoma density, mAb concentration, viability and specific mAb production rate as a function of the age of the culture. In accordance with previously described observations (Merten, 1988), the culture started with a lag phase of about 20 h , followed by a rapid increase in cell density during the exponential phase from 20 h to 70 h . The cells then entered a decline phase during which time culture viability began to decrease. However, after 92 h , when viability was less than 30%30 \%, the specific mAb production rate increased significantly (Fig. 1B).
Increases in mAb productivity during the decline phase have been reported in many hybridoma cell lines (Birch et al., 1987; Merten, 1988; Velez et al., 1986). In some cases, a more or less growth-associated production was found which stopped completely when the cells entered the stationary and dead phases (Dalili and Ollis, 1990; Fazekas de St-Groth, 1983; Merten et al., 1985).
Kinetics of membrane-bound and cytoplasmic mAb
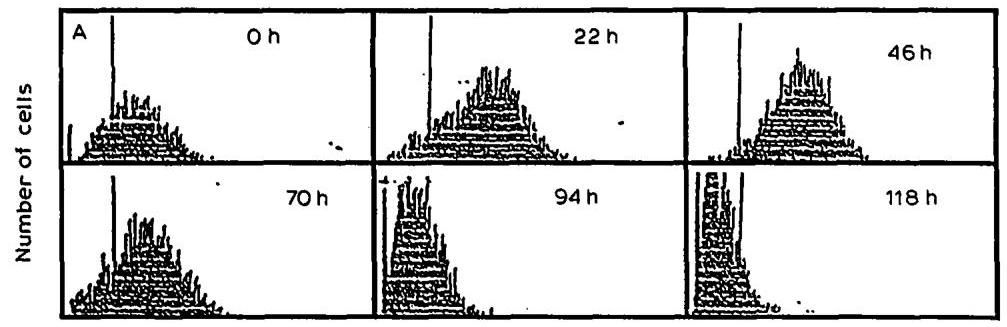
The time course of mean surface immunofluorescence intensity during the batch culture is shown in Fig. 2A. Results obtained using the three staining reagents (see Materials and Methods) were quantitatively similar; a detailed analysis of one (FITC-conjugated anti-mouse IgG: whole molecule specific) is presented below.
Fig. 2B shows that during the exponential phase of growth, there was an increasing immunofluorescence intensity representing membrane-bound mAb with a maximum at 46 h . During the decline phase of growth, the immunofluorescence intensity decreased rapidly. After 94 h , almost no cells positively stained for membrane-bound mAb could be detected; the peak was largely located on the left
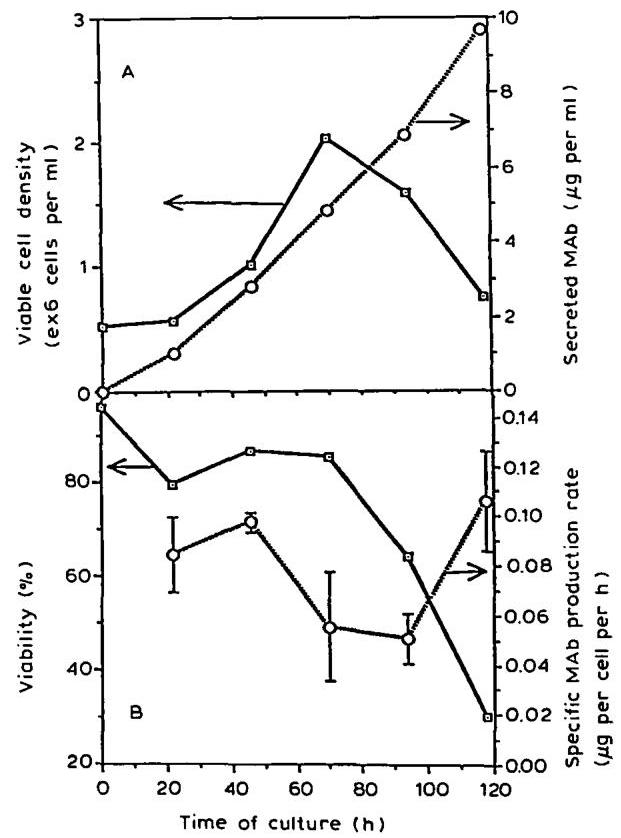
Fig. 1. Kinetics of (A) viable cells and secreted mAb , (B) cell viability and specific antibody production rate during I.13.17. batch culture.
of the lower threshold. These results are consistent with a previous report (Meilhoc et al., 1989).
As for the development of the membrane-bound mAb immunofluorescence intensity, the profiles of total cell-associated mAb (not shown) and cytoplasmic mAb (Fig. 2B) exhibited a maximum at 46 h and declined rapidly at the end of the exponential growth and during the death phase. A significant correlation (regression coefficient r2=0.96r^{2}=0.96 ) between both parameters was found for the exponential growth phase ( 0−94 h0-94 \mathrm{~h} ) (Fig. 3). However, during the decline growth phase, a second peak of cytoplasmic mAb has been found which did not correlate at all with the membrane-bound mAb levels determined by FC analysis (Fig. 2B). Electron microscopy experiments (Al-Rubeai et al., 1990) and mass balance analysis (Merten et al., 1990a) have shown that dead cells might still store a certain amount of mAb . Therefore, it seems likely that, as far as the calculation of the specific mAb production rate is concerned, the values for cytoplasmic mAb obtained during the decline phase of growth are greatly influenced by the presence of dead cells and their non released mAb .
Mean surface immunofluorescence intensity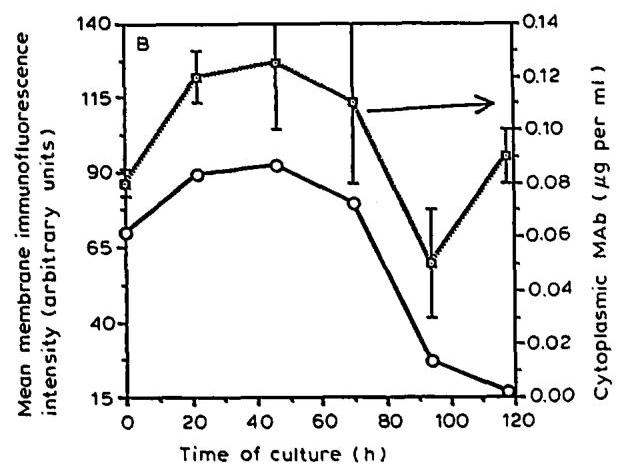
Fig. 2. (A) Flow cytometry analysis of membrane-bound mAb during I.13.17. batch culture. The cells were stained with FITC-conjugated antisera specific to gamma, kappa or whole IgG molecule. (B) Time course of mean surface immunofluorescence intensity determined by FC analysis and cytoplasmic mAb measured by ELISA of cell-lysates (Fig. 1A).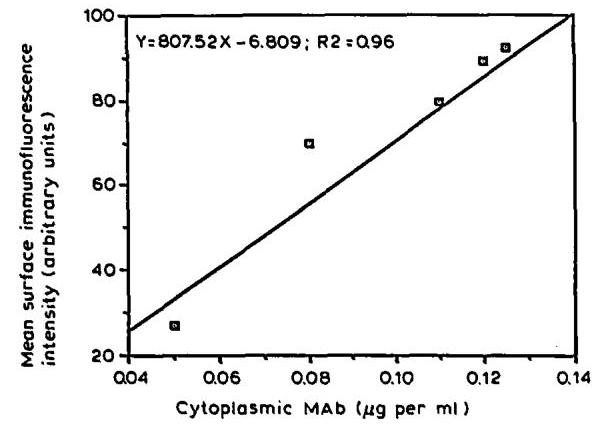
Fig. 3. Correlation between cytoplasmic mAb (by ELISA) and mean surface immunofluorescence intensity (by FC analysis) during I.13.17. batch culture (Fig. 1A: 0-94 h).
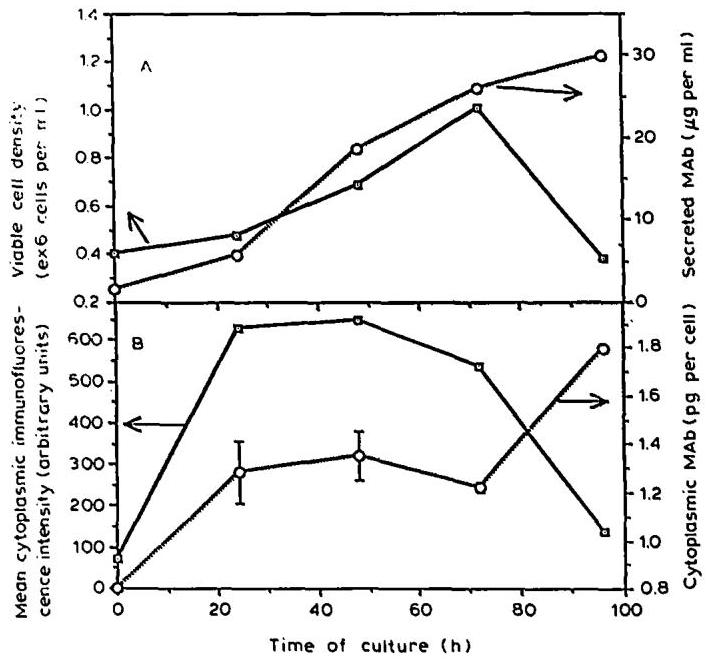
Fig. 4. Time course of (A) viable cell density and secreted mAb , (B) cytoplasmic mAb levels measured by ELISA of cell-lysates and mean cytoplasmic mAb immunofluorescence intensity determined by FC analysis during I.13.17. batch culture (second set of cultures).
In order to examine this possibility further, we have conducted a second set of batch experiments using the same hybridoma cell line (I.13.17.). In contrast to the first set of experiments, we have performed FC analyses to measure cytoplasmic and membrane-bound mAb , beside measuring cytoplasmic-, secreted and total cell-associated mAb by ELISA. Figs. 4A, B show the different culture parameters that were recorded. It can be seen that the amount of cytoplasmic mAb increased rapidly at the beginning of the exponential phase and stayed relatively constant up to the maximum cell density ( 50−72 h50-72 \mathrm{~h} ). However, the amount of cytoplasmic mAb determined by FC analysis decreased significantly during the decline phase, whereas it increased (almost doubled) when measured by ELISA of the cell-lysates. Corrections for the presence of dead cells were applied to obtain more reliable correlations between these parameters.
The data in Table 1 suggest that the determination of cytoplasmic mAb by cell lysis and ELISA is certainly influenced by the presence of dead cells, which account for 40 to 70%70 \% of total cells during the decline phase of growth. Several investigators have reported that up to 7%7 \% of mAb which were synthesized during the exponential batch growth was not released to the growth medium (Al-Rubeai and Emery, 1990a; Meilhoc et al., 1989; Merten et al., 1990a), but might be stored within the cell or anchored to the cell membrane. Although not proven by biochemical methods, both possibilities might exist in parallel for at least two reasons: the levels of cytoplasmic and membrane-bound mAb showed maxima
TABLE 1
Correlations between membrane-bound mAb (Y) measured by FC analysis and cytoplasmic mAb (X) determined by FC analysis or cell-lysates ELISA (1) without or (2) with viability correction during 1.13.17. batch culture (Fig. 4A)
| Membrane-bound mAb levels (Y) | Cytoplasmic mAb levels (X) | Regression coefficient ( τ2\tau^{2} ) | Regression equation Y=B(X)\mathrm{Y}=\mathrm{B}(\mathrm{X}) |
|---|---|---|---|
| FC analysis | FC analysis | 0.98 | 925.93X−5.11925.93 \mathrm{X}-5.11 |
| FC analysis | ELISA (1) | 0.006 | 60.34X+326.5660.34 \mathrm{X}+326.56 |
| FC analysis | ELISA (2) | 0.96 | 1166.65X−528.571166.65 \mathrm{X}-528.57 |
during the exponential growth phase, both mAb species may be similar and have the same origin. Since the levels of both mAb decrease significantly during the death phase, it seems likely that membrane-bound mAb can be considered as a transit mAb which have not been yet totally secreted.
Kinetics of hoary and light chain mRNAs
Previous experiments (Merten et al., 1990b) have been conducted to determine the hybridization specificity of the heavy and light chain DNA probes used in this report and to characterize the gamma and kappa mRNAs with respect to their size. We have conducted experiments to investigate the cellular levels of both mRNAs during the different stages of hybridoma batch cultivation.
Dot blot hybridizations shown in Fig. 5 reveal that the cellular amounts of kappa and gamma mRNAs peaked at 48−69 h48-69 \mathrm{~h} during the late exponential growth. The peak observed at the beginning of the culture may correspond to the physiological state of the inoculum. During the decline phase of the culture ( 70−118 h70-118 \mathrm{~h} ), there is a 7 - to 10 -fold decrease in the levels of both mRNAs, compared to the levels found during the end of the exponential and the beginning of the decline phases of growth.
Dalili and Ollis (1990) recently reported maximum levels of average RNA content and mAb concentration during the exponential phase of hybridoma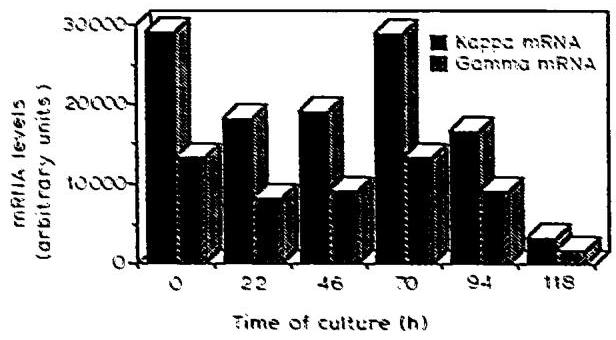
Fig. 5. Time course of kappa and gamma chain mRNAs during 1.13.17. batch culture (Fig. 1A).
growth. Comparison of Figs. 2B and 5 shows that the profiles of kappa and gamma chain mRNAs follow the kinetics of membrane-bound mAb (measured by FC analysis) throughout the culture. Again, it is intriguing to note that during the death phase, the second peak of the specific mAb production rate (Fig. 1B) does not fit the general trend of decrease of several parameters (cytoplasmic and membrane-bound mAb determined by FC analysis, kappa and gamma chain mRNAs). Recently, we found correlations between the cytoplasmic mAb with gamma chain mRNA ( r2=0.91r^{2}=0.91 ), and kappa chain mRNA ( r2=0.82r^{2}=0.82 ) (Merten et al., 1990b). Morenkov and coworkers (1989) have reported a 15 to 25%25 \% decrease in the ribosomal content per cell, a 2 -fold decrease in ribosome protein involved in mRNA translation, and a 5 to 15%15 \% decrease in the mRNA translation rate during the decline phase of hybridoma growth. Therefore, the present results and literature data favor the hypothesis that most of the mAb released during the decline phase of growth is liberated from dying or dead cells rather than being produced by de novo synthesis, although several investigators have claimed the opposite (Birch et al., 1987; Renard et al., 1988; Walker et al., 1987). These results also lead to the conclusion that, depending on cell lines used and culture conditions employed, the rate of antibody production is related in part to the cellular levels of heavy and light chain mRNAs, but also to some post-transcriptional events. Studies are in progress to determine the stability of kappa and gamma chain mRNAs and their translational efficiency during hybridoma batch and continuous cultivations.
Conclusion
In order to determine how closely the processes of mAb synthesis and secretion are associated with the various physiological stages of cells during hybridoma batch culture, specific mRNA dot blot hybridizations, and FC analyses of cytoplasmic and membrane-bound mAb were performed. The need to include FC analysis for the determination of cytoplasmic mAb content per cell during the decline phase of growth was demonstrated. It appears that, as the cells pass from the exponential into the decline phase of growth, there is a general trend for a decrease in the levels of several intracellular parameters such as kappa and gamma chain mRNA concentrations, as well as cytoplasmic and membrane-bound mAb concentrations, but the kinetics of these parameters do not correlate with the profile of the specific mAb production rate throughout the culture. Our findings suggest that cells may reduce to a large extent or altogether stop mAb synthesis during the death phase. It seems likely that some of the differences observed in our studies and in those of other workers may simply reflect the interference of dead cells, as we have demonstrated in our system or the influence of some post-transcriptional events.
Acknowledgements
M. Leno is supported by a grant from Bertin et Cie, to whom he is grateful. We thank Dr Mohamed Al-Rubeai (University of Birmingham, U.K.) for critical reading of the manuscript.
References
Al-Rubeai, M. and Emery, A.N. (1990a) Regulation of cell proliferation and protein synthesis in hybridoma. Presented at the 10th ESACT Meeting on Production of biologicals from animal cells in culture: Research, development and achievements, May 7th-11th 1990, Avignon, France.
Al-Rubeai, M. and Emery, A.N. (1990b) Mechanisms and kinetics of monoclonal antibody synthesis and secretion in synchronous and asynchronous hybridoma cell culture. J. Biotechnol. 16, 67-86.
Al-Rubeai, M., Mills, M. and Emery, A.N. (1990) Electron microscopy of hybridoma cells with special regard to monoclonal antibody production. Cytotechnology 4, 13-28.
Birch, J.R., Thompson, P.W., Boraston, R., Oliver S. and Lambert, K. (1987) The large-scale production of m-Ab in airlift fermenters. In: Webb, C. and Mavituna, F. (Eds.), Plant and Animal Cells: Process Possibilities. Ellis H. Ltd, Chichester, pp. 162-171.
Blattner, F.R. and Tucker, P.W. (1984) The molecular biology of IgD. Nature 307, 417-422.
Buell, D.N. and Fahey, J.L. (1969) Limited periods of gene immunoglobulin-synthesizing cell. Science 164,1524−1525164,1524-1525.
Chomczynski, P. and Sacchi, N. (1987) Single-step method of RNA isolation by acid guanidinium thiocyanate-phenol-chloroform extraction. Anal. Biochem. 162, 156-159.
Dalili, M. and Ollis, F.D. (1990) A flow-cytometric analysis of hybridoma growth and monoclonal antibody production. Biotechnol. Bioeng. 36, 64-73.
Emery, A.N. (1986) Growth of hybridomas and secretion of monoclonal antibodies in vitro. Presented at the Society of chemical industry symposium on large-scale production of monoclonal antibodies, 9th December 1986, London, U.K.
Fazekas de St-Groth, S. (1983) Automated production of monoclonal antibody in a cytostat. J. Immunol. Methods 57, 121-136.
Lakhanpal, S., Gonchoroff, N.J., Katzmann, A. and Handwerger, S. (1987) A flow cytofluorometric double staining technique for simultaneous determination of human mononuclear cell surface phenotype and cell cycle phase. J. Immunol. Methods 96, 35-40.
Meilhoc, E., Wittrup, K.D. and Bailey, J.E. (1989) Application of flow cytometric measurement of surface IgG in kinetics analysis of monoclonal antibody synthesis and secretion by murine hybridoma cells. J. Immunol. Methods 121, 167-174.
Merten, O.-W. (1988) Batch production and growth kinetics of hybridomas. Cytotechnology 1, 113-121.
Merten, O.-W., Keller, H., Cabanié, L., Leno, M. and Hardefelt, M. (1990a) Batch production and secretion kinetics of hybridomas: Pulse-chase experiments. Cytotechnology 4, 77-89.
Merten, O.-W., Leno, M. and Hache, J. (1990b) Quantitation of mRNA specific for heavy and light chains IgG in hybridomas during different phases of batch culture. Presented at the 10th ESACT Meeting on Production of Biologicals from Animal Cells in Culture Research, Development and Achievements, May 7th-11th, 1990, Avignon, France.
Merten, O.-W., Palfi, G.E., Klement, G. and Steindl, F. (1987) Specific kinetic patterns of production of monoclonal antibodies in batch cultures and consequences on fermentation processes. In: Spier, R.E., Griffiths, J.B. (Eds.) Modern approaches to Animal Cell Technology, Butterworths & Co, Publishers, Ltd., pp. 381-396.
Merten, O.-W., Reiter, S., Himmler, G., Scheirer, W. and Katinger, H. (1985) Production kinetics of monoclonal antibodies. Develop. Biol. Stand. 60, 219-227.
Morenkov, O.S., Mantsyghin, Y.A. and Lezhnev, E.I. (1989) Regulation of synthesis of total cellular proteins and m-Ab in hybridoma cell cultures. Tsitologiia 31, 324-335.
Renard, J.M., Spagnoli, R., Mazier, C., Sallis, M.F. and Mandine, Z. (1988) Evidence that monoclonal antibody production kinetics is related to the integral of the viable cells curve in batch systems. Biotechnol. Lett. 2, 91-96.
Rochaix, J.D., Rougeon, F. and Mach, B. (1978) Electron microscope analysis of mouse and rabbit globin and Ig gene sequence. Gene 3, 9-16.
Sambrook, J., Fritsch, E.F. and Maniatis, T. (1990) Molecular Cloning - A Laboratory Manual (2nd Edit.). Cold Spring Harbor Laboratory, Cold Spring Harbor, New York, pp. 7.53-7.57.
Suzuki, E. and Ollis, D.F. (1989) Cell cycle model for antibody production kinetics. Biotechnol. Bioeng. 34,1398−140234,1398-1402.
Takahashi, M., Yagi, Y., Moore, G.E. and Pressman, D. (1969) Immunoglobulin production in synchronized cultures of human hematopoietic cell lines. J. Immunol. 103, 834-843.
Tasuku, H., Obata, M., Yuriko, Y.K., Tohru, K., Kawakami, T., Naoki, T. and Mano, Y. (1979) Cloning and complete nucleotide sequence of mouse immunoglobulin gamma1 chain gene. Cell 18, 559-568.
Velez, D., Reuveny, S., Miller, L. and MacMillan, J.D. (1986) Kinetics of mAb production in low serum growth medium. J. Immunol. Methods 86, 45-52.
Walker, A.G., Davison, W. and Lambe, C.A. (1987) The mechanism of monoclonal antibody secretion by hybridomas. Proc. 4th Eur. Congress in Biotechnology, Vol. 3, Neijssel, O.M., Van der Meer, R.R. and Luyben, K. (Eds.), Elsevier Science Publishers, Amsterdam, p. 587.