Production of a nanostructured copper by Spark Plasma Sintering (original) (raw)
Abstract
![]()
AI
This research investigates the production of nanostructured copper through Spark Plasma Sintering (SPS) and focuses on the effects of cryomilling and various sintering parameters, including temperature, particle size, and pressure, on densification mechanisms. It presents the advantages of cryomilled copper, such as its lower sintering temperature and improved thermal stability, and highlights the achieved balance between strength and ductility in the final material.
FAQs
![]()
AI
What is the impact of heating rate on grain size during Spark Plasma Sintering (SPS)?add
The study found that increased heating rates promote a bimodal grain size distribution, leading to both nanometric and ultrafine grains in the final material, enhancing mechanical properties.
How does particle size influence densification mechanisms in cryomilled copper?add
Larger particles exhibit localized deformation and overheating during SPS, resulting in enhanced densification, whereas finer particles demonstrate more resistance to deformation despite the increased thermodynamic driving force for sintering.
What role does cryomilling play in enhancing the properties of nanostructured materials?add
Cryomilling significantly increases dislocation density and reduces particle agglomeration, enabling effective densification at lower sintering temperatures, thus preserving the nanostructure and improving mechanical properties.
When is pressure most effectively applied during the SPS process for optimal densification?add
Optimal densification occurs when final pressure is applied above the degassing temperature (around 450°C), enhancing the sintering ability of the cryomilled material without leading to substantial grain growth.
What mechanistic stages are involved in the SPS of copper powders according to the study?add
The densification process entails four main stages: particle rearrangement, local deformation, bulk deformation, and sintering, with effective sintering typically occurring at temperatures above 600°C.
Figures (71)
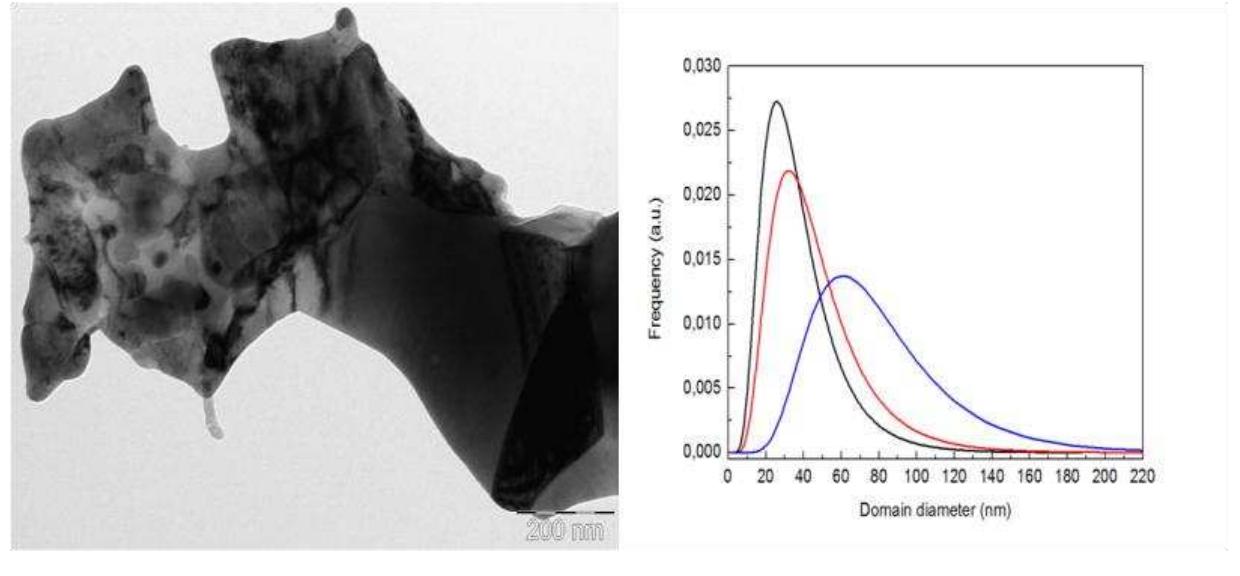
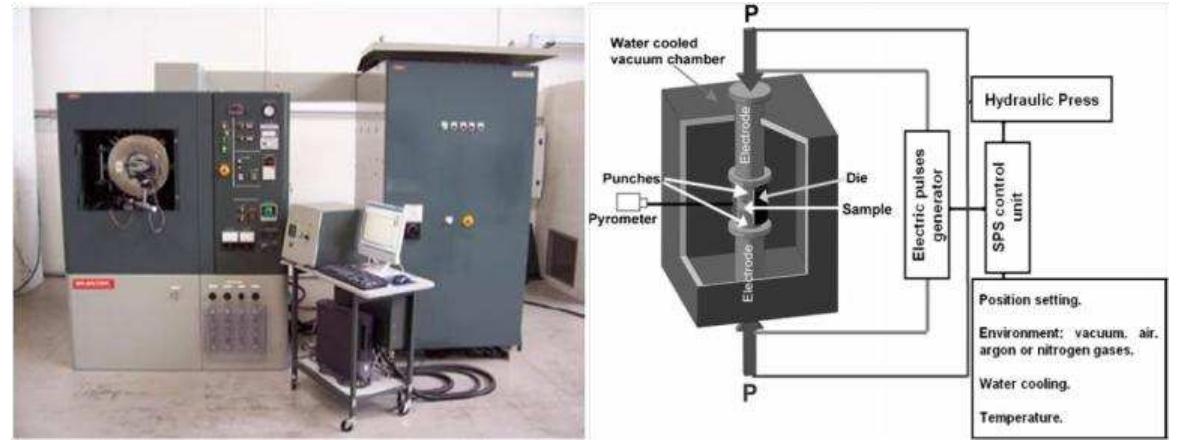
Figure 1: DR.SINTER 1050 system (left) and a schematic of the SPS system (Hungria T., 2009 ) (right) unit and various interlock safety units (M.Tokita)
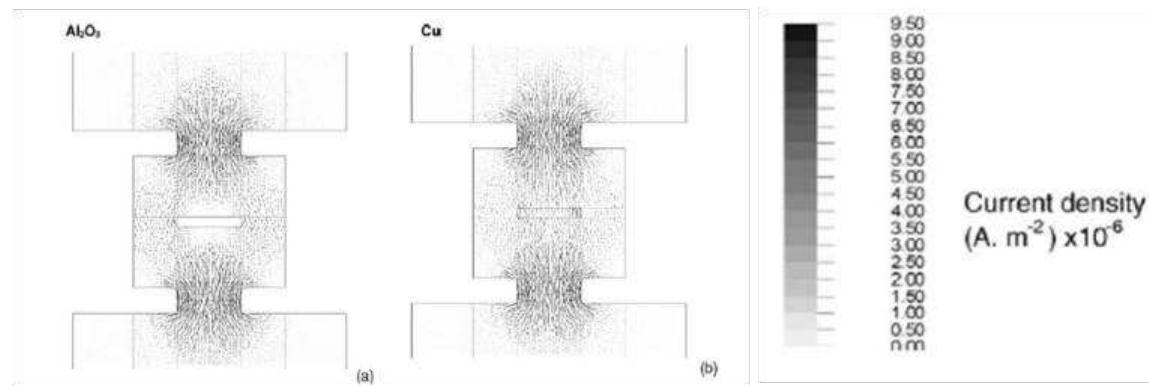
Figure 2: Current distributions in the SPS die for alumina and copper samples mea in ee, 1 ae | mewrem room temperature applying a voltage of 4 V.
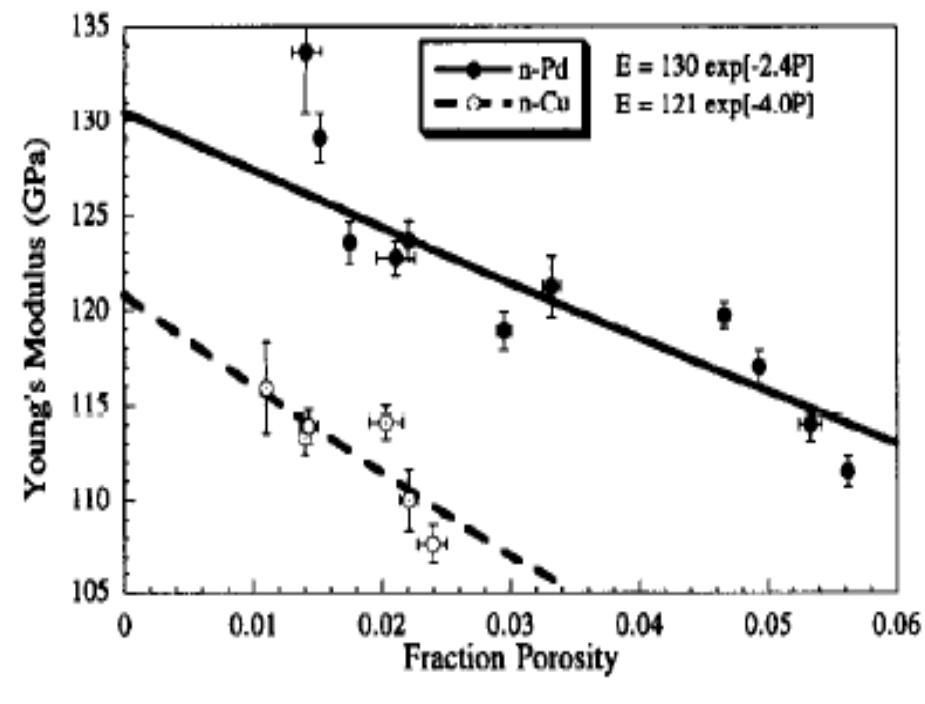
Figure 4: Young's Modulus as a funtion of porosity for nanocrystalline Cu and Pd (Sanders P.G., 1997).
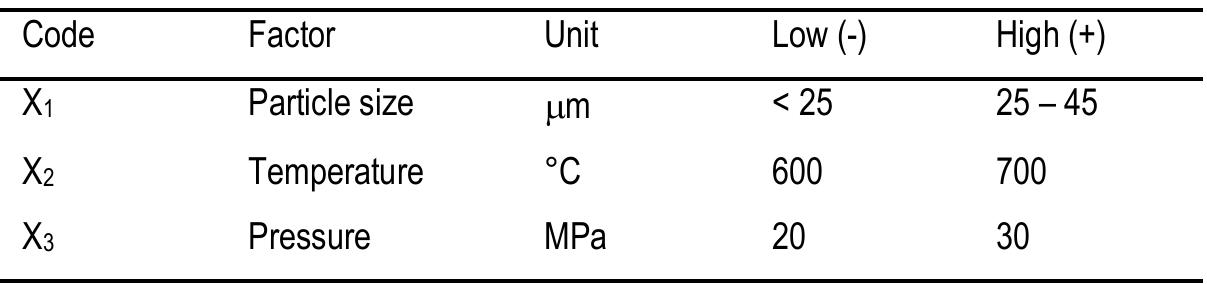
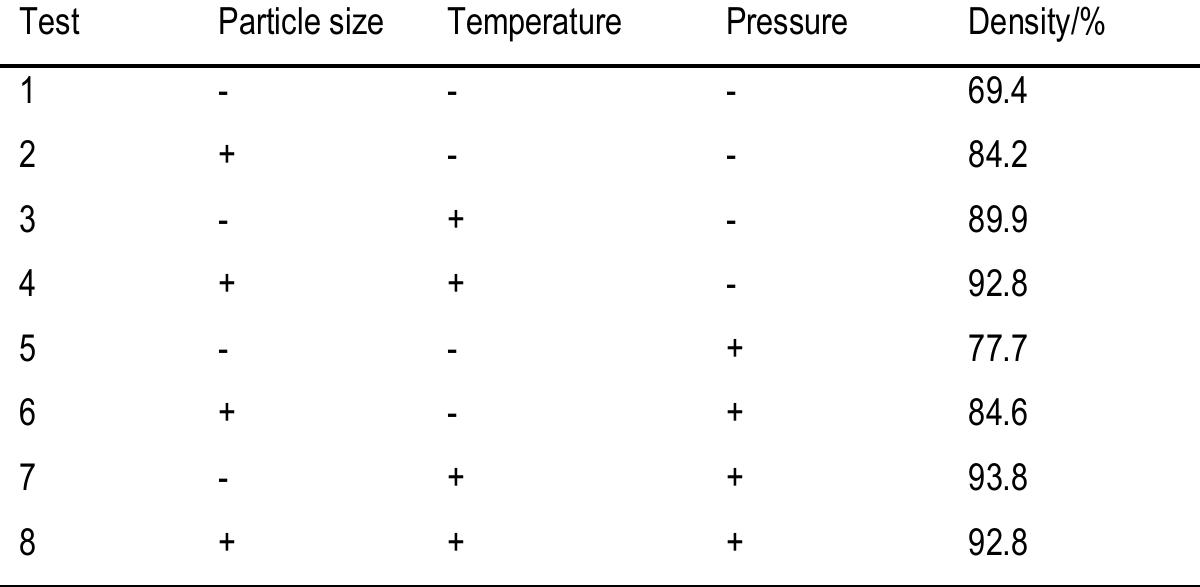
Table 2: 23 factorial design matrix and density of spark plasma sintered copper Data were analyzed using R software (Team, 2010). Equation (2) is the empirical formula describing the effect on density of each parameter as well as the interaction effects between them Data were analyzed using R software (Team, 2010). Equation (2) is the empirical reached 500°C. The relative density obtained with reference to the theoretical one (8 99 q/am3) ie chown in Table 2.
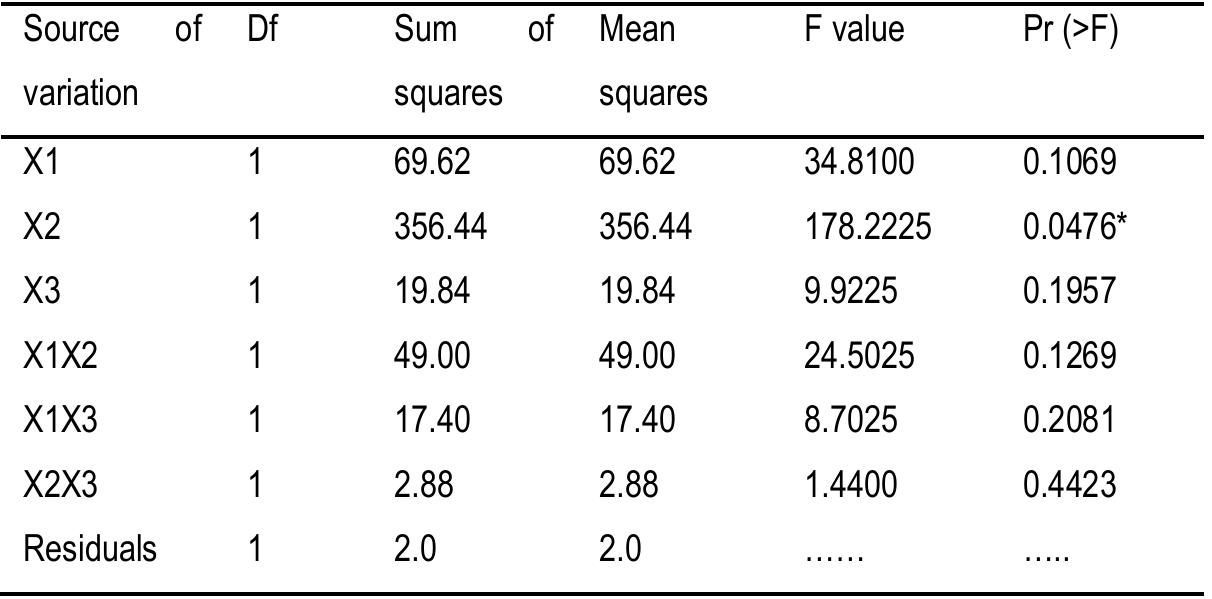
Table 3: ANOVA table with parameters effects
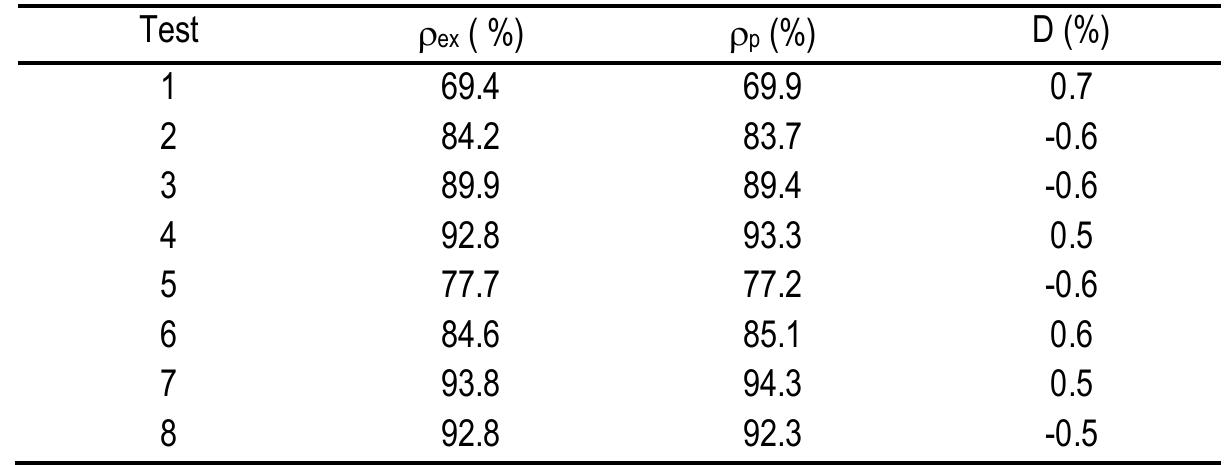
Table 4: Deviation D between experimental density pex and predicted density pp
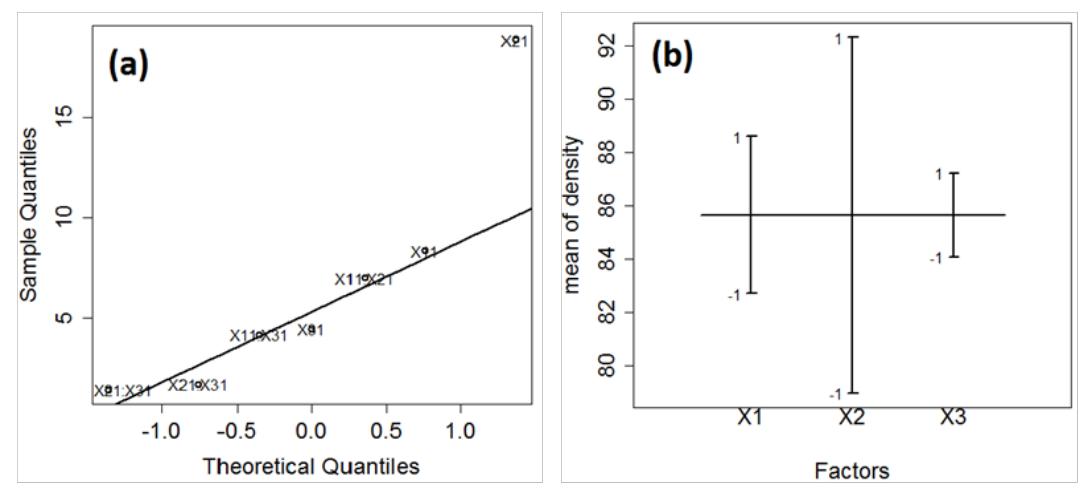
Figure 5: (a) normal Q—Q and (b) model design plots of factors effects on density ne produced specimens is given by equation (3)
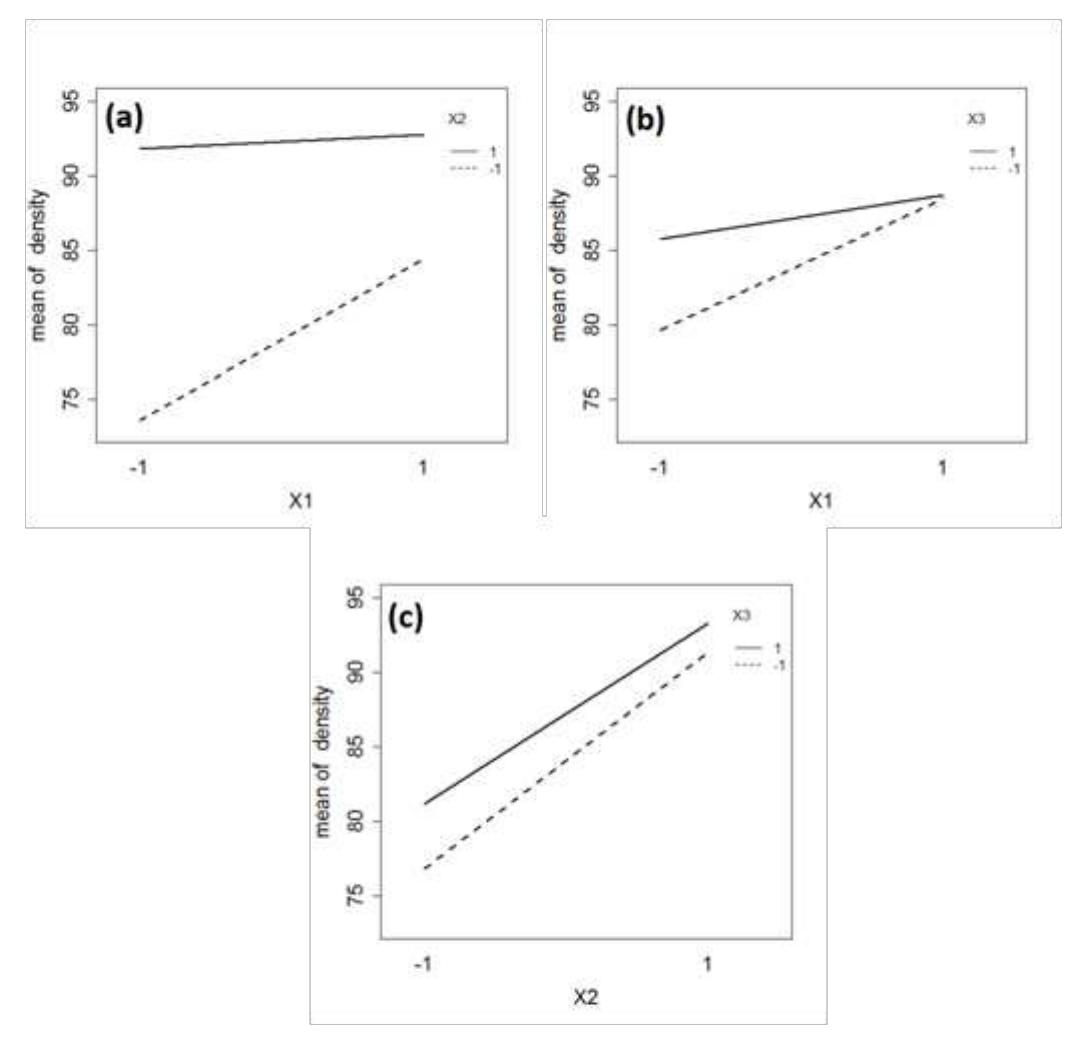
temperature-pressure interaction effects on density The low values of D confirm the high matching of the model with the experimental data.
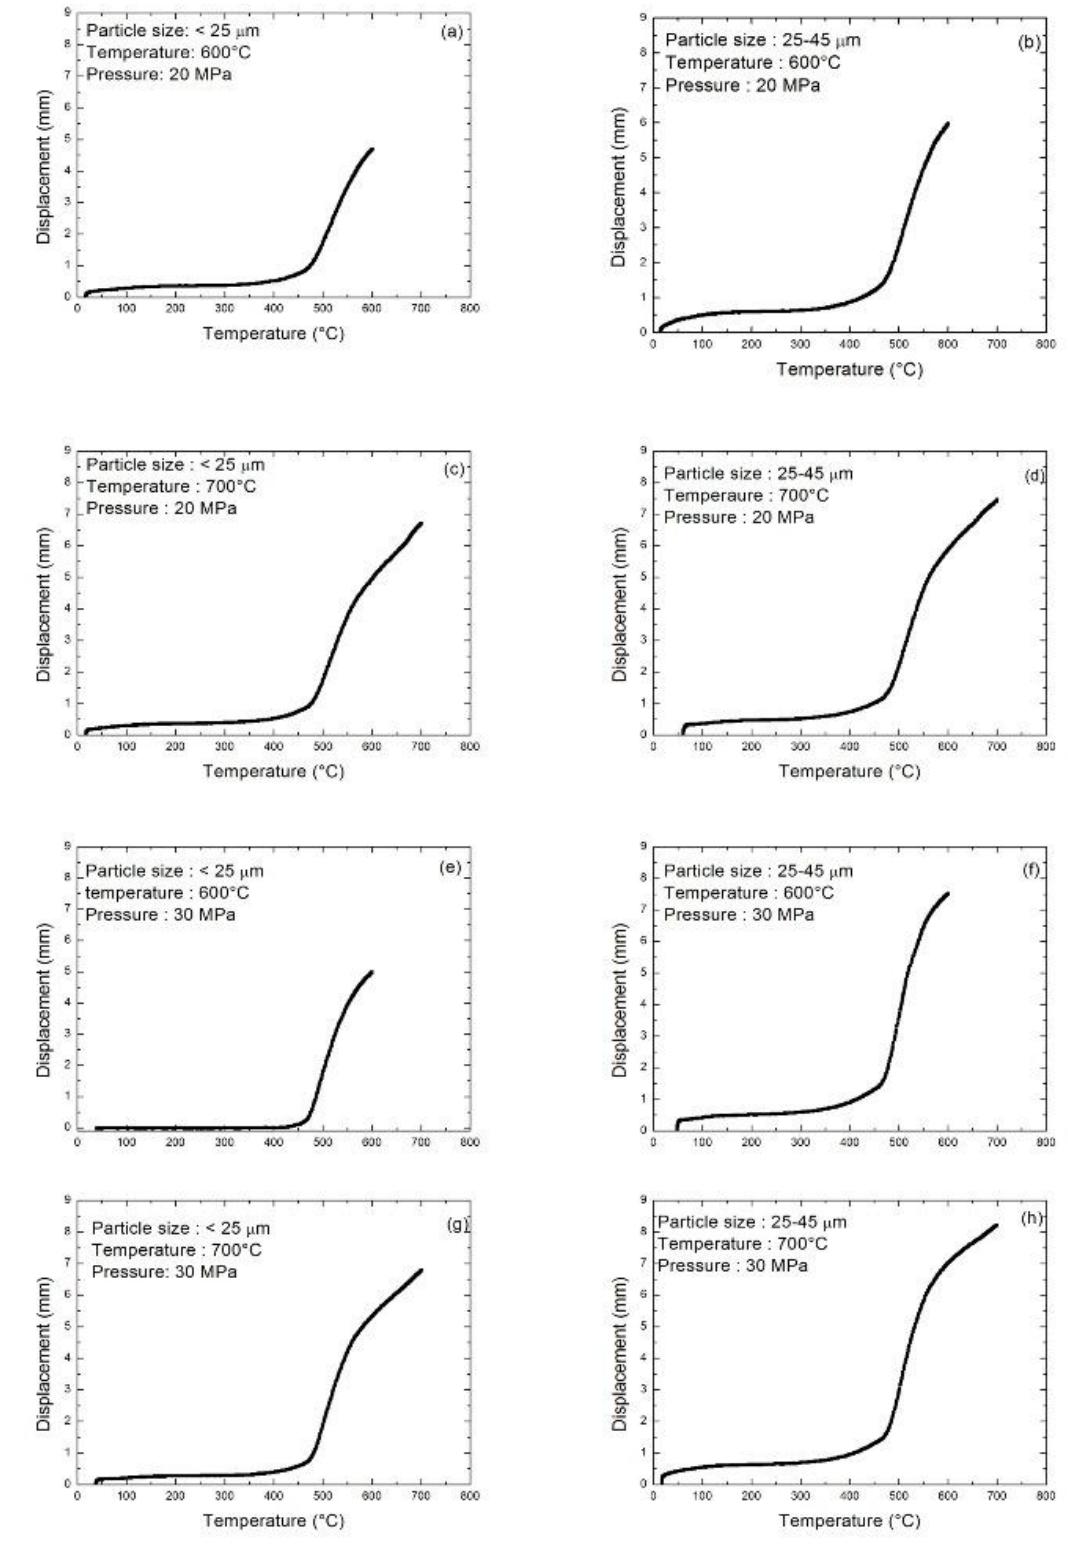
Figure 7: Displacement versus temperature curves of SPS experiments
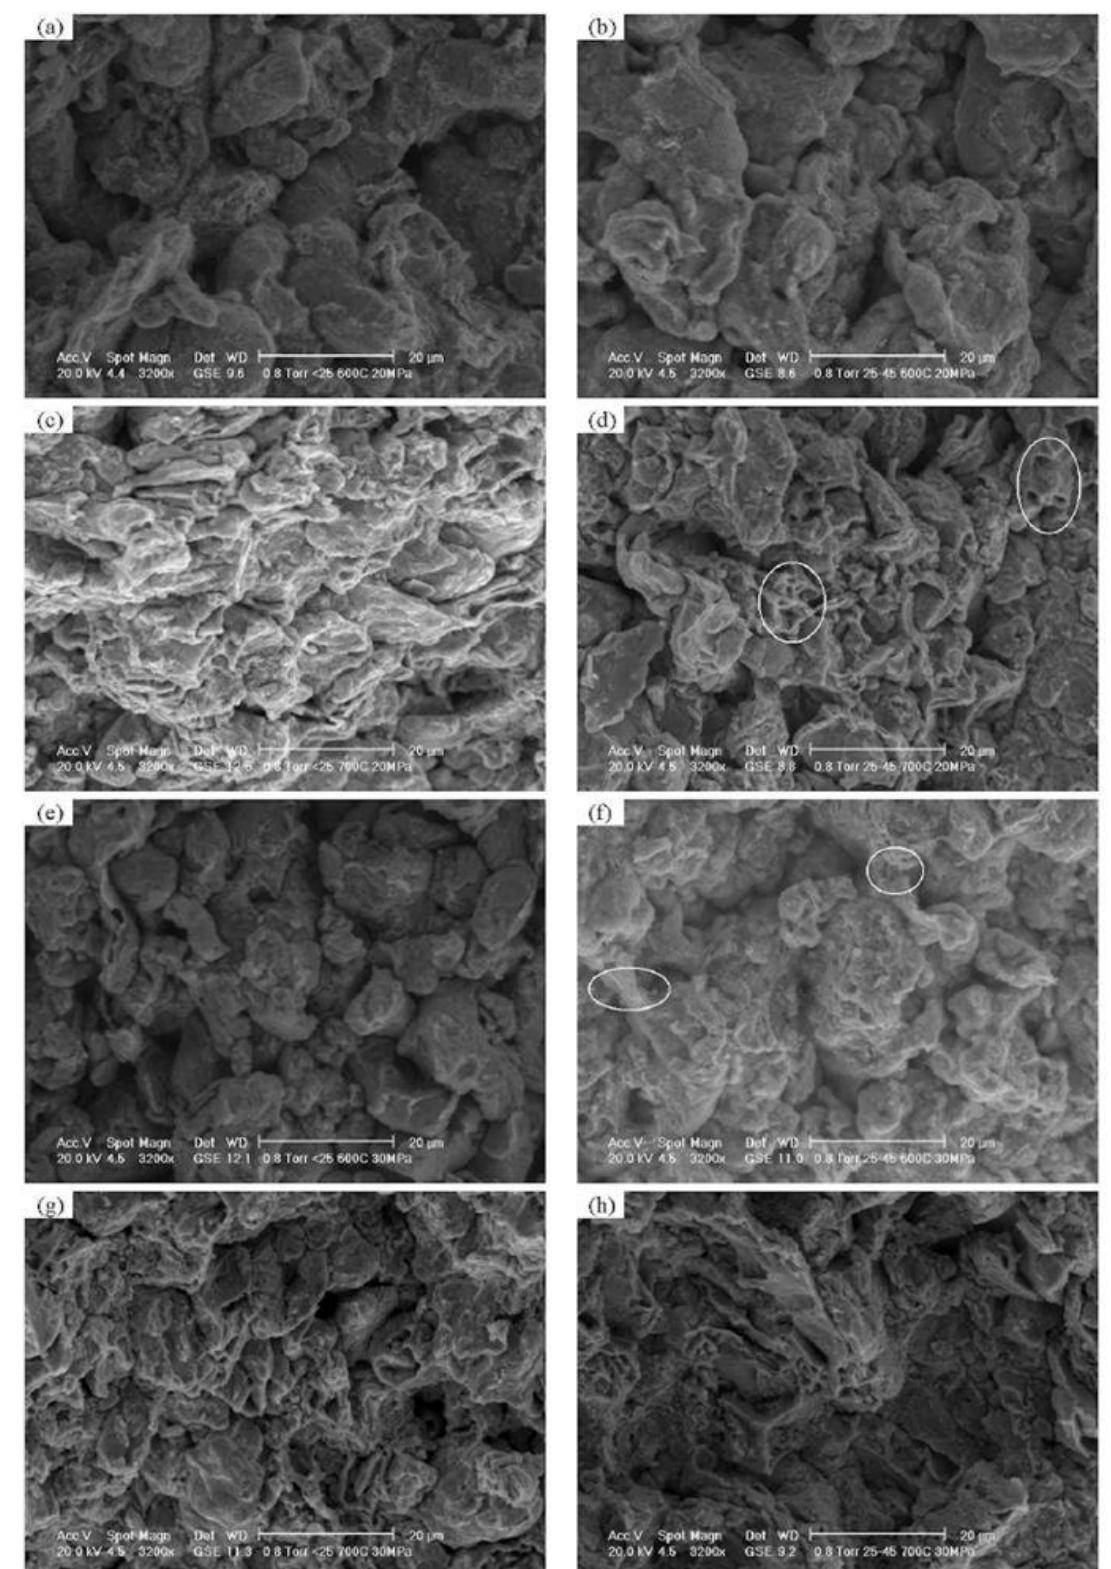
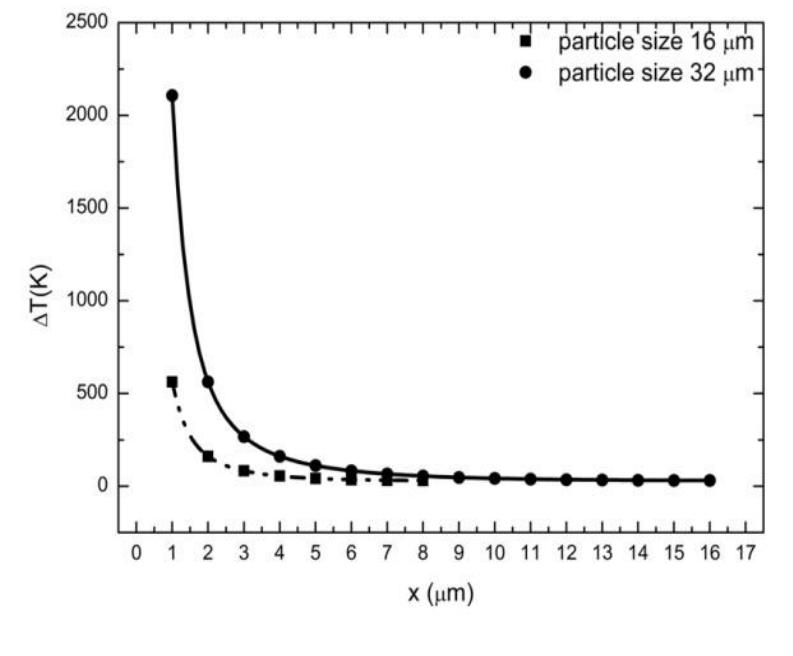
Figure 9: Distribution of temperature increase in particle from surface to core
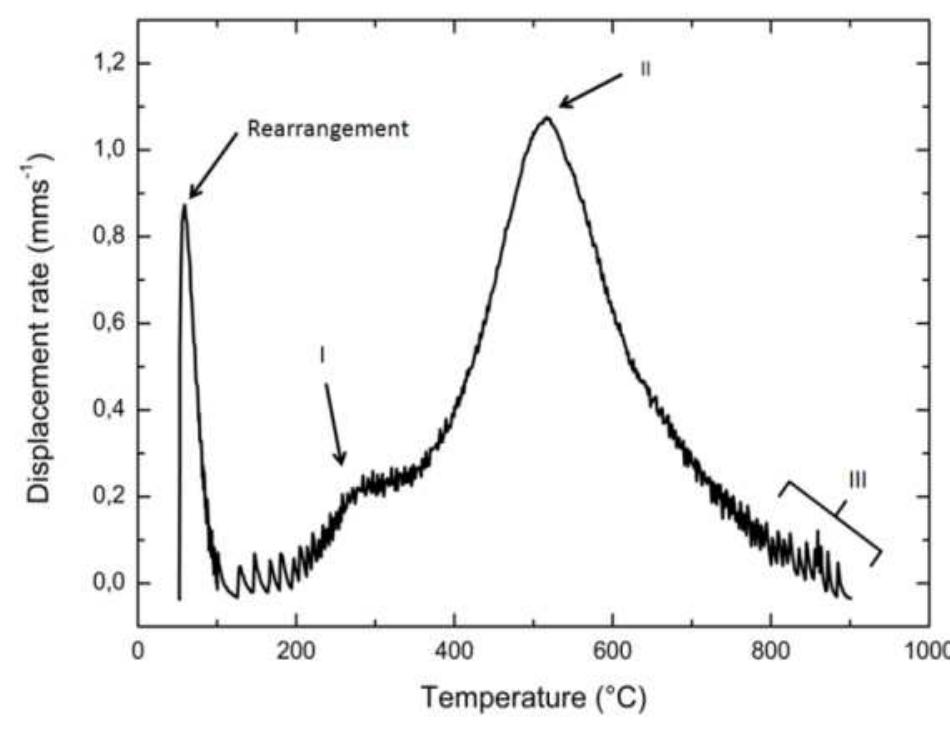
The first peak can be attributed to the initial rearrangement of the powder particles
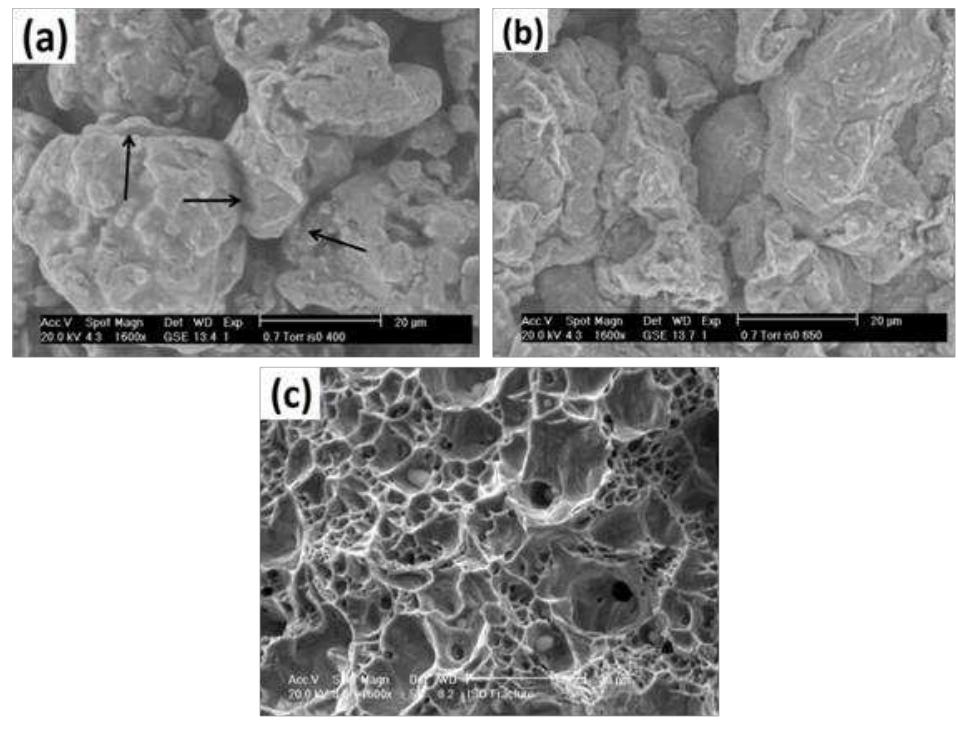
Figure 11: Fracture surface of the sintered specimens up to a) 400°C, b) 650°C and c) 900°C
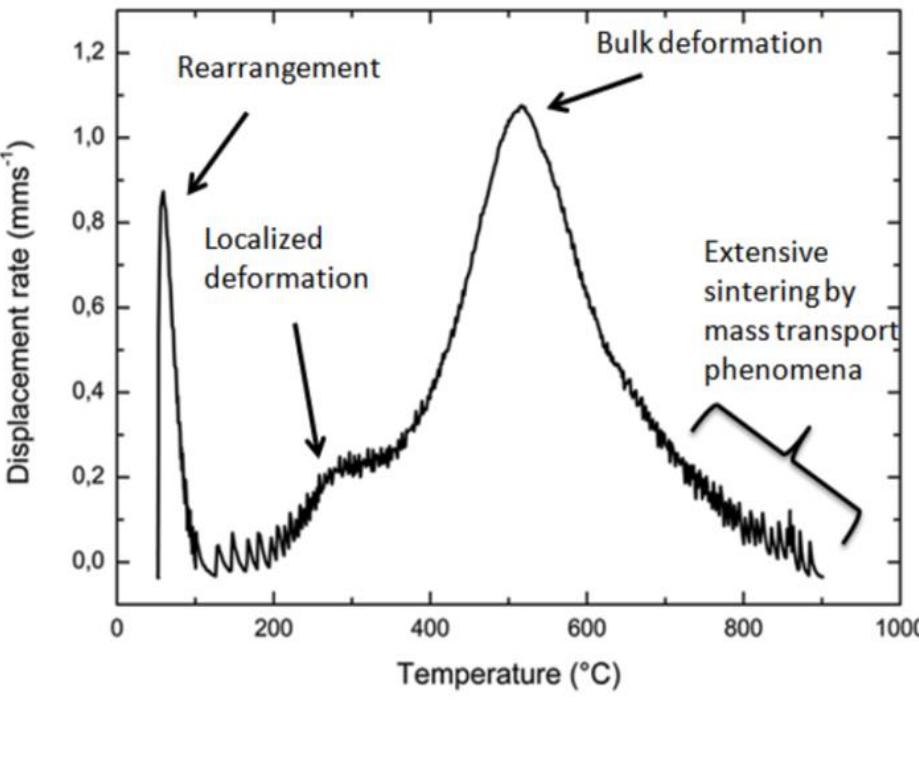
Figure 12: Displacement rate versus temperature
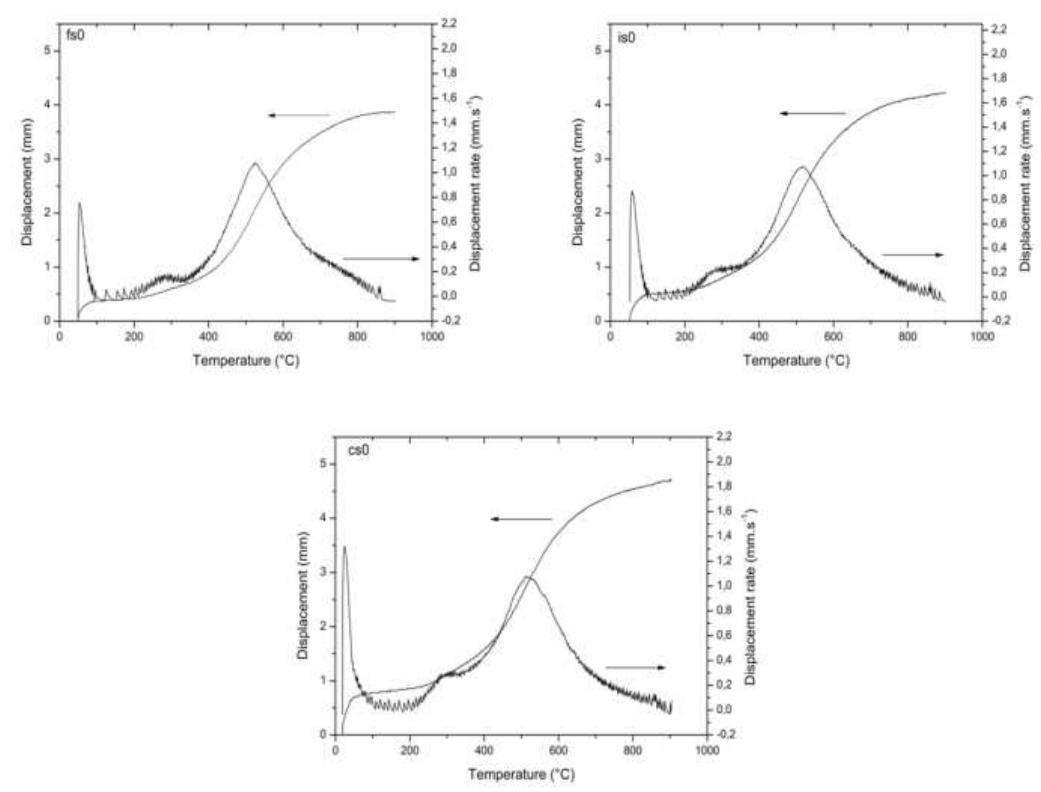
Figure 13: Displacement and displacement rate versus temperature of the three different particle size applying only the initial pressure
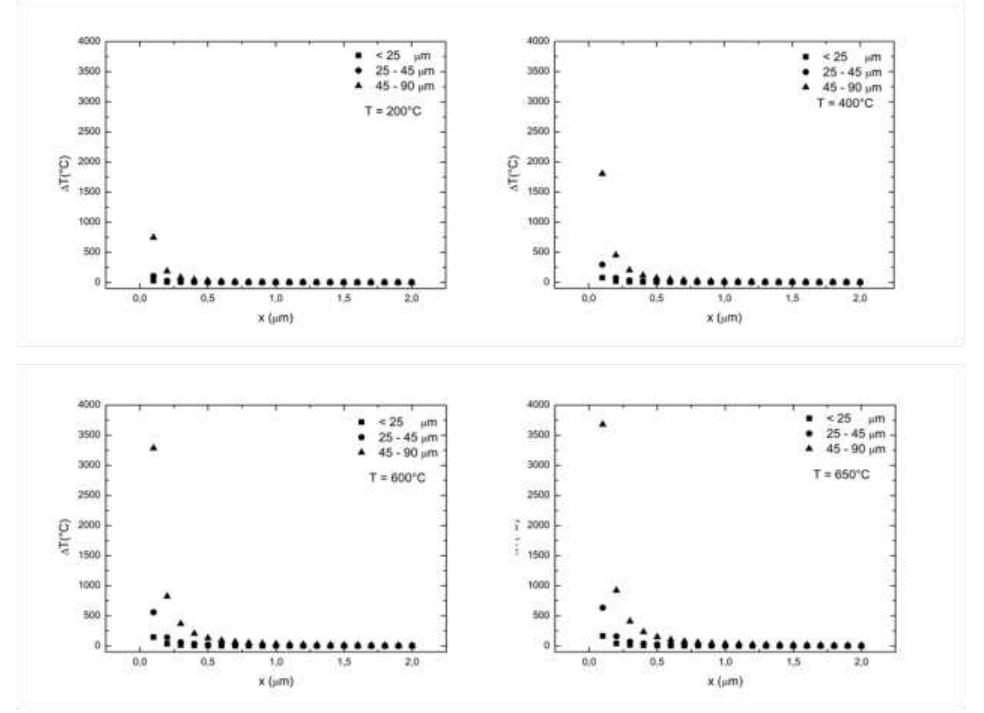
Figure 14: Temperature increase profile from surface to the core of particles four different temperatures is shown in Figure 14.
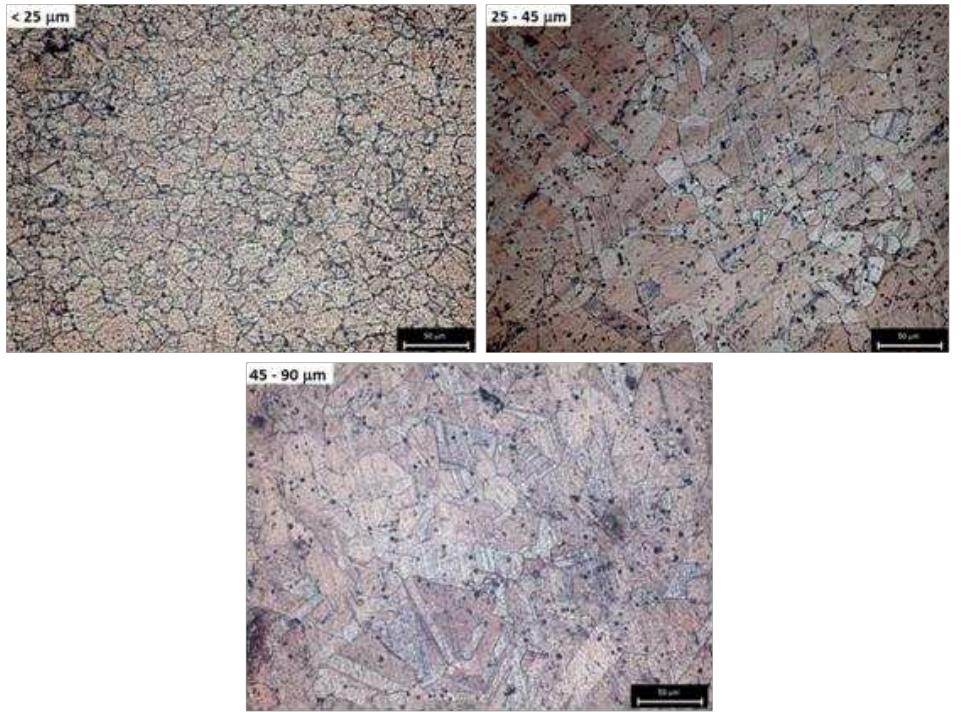
Figure 15: Microstructure of the sintered specimens applying only the initial pressure is shown by the less dense material. The justification for this apparent contradiction
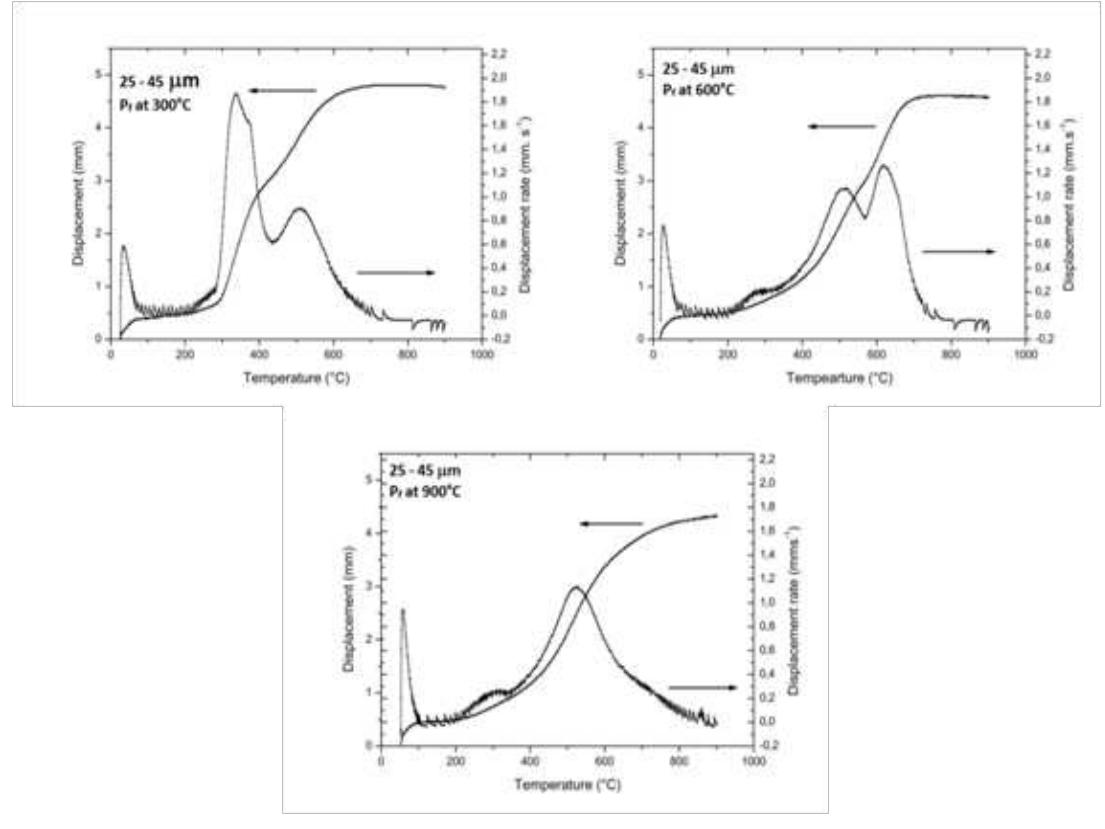
Figure 16: Displacement and displacement rate versus temperature of the 25-45 um powder sintered applying pressure at 300, 600 and 900°C At 300°C, the application of Ps causes a sharp densification rate peak but, despite of
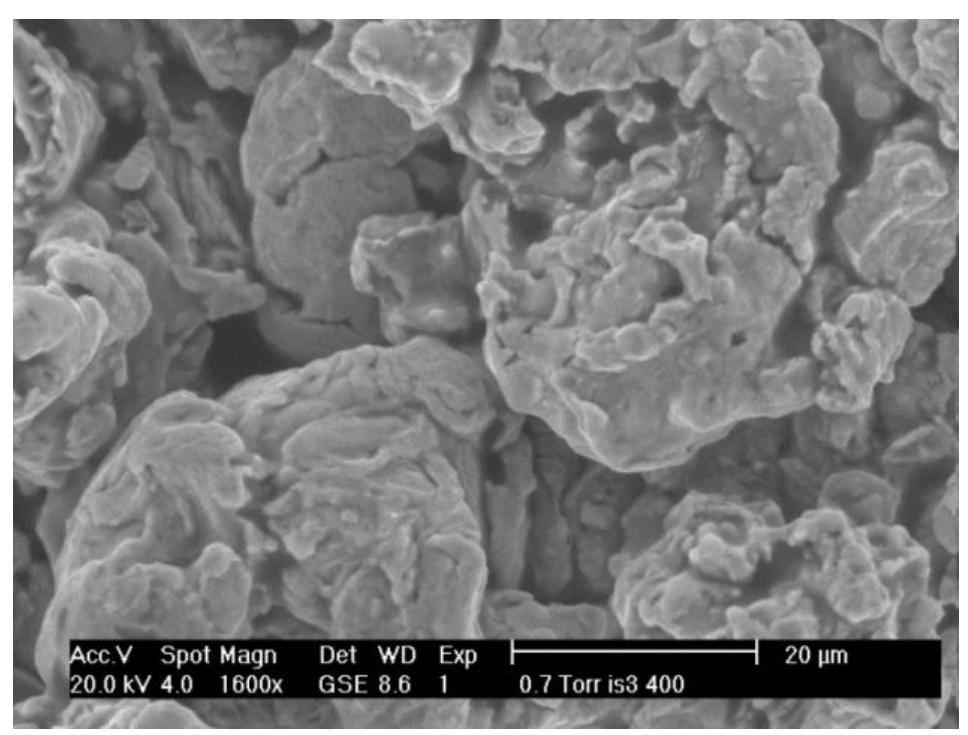
Figure 17: fracture surface of the 400°C sintered specimen applying pressure Pf at 300°C
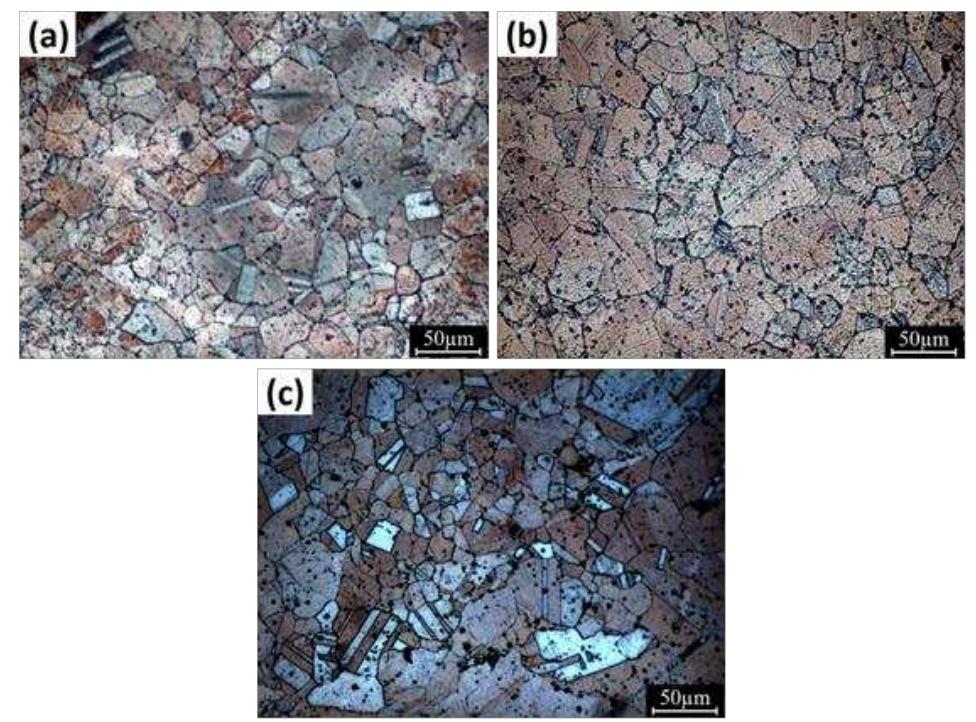
Figure 18: Microstructure of the sintered 25 - 45 um powder applying pressure at (a) 300°C, (b) 600°C, and (c) 900°C
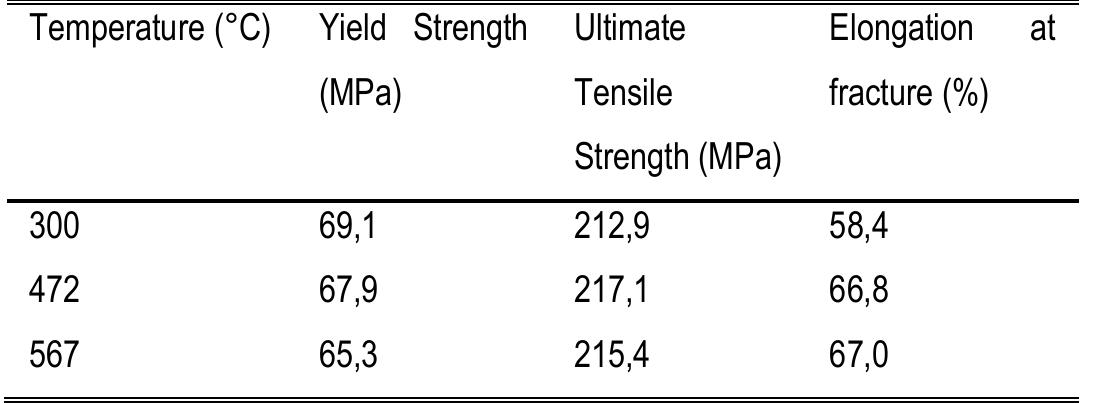
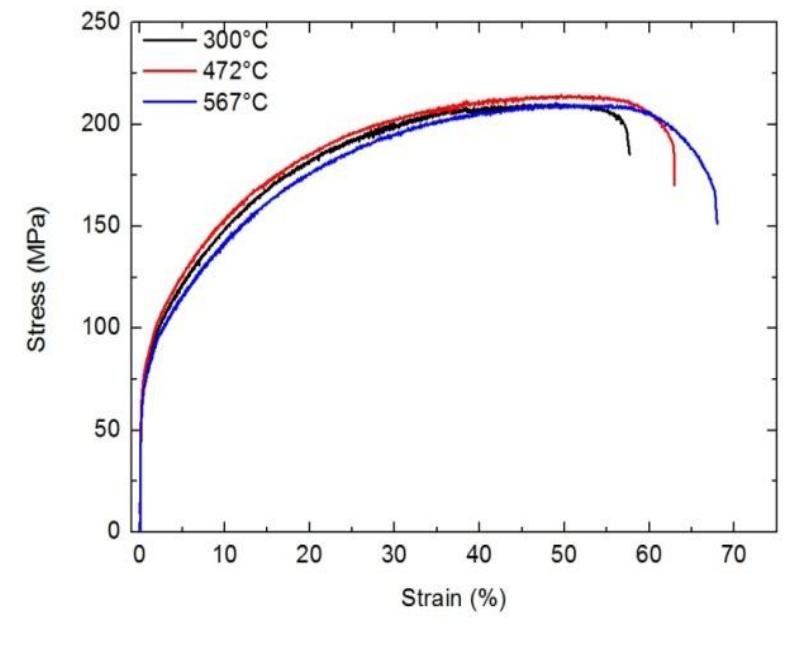
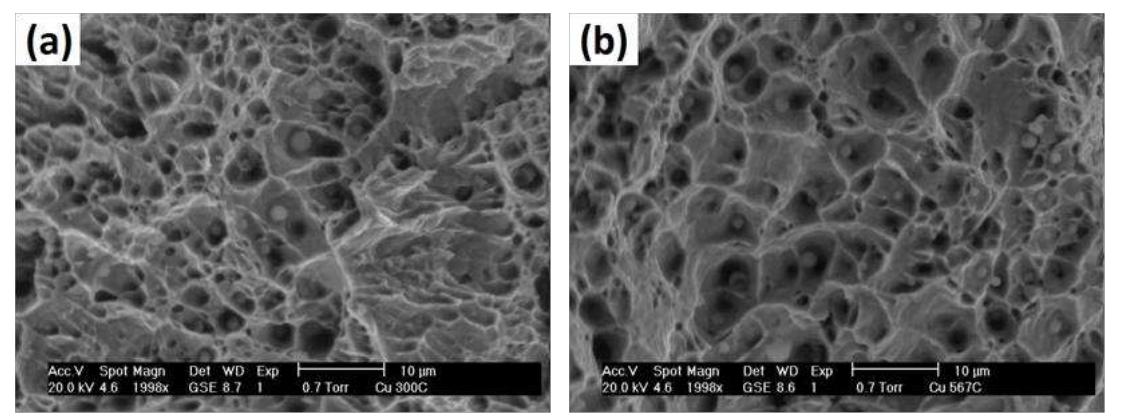
Figure 20: Fracture surface of the specimens sintered applying Py at (a) 300°C and (b) 567°C
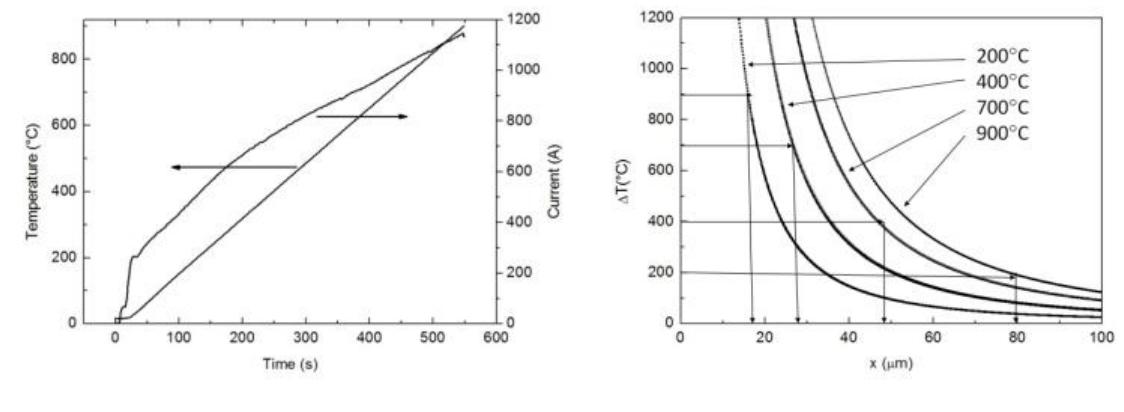
Figure 21: current intensity and nominal temperature vs time and overheating meahine at Aifarant naminal damnnarnatiircanc The thickness of the layer which overcomes the melting temperature of copper is
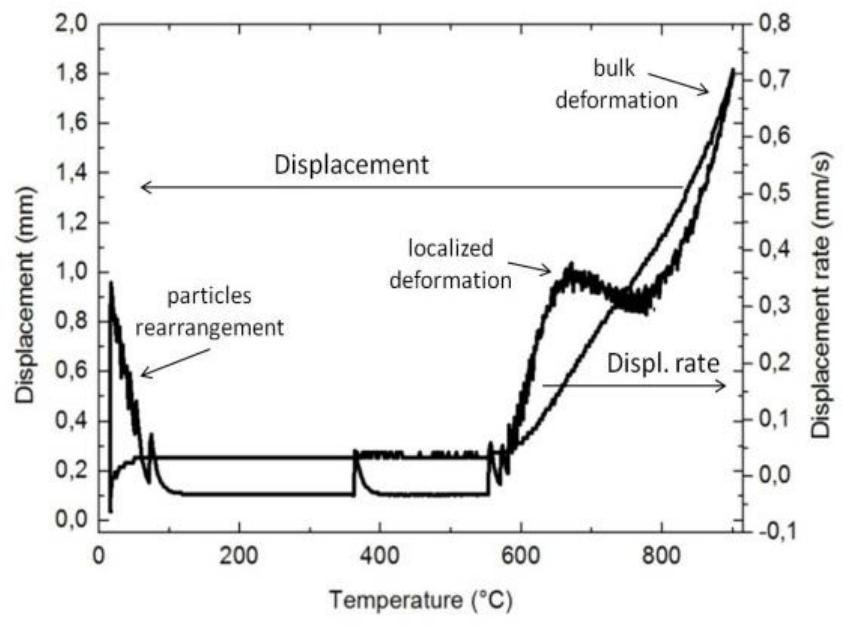
Figure 22: Displacement and displacement rate of the lower punch vs. nominal temperature
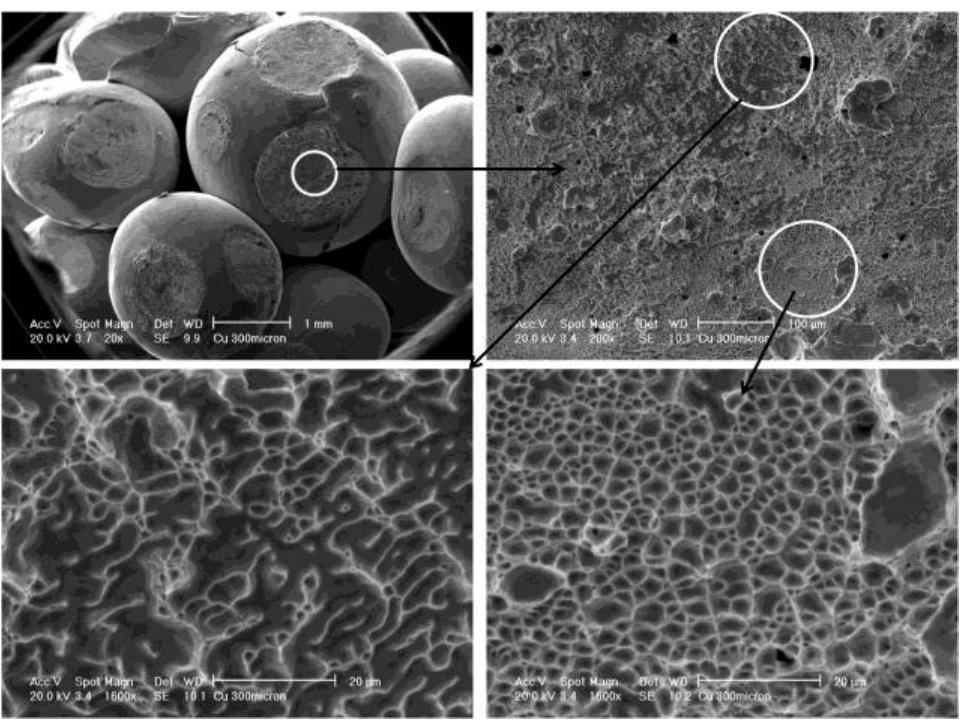
Figure 23: fracture surface of the specimen sintered at the nominal temperature of 900°C
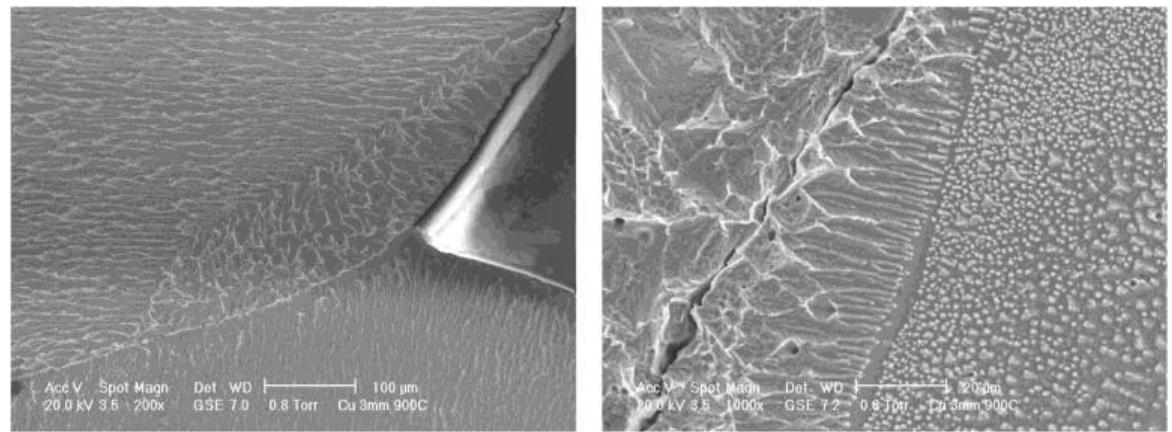
micrograph). In the right side image, equiaxed grains are located at the grain
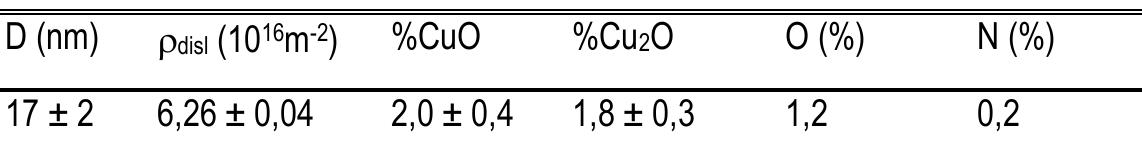
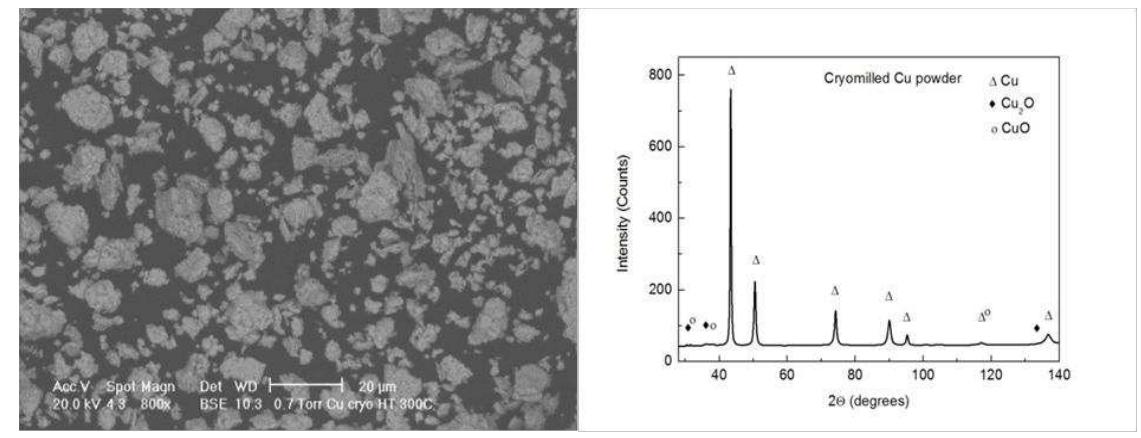
Figure 25: Morphology and XRD pattern of the cryomilled copper powder
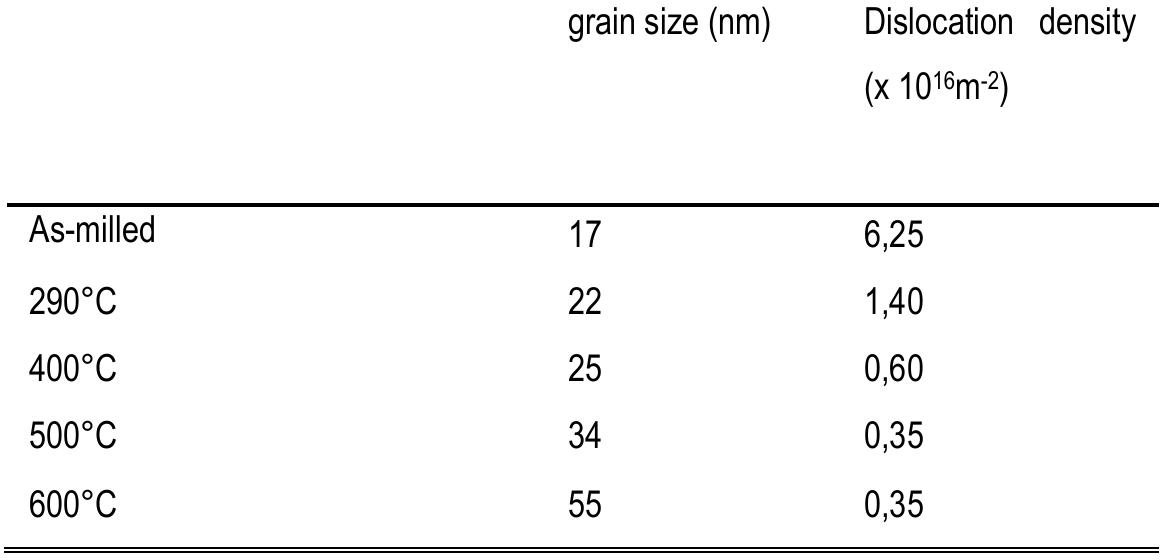
Table 7: Grain size and dislocation density of the as-milled copper before and after 2h
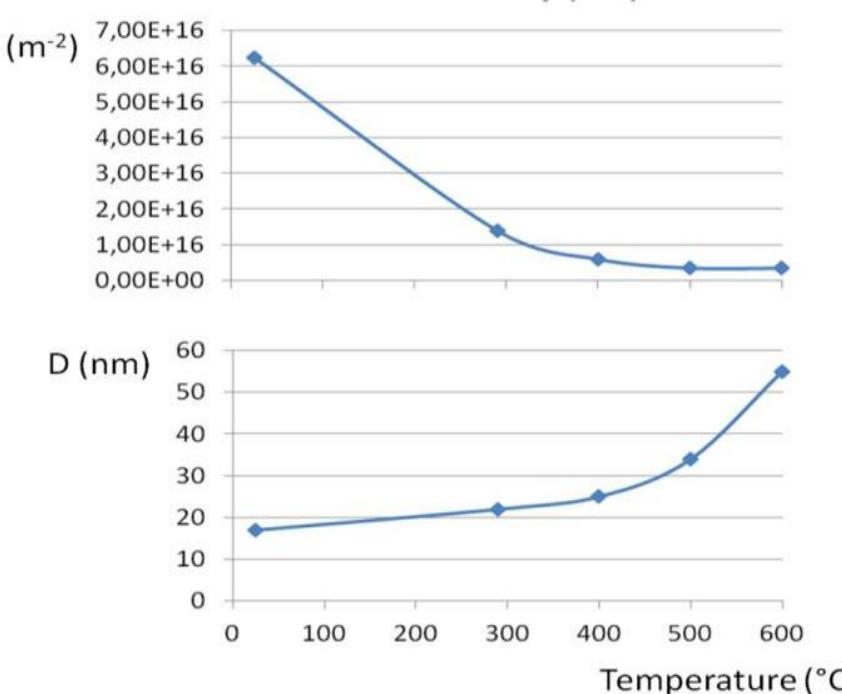
Figure 26: dislocation density and grain size of cryomilled powder vs. temperature
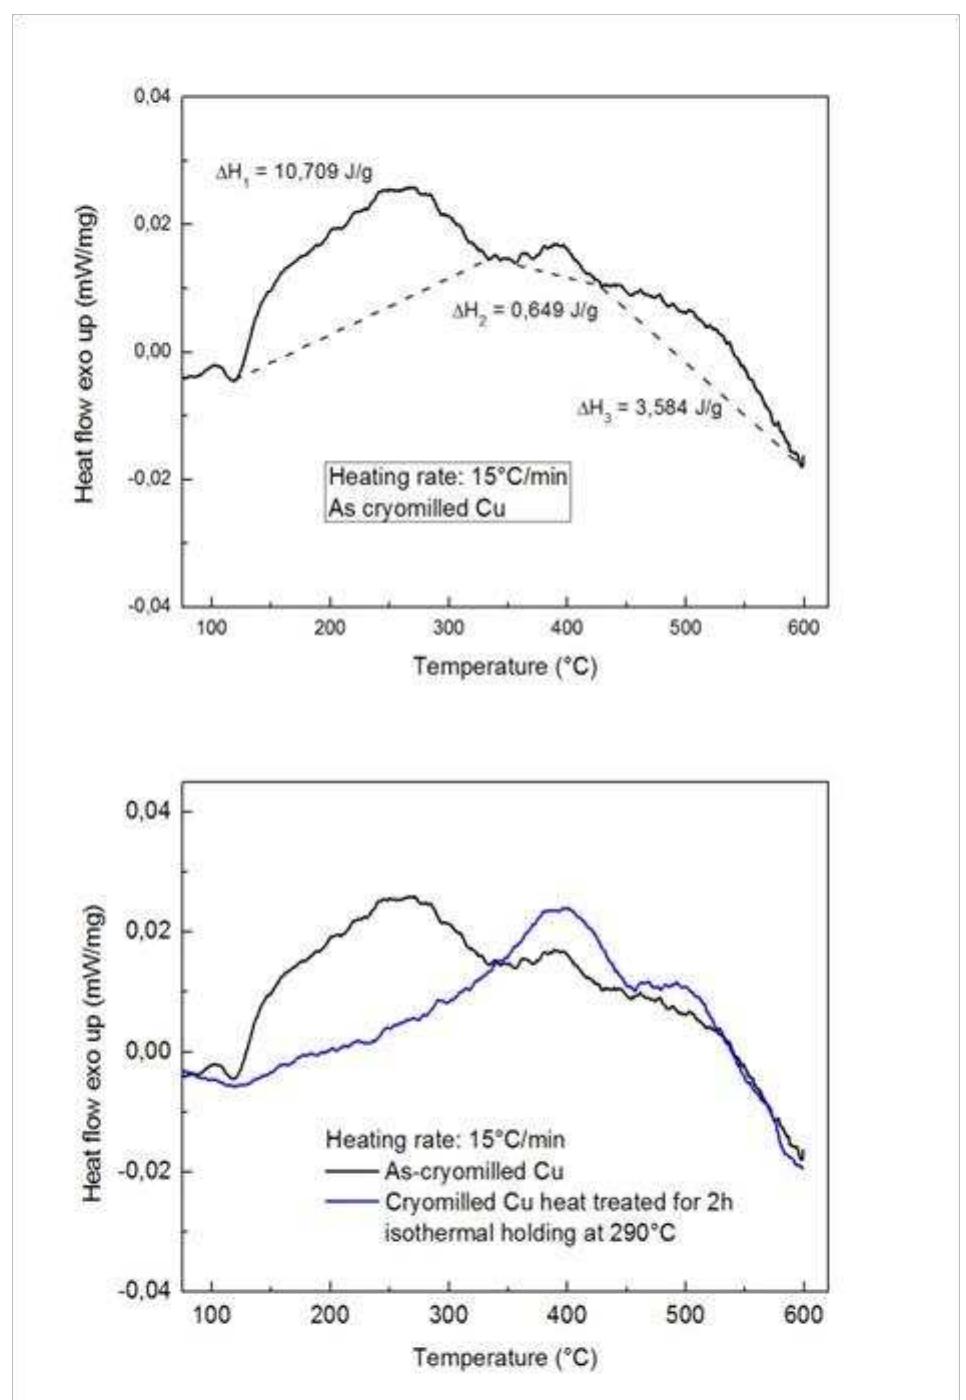
Figure 27: DSC of the cryomilled Cu before and after a heat treatment for 2h isothermal holding at 290°C using a heating rate of 15°C/min -igure 27: DSC of the cryomilled Cu before and after a heat treatment for 2h
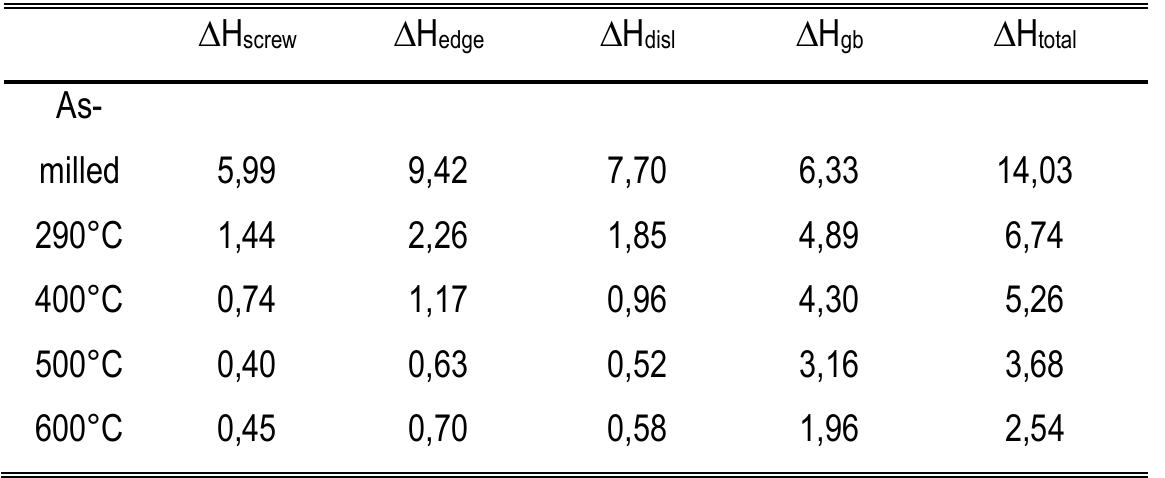
There is some discrepancy beween enthalpy measured by DSC and the released Table 8: Energy stored by dislocations and grain boundary (J/g) energy calculated from the grain size and the dislocation density at the various
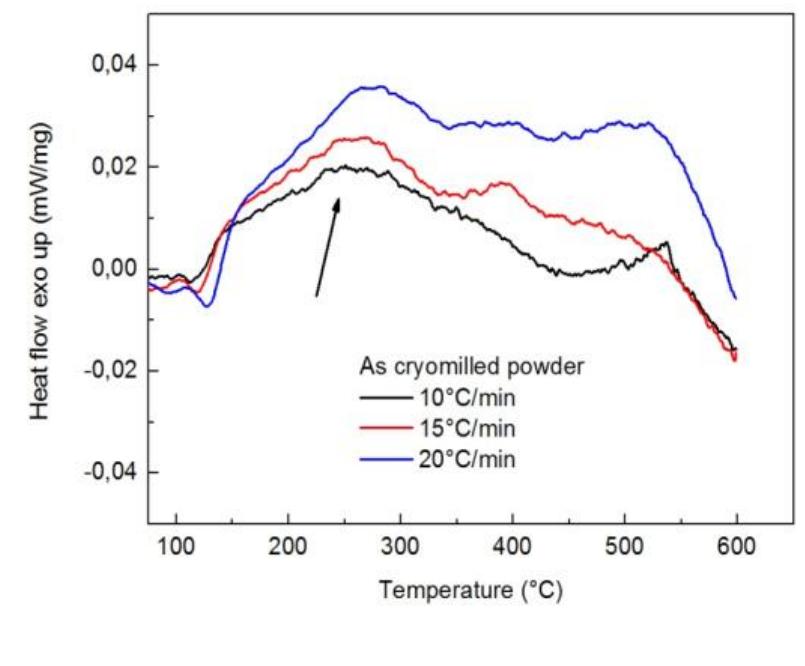
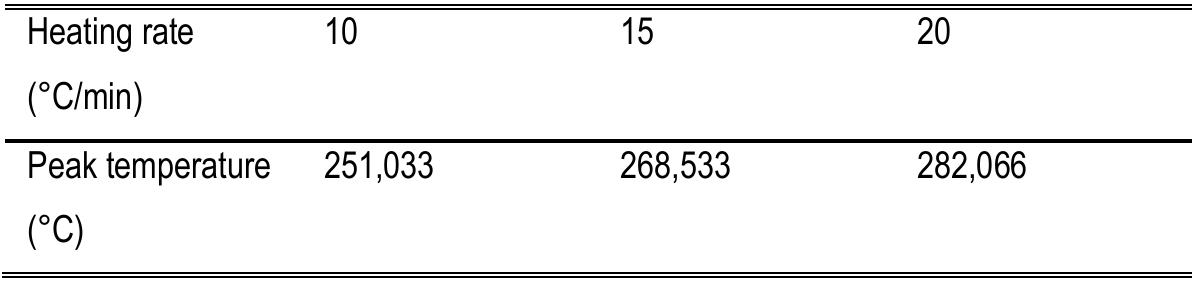
The plot of In(B/Tp2) versus 1/Tp shown in Figure 29, gives a straight line from the slope of which is derived the activation energy which is calculated to be 6,28 kJ/mol The plot of In(B/Tp2) versus 1/Tp shown in Figure 29, gives a straight line from the rates (10, 15 and 20°C/min) shown in Figure 28
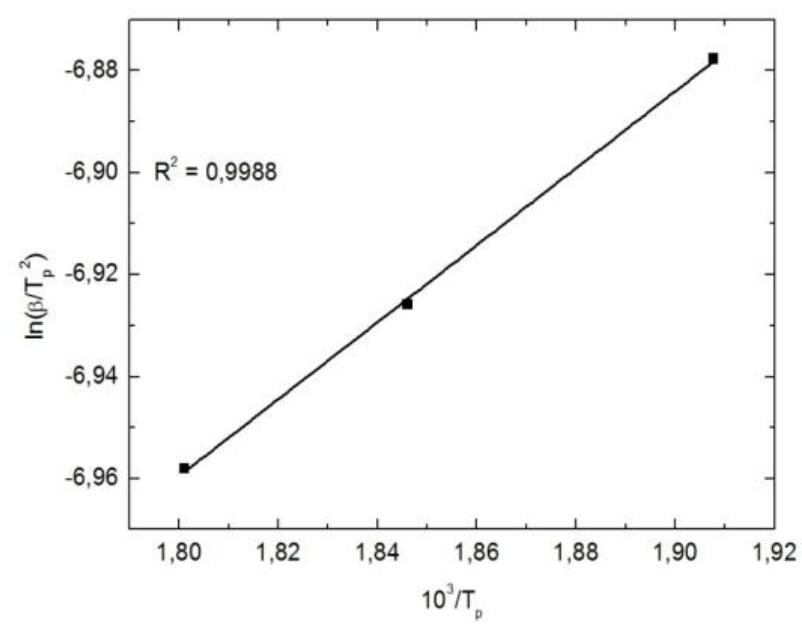
Figure 29: Kissinger plot of the values of In(B/Tp2) as a function of 1/Tp calculated from Table 9
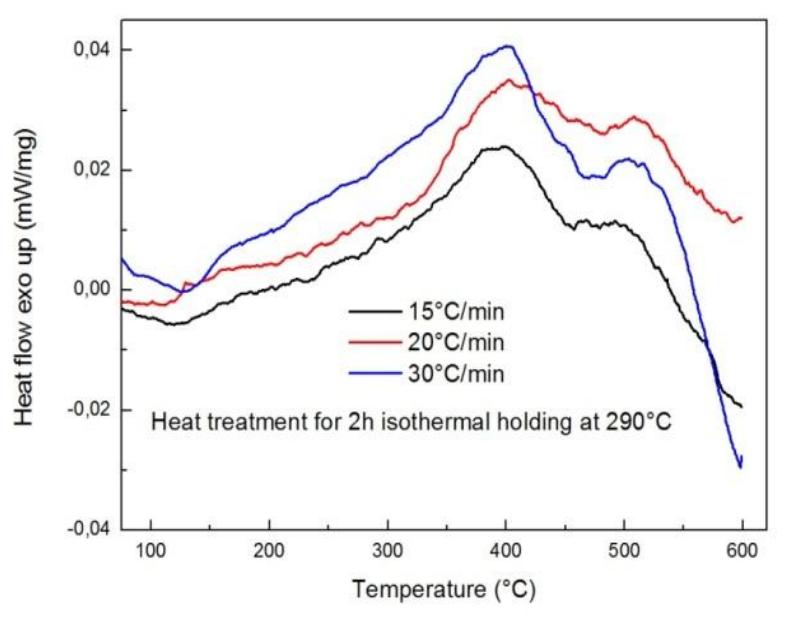
-igure 30: Variation of the exothermic DSC curves of the cryomilled copper after
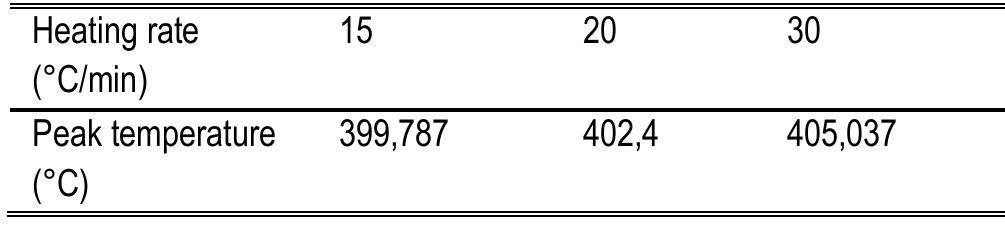
Table 10: Values of the peak temperature of the cryomilled copper at different heating rates (15, 20 and 30°C/min) after 2h isothermal annealing at 290°C of the DSC curves in Figure 31
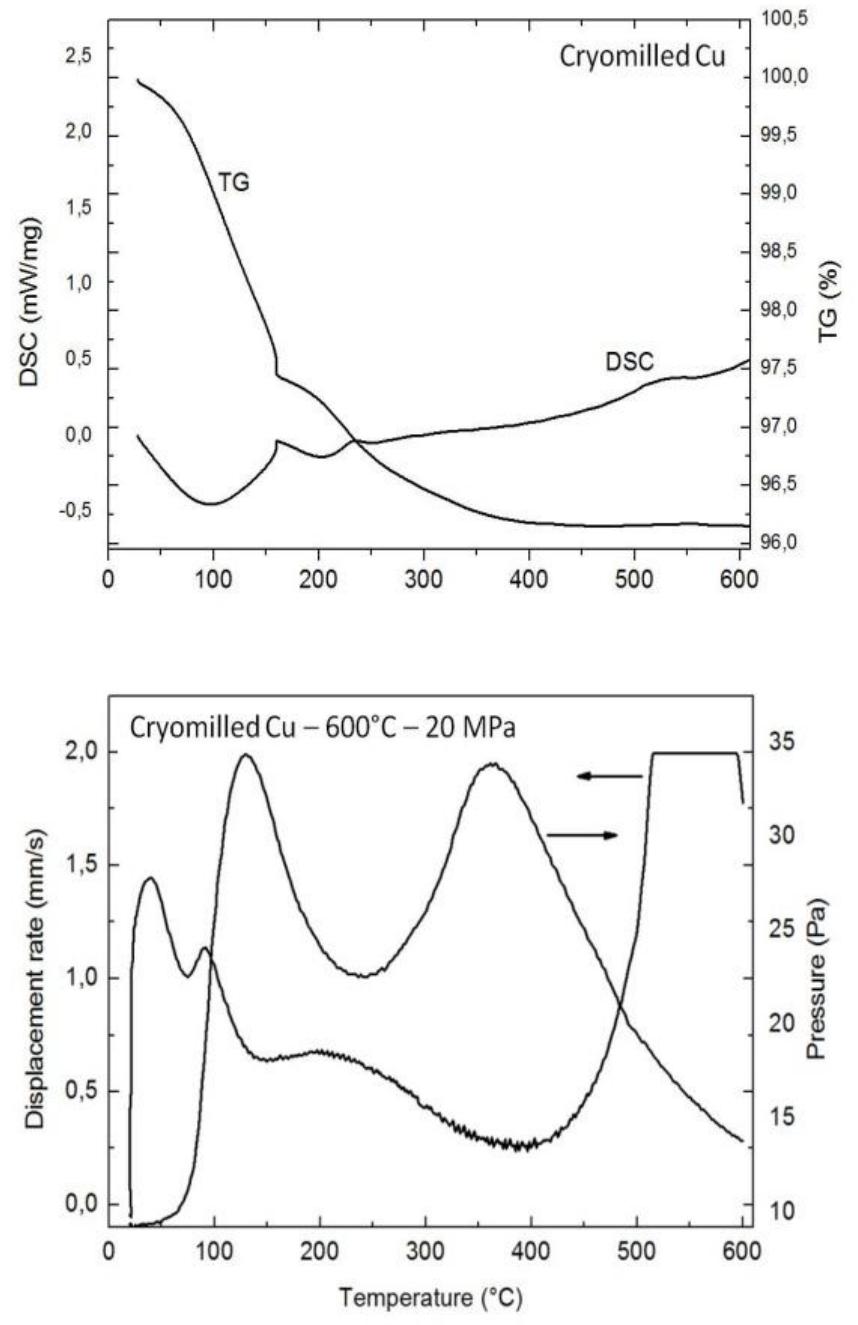
Figure 31: Degassing curves in TGA-DSC and effect on the SPS chamber pressure A sharp mass loss occurs up to 400°C, to which two exothermic effects are
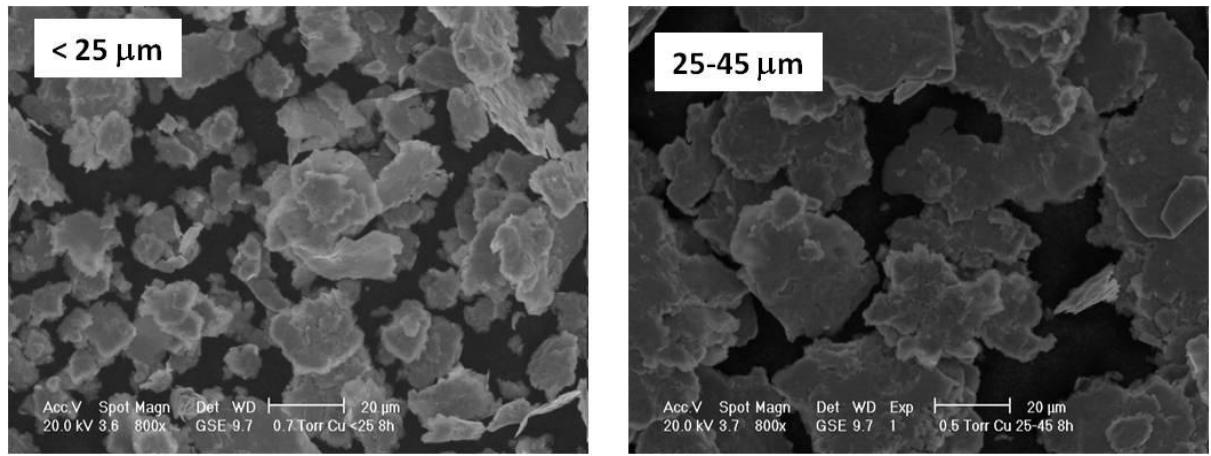
Figure 32: morphology of the cryomilled powder final stage of milling. insufficient milling time. It is well known in fact that particle size gets rounded in the The particles which are shown in Figure 32, have a flake-like morphology, due to the
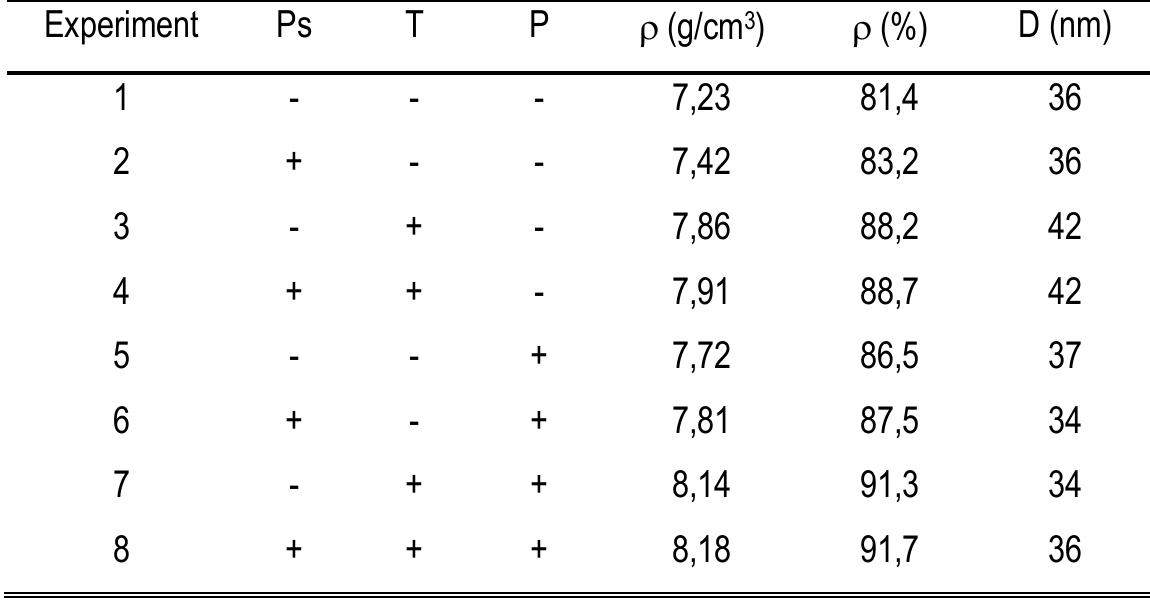
Full density was not obtained in the sintering conditions utilized. On the other side, Table 11: Density and crystallite size of the sintered DOE specimens
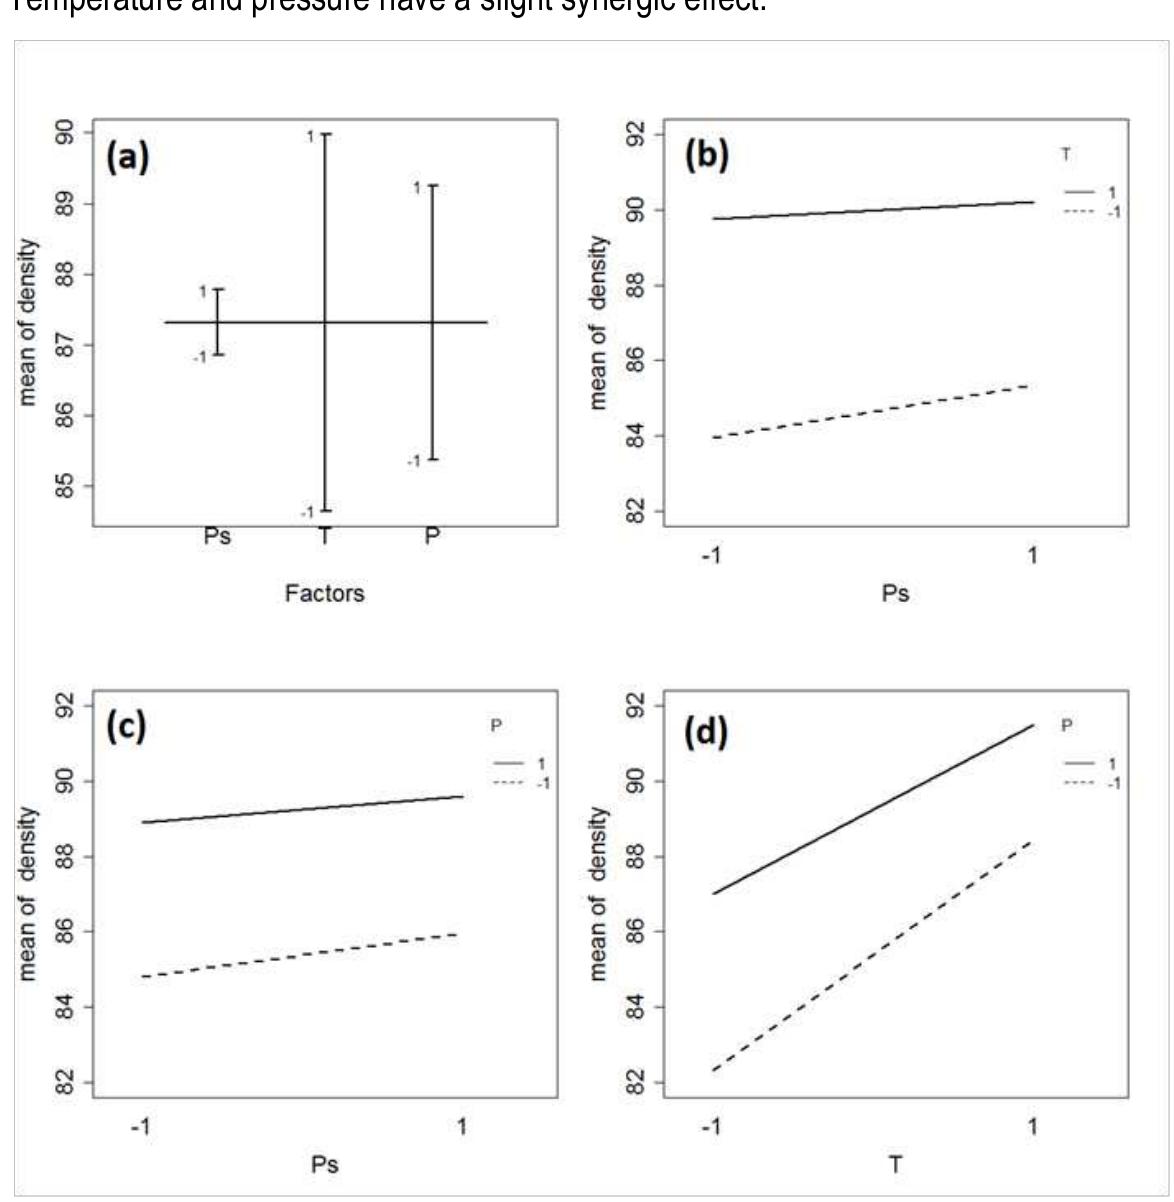
Figure 33: Main and interaction plots of particle size, temperature and pressure on density temperature from low to high level, density performs better at low pressure leve when increased at low temperature level. On the other side, on increasing
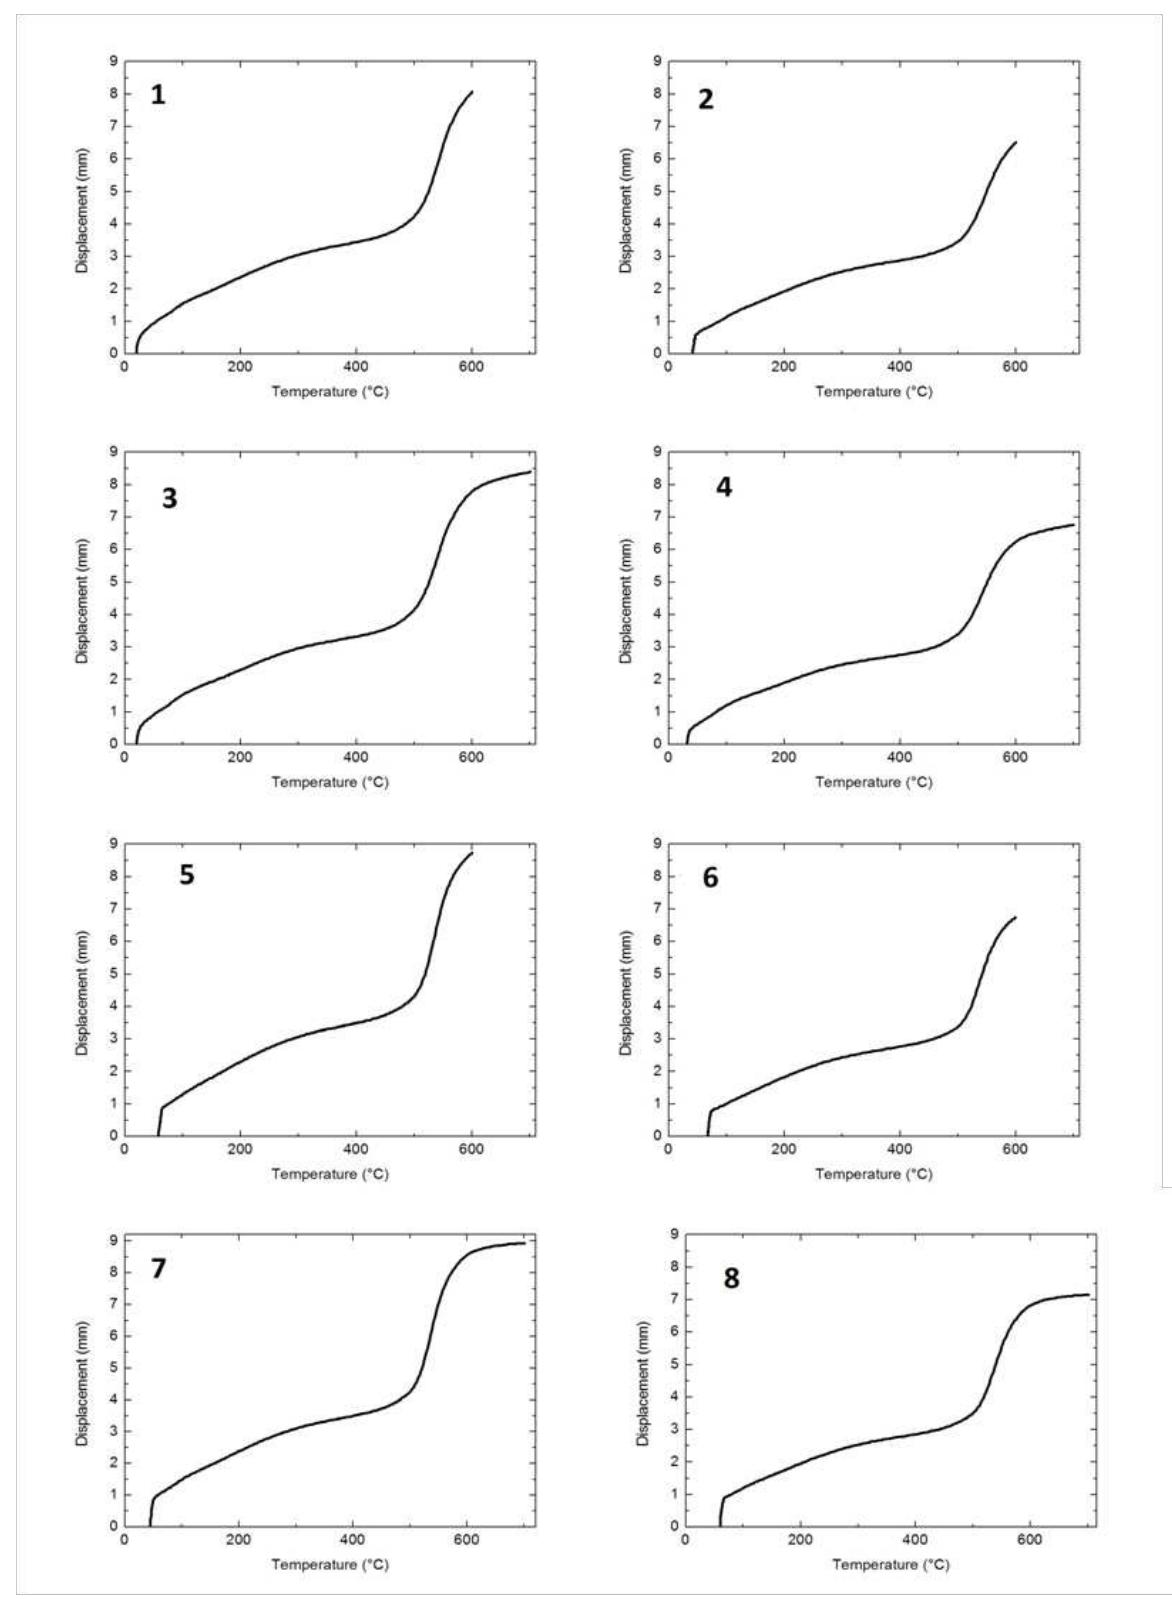
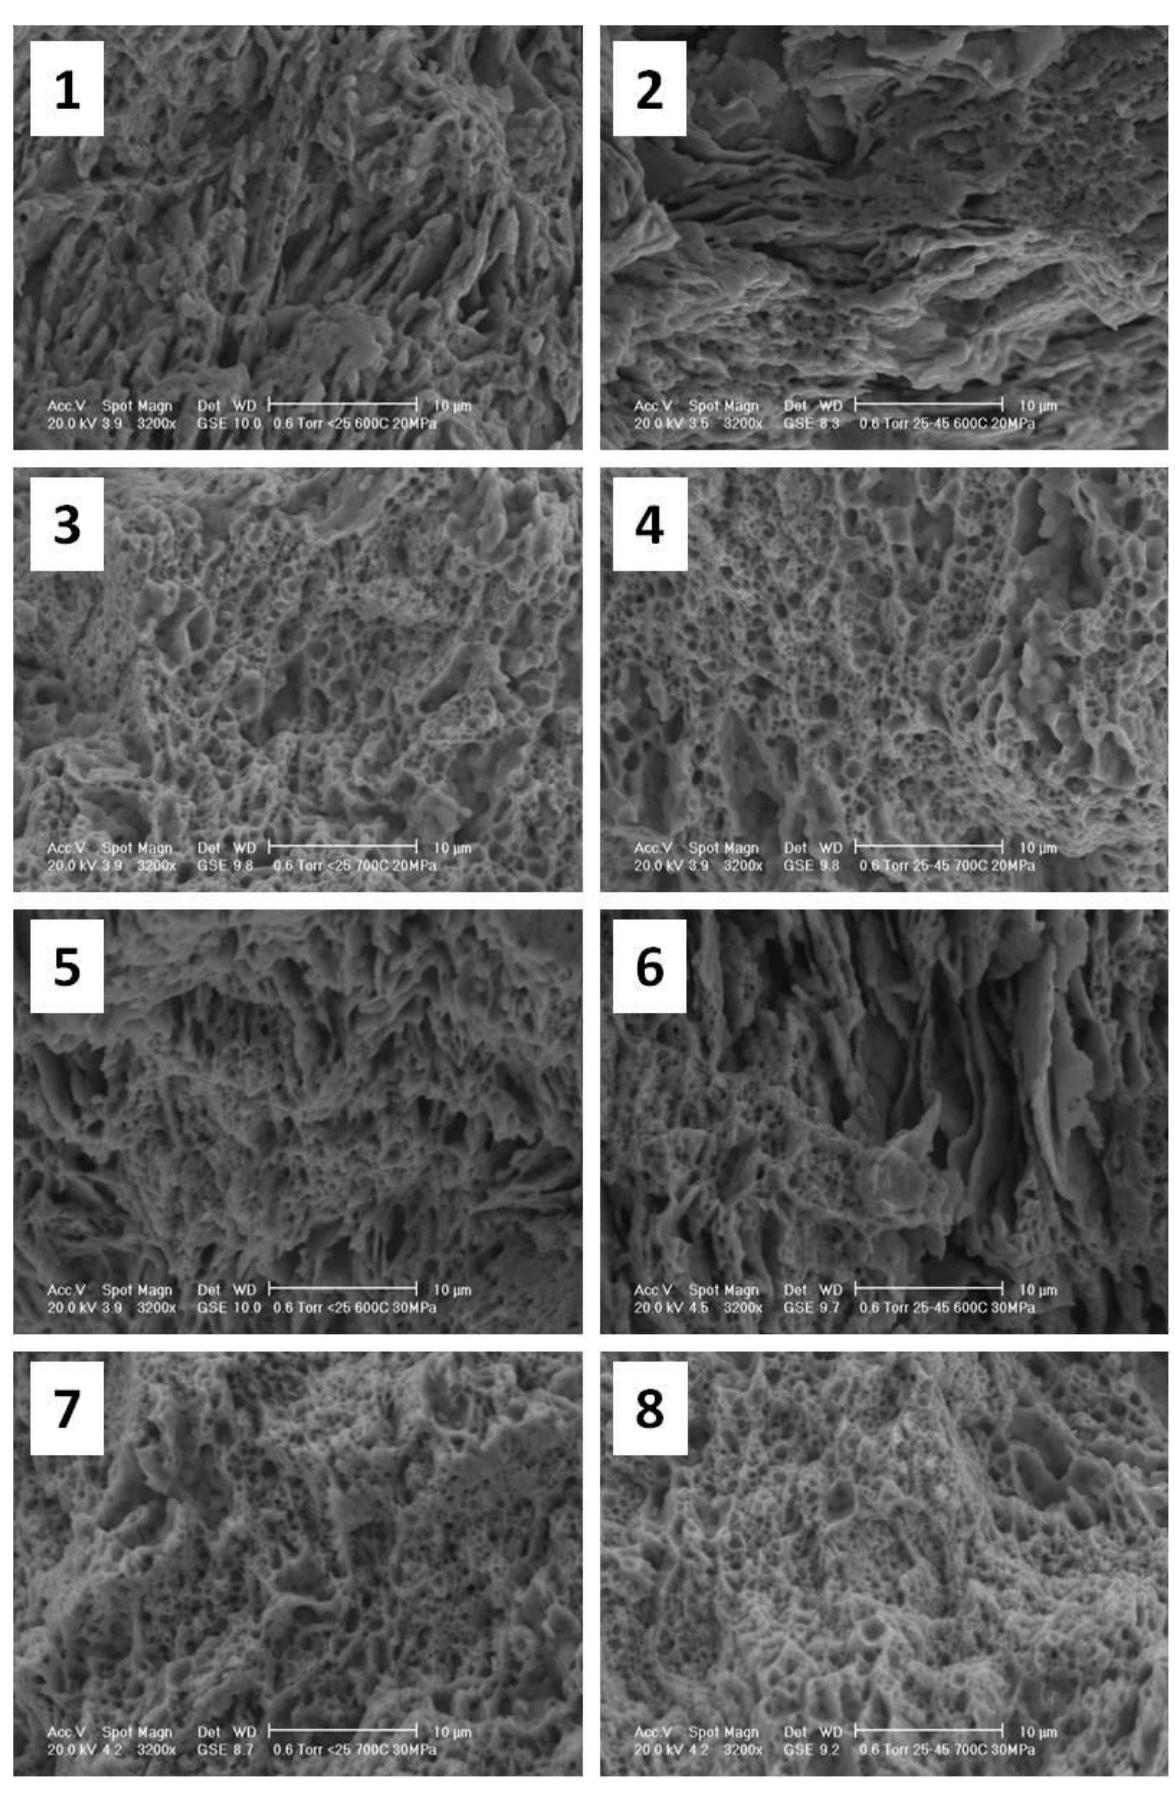
Figure 35: fracture surfaces of the sintered specimens (label refers to codes in tab.
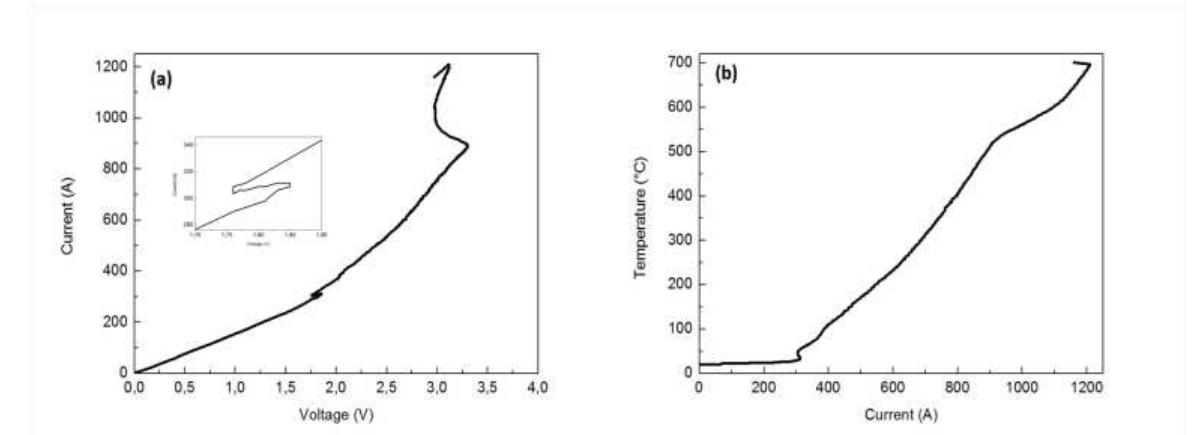
Figure 36: (a) current versus voltage and temperature versus current (b) record: during SPS of cryomilled powder
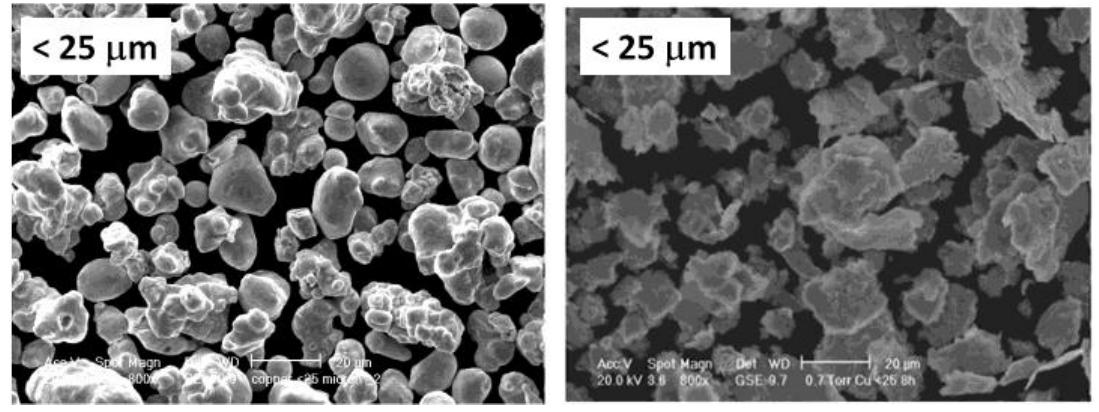
Figure 37: the atomized and the cryomilled powder (particle size below 25 jum) atomized powders whilst the latter has a flake-like morphology. Figure 38 shows the atomized and the cryomilled powders with the same
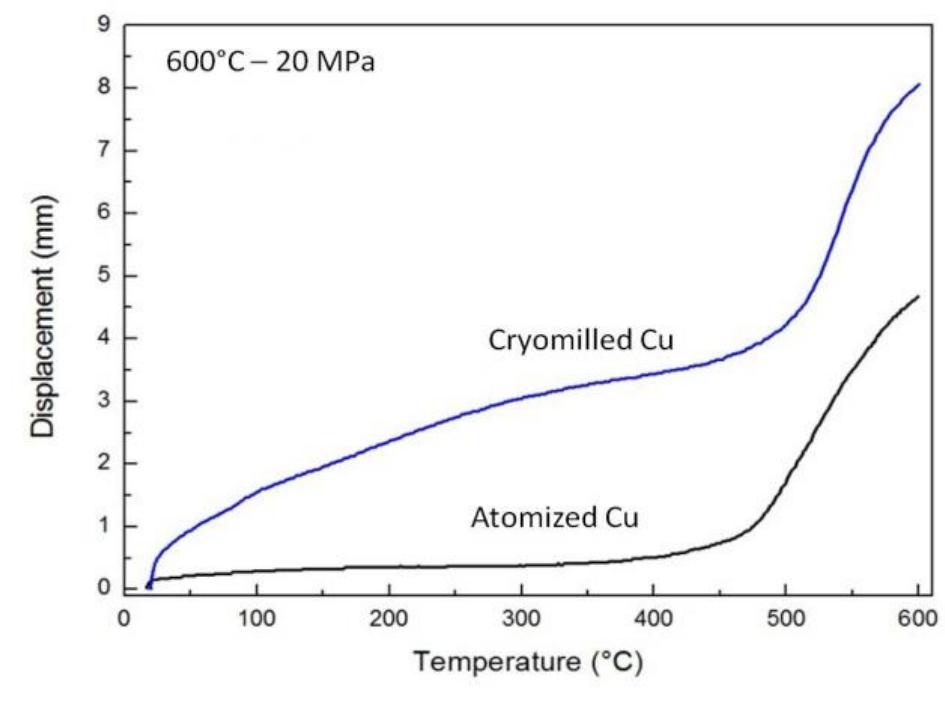
Figure 38: Displacement curve of the cryomilled and of the atomized powder
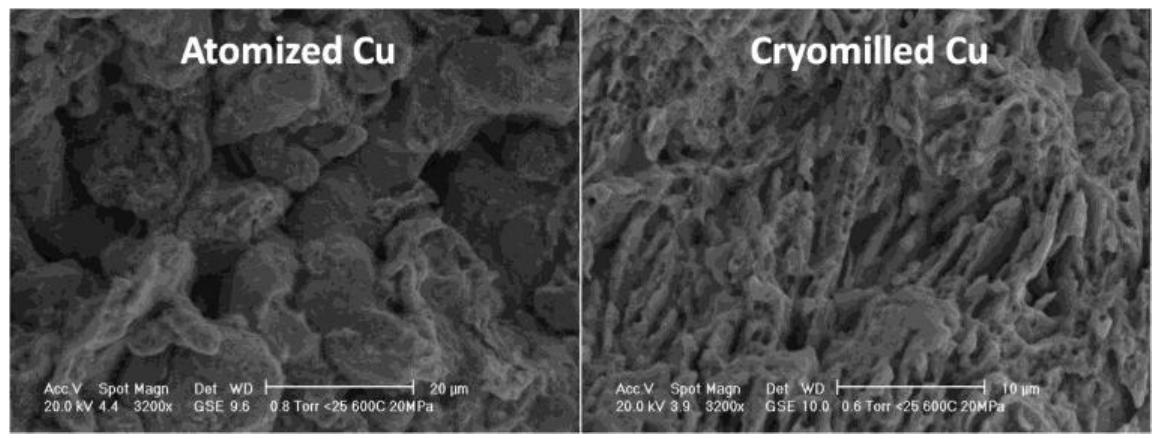
Figure 39: fracture surface of the atomized and the cryomilled specimens, sintered a 600°C
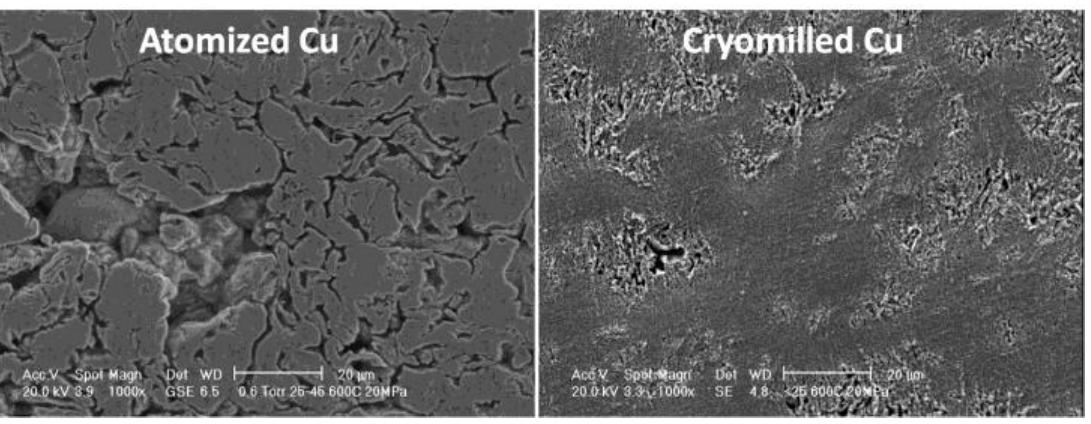
Figure 40: microstructure of the atomized and the cryomilled specimens sintered at 600°C.
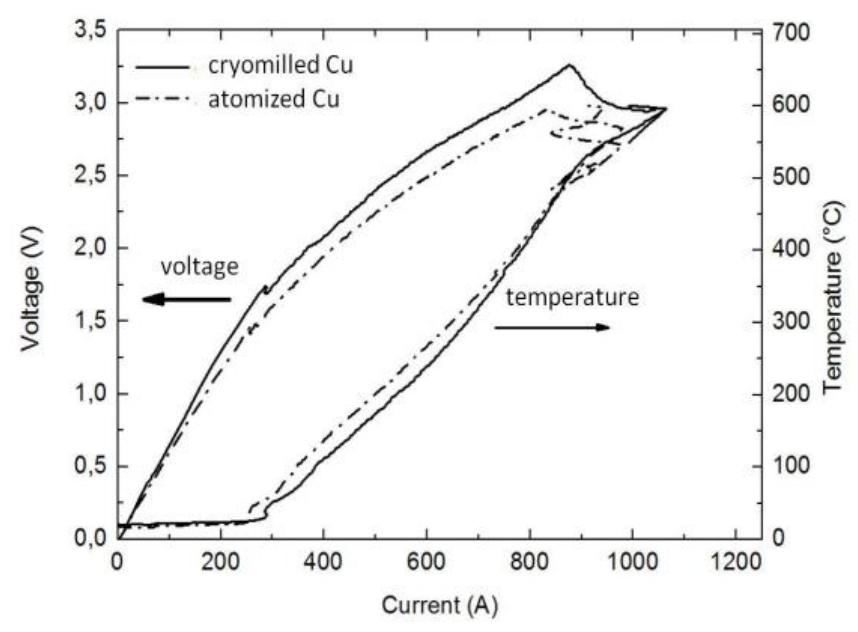
Figure 41: voltage and temperature vs. current -igure 42 shows, as an example, the overheating profile calculated at a nominal
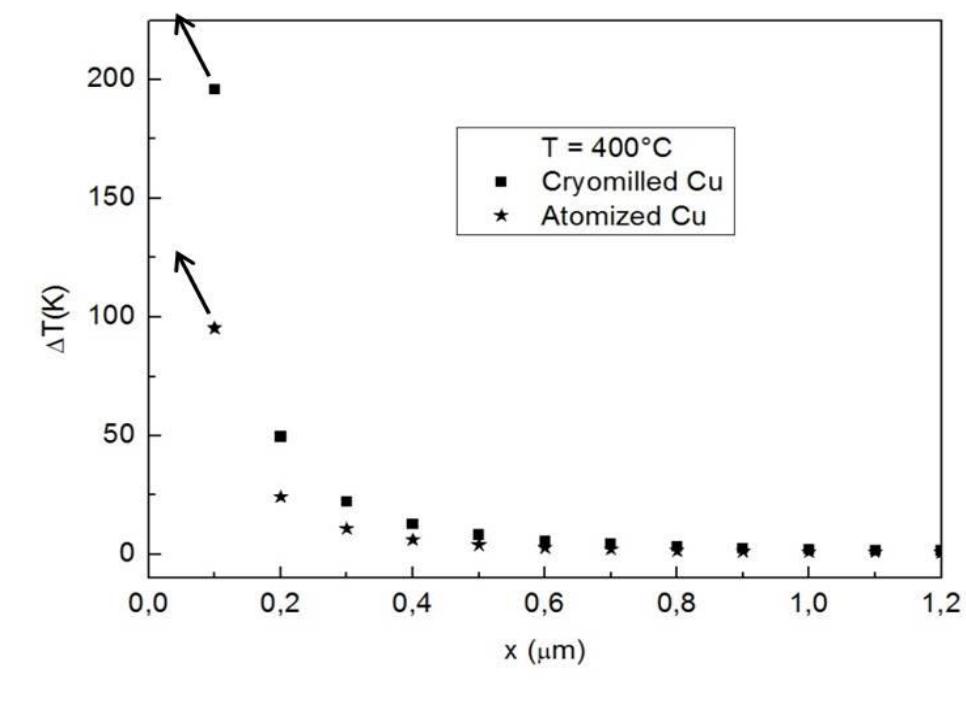
Figure 42: overheating profile in the two specimens
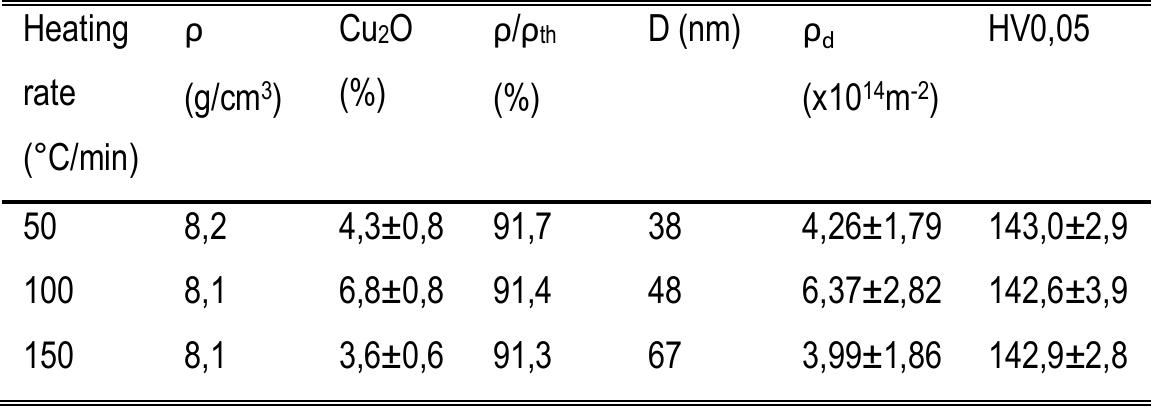
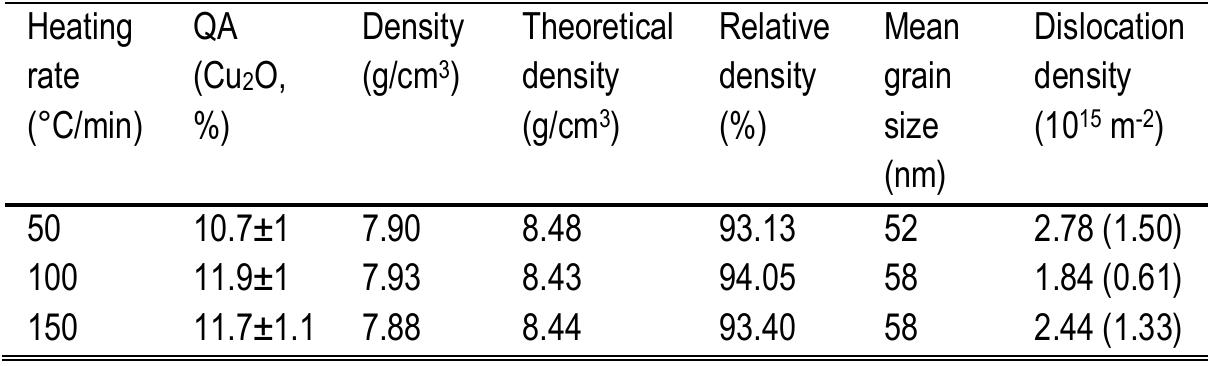
Density and dislocation density do not change with heating rate (differences between the mean values of dislocation density are smaller than the scatter band) whereas crystallite size is definitely affected by heating rate. The mean crystallite size Table 12: Measured density, calculated theoretical density, relative density,
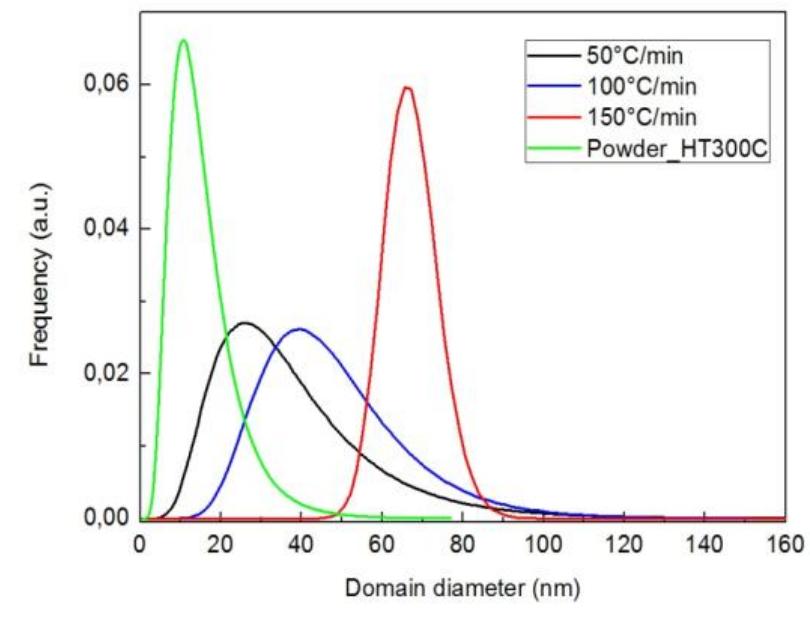
Figure 43: Domain size distribution of the heat treated powder at 300°C and of the specimens sintered with different heating rates: 50, 100 and 150°C/min applying only tha initial nracciira Figure 43: Domain size distribution of the heat treated powder at 300°C and of the The crystallite size distribution shifts to high values as the heating rate is rised and
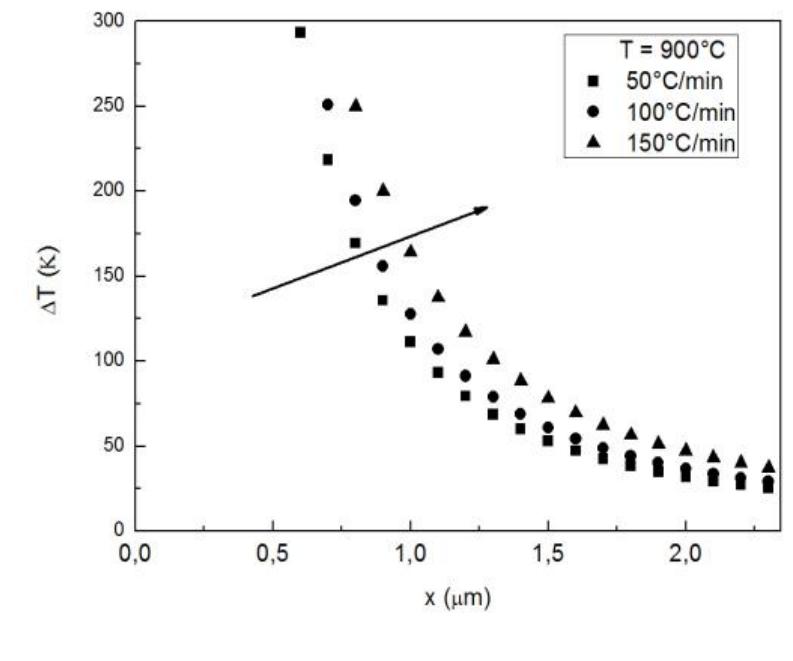
Figure 44: Effect of heating rate on the overheating profile
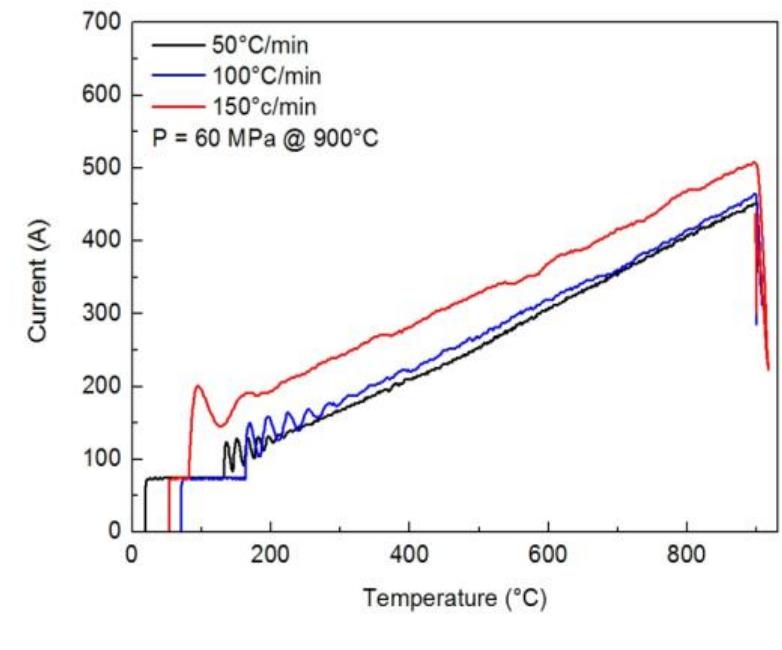
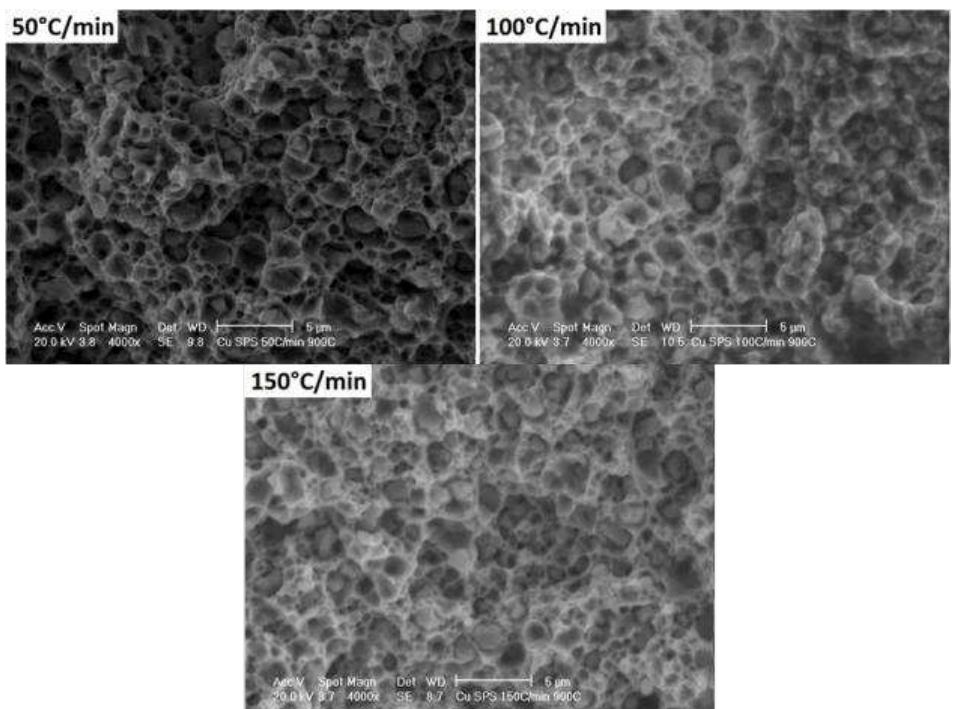
Figure 46: fracture surface analysis of specimens sintered with different heating rate
the sintered material produced using heating rates (HR) of 50, 100 and 150°C/min The amount of oxide in the sintered specimens is higher than in the previous case;
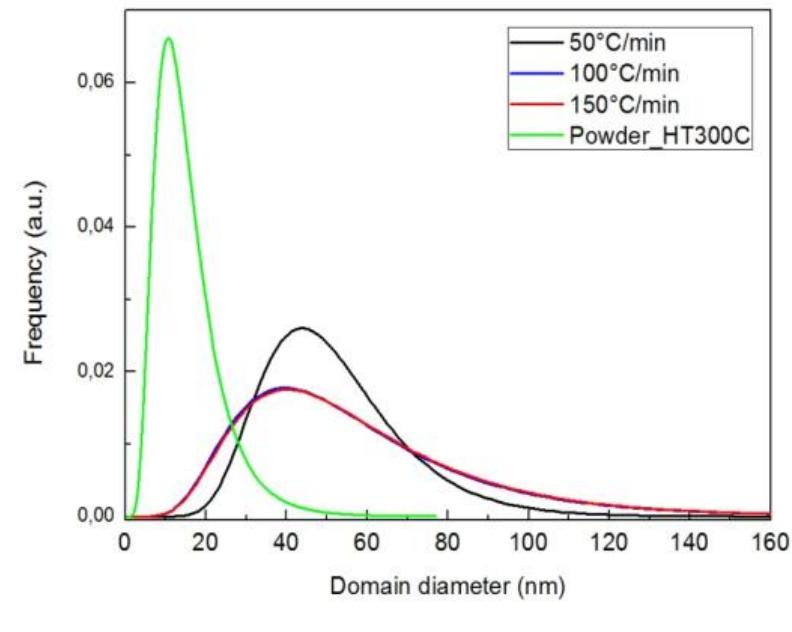
Figure 47: Domain size distribution of the heat treated powder at 300°C and of the specimens obtained using different heating rates: 50, 100 and 150°C/min applying Kscthe 33a Ak eS AW esa. Figure 47: Domain size distribution of the heat treated powder at 300°C and of the
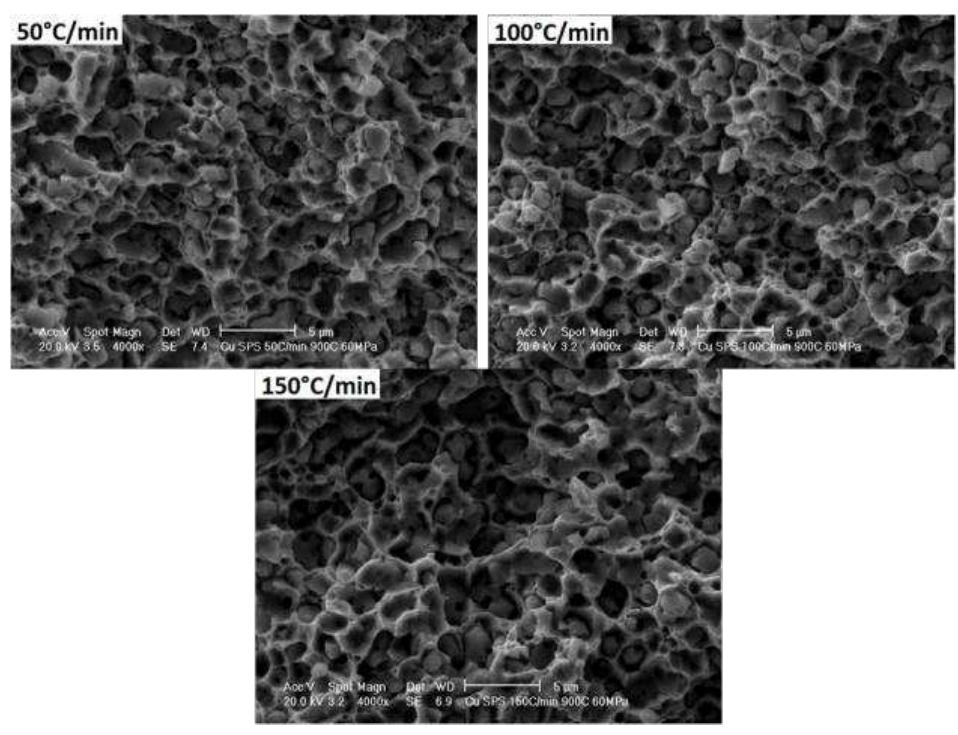
Figure 48: Effect of heating rate with a previous degassing and applying both initial
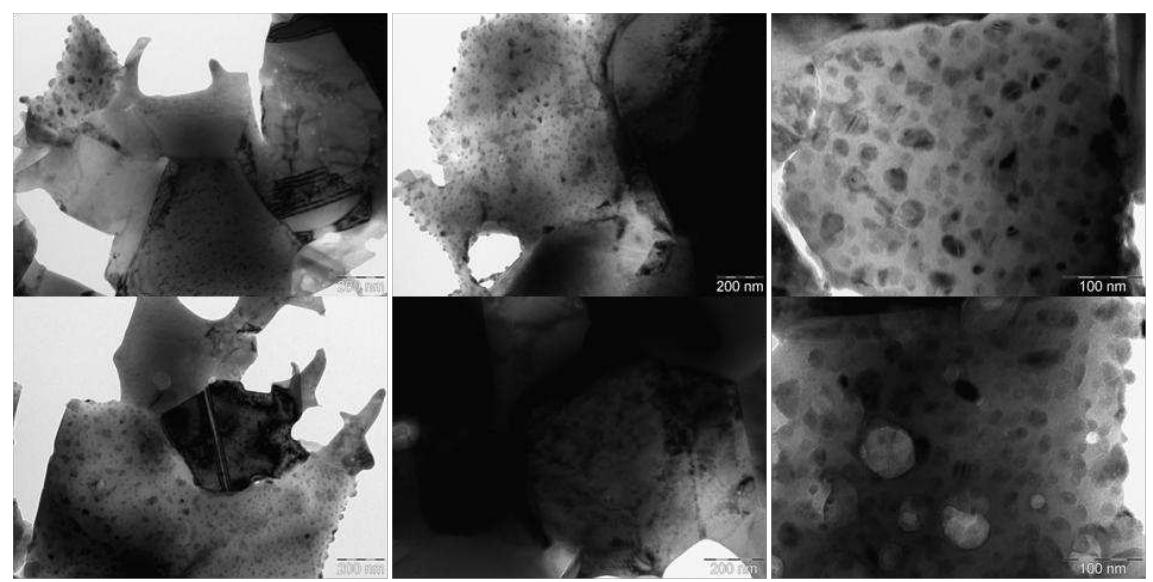
Figure 49: TEM images of the specimen obtained using a heating rate of 50°C/mi and a holding time of 2 min at 900°C
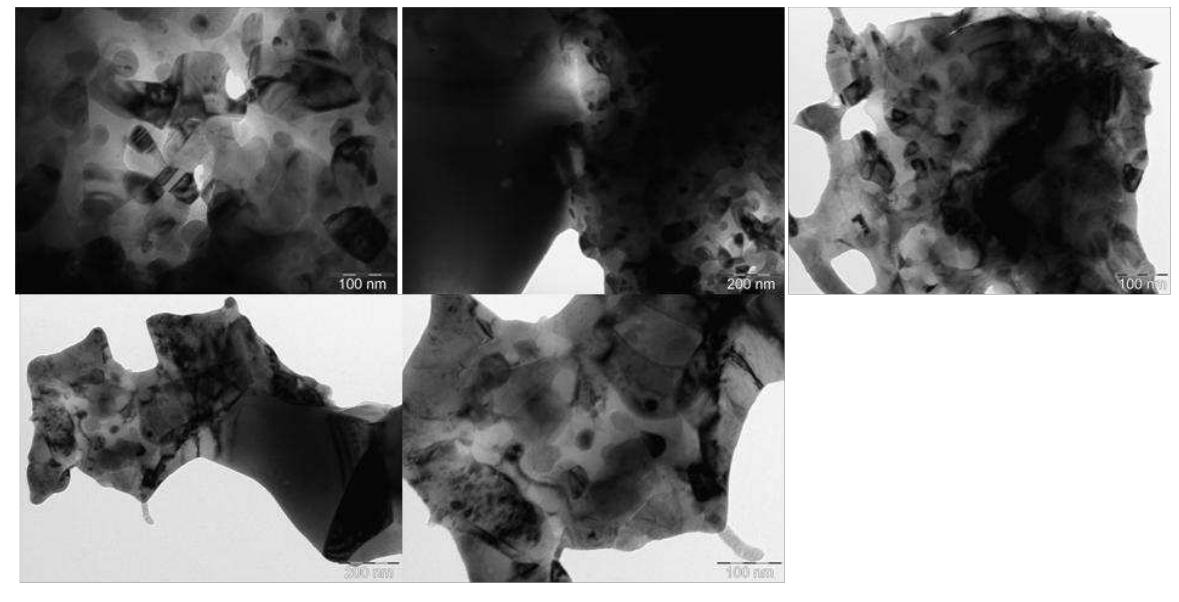
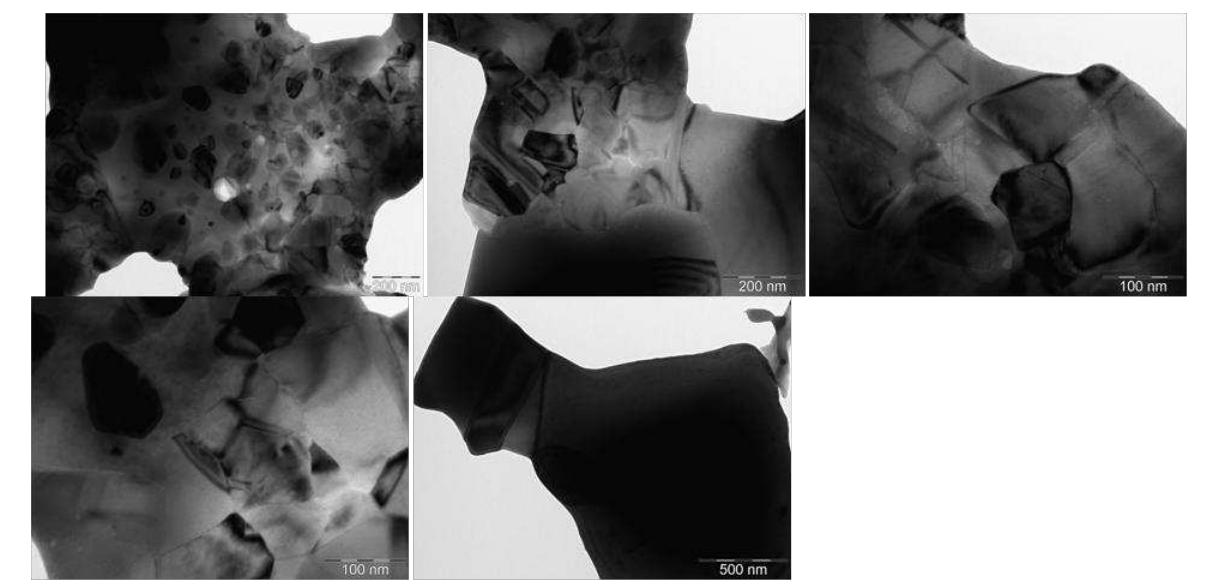
Figure 51: TEM images of the specimen obtained using a heating rate of 150°C/min and a 2 min holding time at 900°C
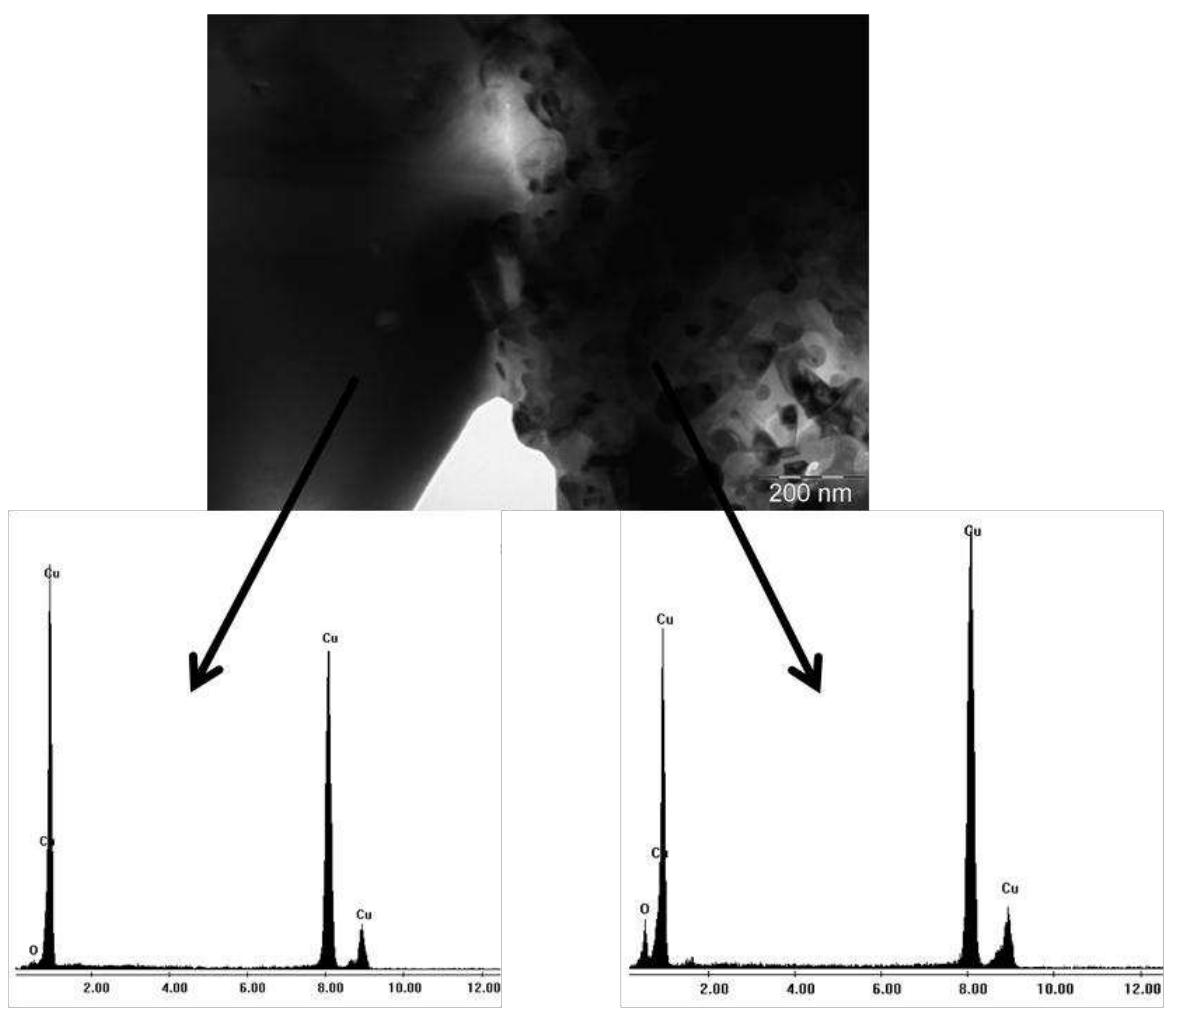
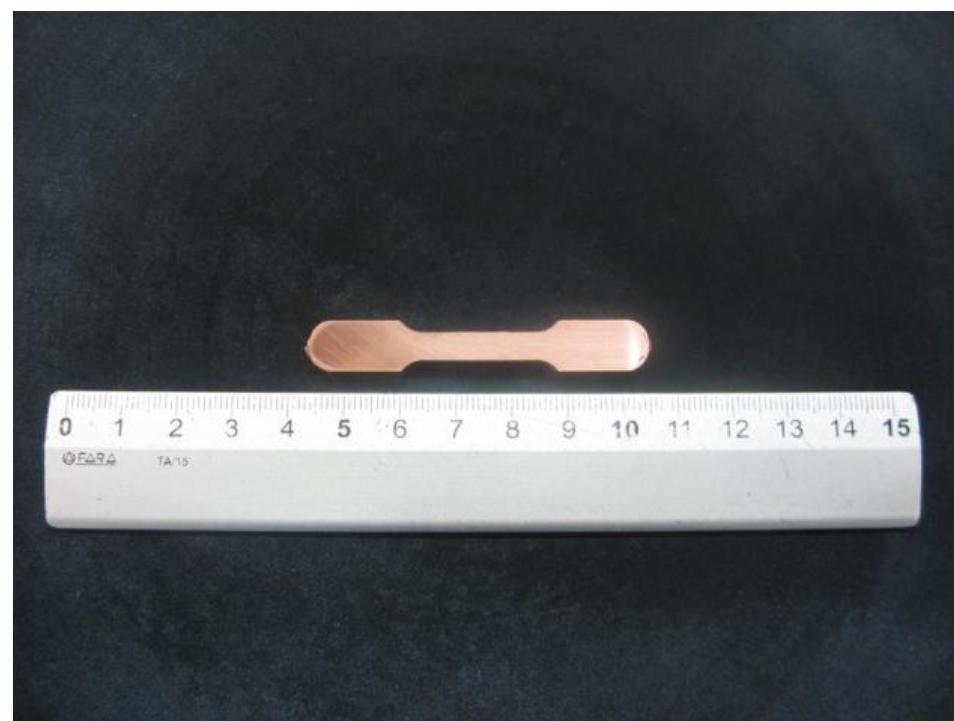
Figura 53: Tensile specimen used for the tensile tests The specimens were produced with a 50°C/min heating rate and the holding time
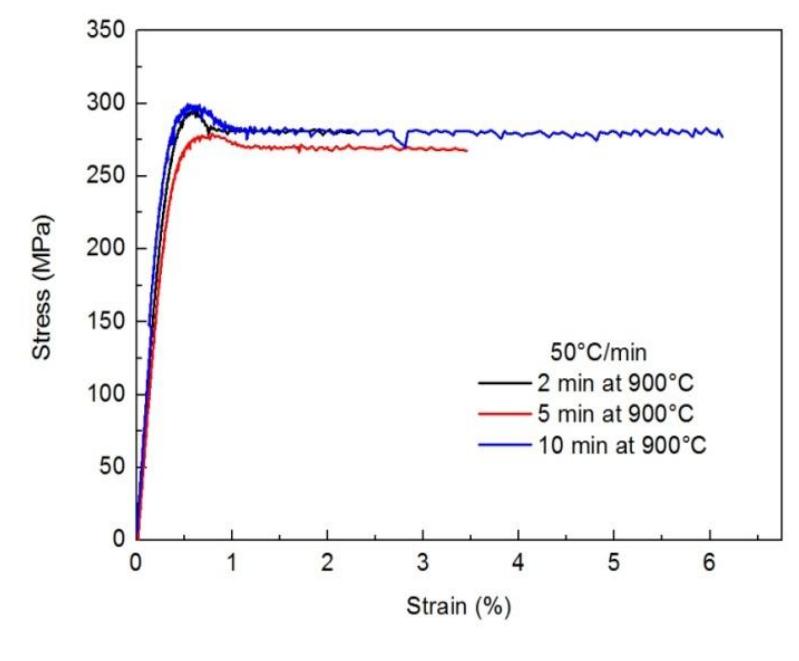
Figura 54: Tensile stress-strain curves of the sintered cryomilled copper at 50°C/min: effect of holding time
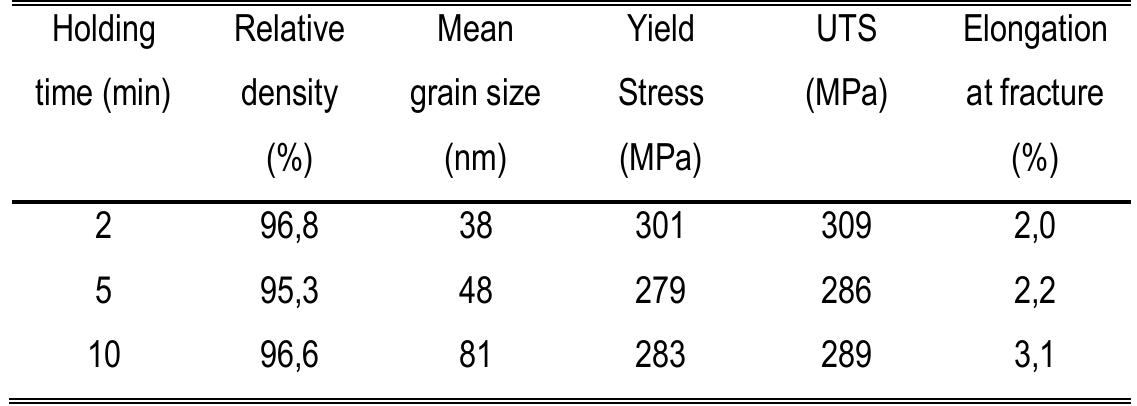
The variation of density with holding time has a poor meaning, being comparable Tabella 14: Density, grain size and tensile properties as a function of holding time at with the scatter of the results. Grain size increases slightly with holding time, as ight be expected, but it demonstrate that a given fraction of grains remain within
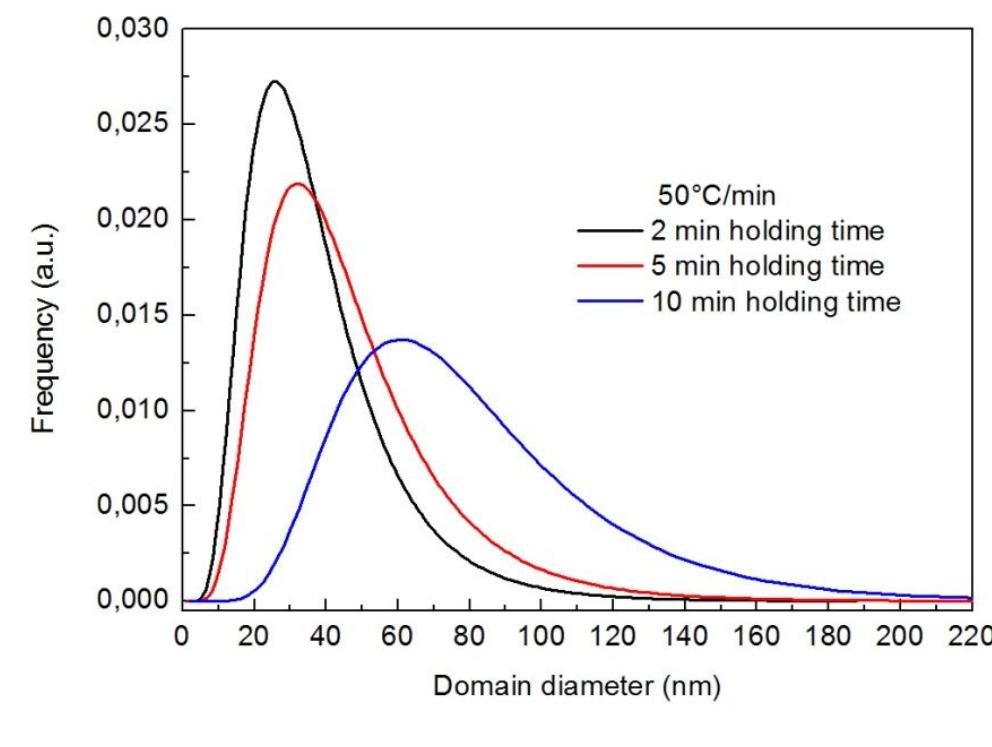
Figure 55: Effect of holding time on the crystalline domaine size distribution at a heating rate of 50°C/min
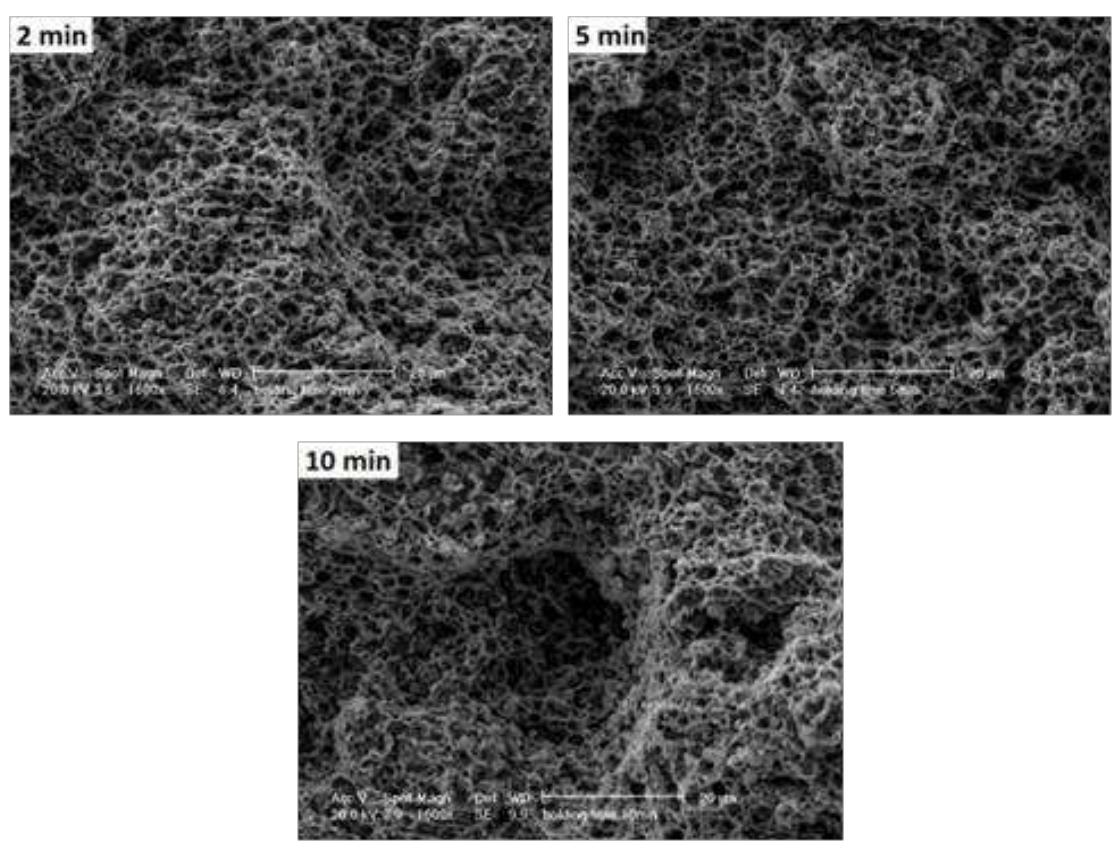
Figura 56: Fracture surface of the three specimens sintered at 50°C/min and at < haldinn tima nf 9 BF and 1N min at ANNE They show a dimpled morphology and several rounded particles within dimples,

Loading Preview
Sorry, preview is currently unavailable. You can download the paper by clicking the button above.
References (109)
- S. Diouf, C. Menapace and A. Molinari. Study of the effect of particle size on densification of copper during spark plasma sintering. Powder Metallurgy, 55 (3) (2012) 228-234
- S. Diouf, A. Molinari. Densification mechanisms in spark plasma sintering: Effect of particle size and pressure. Powder Technology 221 (2012) 220-227
- A. Molinari, S. Libardi, L. Maines, S. Diouf. Effect of heating rate on Spark Plasma Sintering of nanostructured Fe-Mo powders. Int. J. Powder Metall., 48 (6) (2012) 31-39.
- S. Diouf, C. Menapace, A. Molinari. Spark Plasma Sintering of cryomilled copper powder (submited)
- S. Diouf, A. Fedrizzi, A. Molinari. A fractographic and microstructural analysis of the neck regions of coarse copper particles consolidated by Spark Plasma Sintering (submited)
- S. Diouf, Molinari A. A Differential Scanning Calorimetry (DSC) study of the thermal stability of cryomilled copper powder (in preparation)
- S. Diouf, Molinari A. Mechanical properties of spark plasma sintered cryomilled copper (in preparation) Conferences
- S. Diouf, C. Menapace and A. Molinari., Spark Plasma Sintering of copper powders with different particle sizes, presented to EUROMAT, 12-15 September 2011, Montpellier, France
- S. Diouf, A. Molinari. Spark Plasma Sintering of Cryomilled Copper. Pro- ceedings EURO PM2012 Congress Exhibition, Basel 16-19 September 2012, ed. EPMA, Shrewsbury (UK), vol. 1, pp. 11-16.
- A. Molinari, S. Diouf. Spark Plasma Sintering mechanism of nanostructured copper powder. Proceedings PM2012, Japan, 14 -18 October 2012, ed. PM Bibliography Anselmi-Tamburini U. Gennari S., Garay J. E. and Munir Z. A. Fundamental investigations on the spark plasma sintering/synthesis process: II. Modeling of current and temperature distributions. Mater Sci Eng A, 2005. 394: p. 139-148.
- Anselmi-Tamburini U. Spinolo G., Maglia F., Tredici I., Holland T.B., Mukherjee A. K. Field Assisted Sintering Mechanisms. Engineering Materials . 2013. 35: p. 159- 193. Bernard-Granger G. Guizard C. Densification mechanism involved during spark plasma sintering of a codoped a-alumina material: Part I. Formal sintering analysis. J. Mater. Res. 2009. 24(1): p. 179-186.
- Chen X.J. Khor K.A., Chan S.H., Yu L.G. Overcoming the effect of contaminant in solid oxide fuel cell (SOFC) electrolyte: spark plasma sintering (SPS) of 0.5wt.% silica-doped yttria-stabilized zirconia (YSZ). Materials Science and Engineering A. 2004. 374: p. 64-71.
- Cheng S. Ma E., Wang Y.M., Kecskes L.J., Youssef K.M., Koch C.C., Trociewitz U.P., Han K. Tensile properties of in situ consolidated nanocrystalline Cu. Acta Mater . 2005. 53(5): p. 1521-1533.
- Dao M. Lu L., Asaro R.J., De Hosson J.T.M., Ma E. Toward a understanding of mechanical behavior of nanocrystalline metals. Acta Materialia. 2007 . 55(12): p. 4041-4065.
- Dorbolo S. Ausloos M. and Vandewalle N. Reexamination of the Branly effect. Physical Review E. 2003. 67: p. 040302 (R) .
- Dorbolo S. Merlen A., Creyssels M., Vandewalle N., Castaing B. and Falcon E. Effects of electromagnetic waves on the electrical properties of contacts between grains. Europhysics Letters. 2007. 79: p. 54001.
- El-Tantawy Farid. New double negative and positive temperature coefficients of conductive EPDM rubber TiC ceramic composites. European Polymer Journal . 2002. 38: p. 567-577.
- Eric Falcona, Bernard Castaing. Electrical conductivity in granular media and Branly's coherer: A simple experiment. Am. J. Phys. 2005. 73(4): p. 302-307.
- Gleiter H. Nanostructured materials: basic concepts and microstructure. Acta Mater. 2000. 48: p. 1-29.
- Grosdidier T. Goran D., Ji G. and Llorca N. On the processing of hetero- nanostructured metals for improved strength/ductility balance by ECAE and SPS techniques. Journal of Alloys and Compounds. 2010. 504S: p. S456-S459.
- Groza J. R. Garcia M. and Schneider J. A. Surface effects in field-assisted sintering. J.Mater. Res. 2001. 16(1): p. 286-292.
- Guo Shu-Qi Nishimura T., Kagawa Y., and Yang JM. Spark Plasma Sintering of Zirconium Diborides. J. Am. Ceram. Soc. 2008. 91(9): p. 2848-2855.
- Guyot P. Rat V., Coudert J. F., Jay F., Maıtre A. and Pradeilles N. Does the Branly effect occur in spark plasma sintering? Journal of Physics D: Applied Physics. 2012. 45: p. 092001.
- Hayes R.W. Rodriguez R. and Lavernia E.J. The mechanical behavior of a cryomilled Al-10Ti-2Cu alloy. Acta Mater. 2001. 49: p. 4055-4068.
- Hill R. E. Reed. Physical Metallurgy Principles. 2009, Stamford (CA) : Cengage Lerning, 4th edition: p. 268-272.
- Holland T.B. Ovid'ko I.A., Wang H., Mukherjee A.K. Elevated temperature deformation behavior of spark plasma sintered nanometric nickel with varied grain size distributions. Materials Science and Engineering A. 2010. 528: p. 663-671.
- Hulbert D. M. Anders A., Andersson J., Lavernia E. J. and Mukherjee A. K. A discussion on the absence of plasma in spark plasma sintering. Scripta Materialia. 2009. 60: p. 835-838.
- Hungría T. Galy J., Castro A. Spark Plasma Sintering as a Useful Technique to the Nanostructuration of Piezo-Ferroelectric Materials. Advanced Engineering Materials. 2009 . 11(8): p. 615-631.
- Johnson K. L. Contact Mechanics. 1985, Cambridge, Cambridge University Press: p. 432-447.
- Kim C. K. Lee S., Shin S.Y., Kim D.H. Effects of consolidation temperature and pressure on microstructures and mechanical properties of Cu-based bulk amorphous alloys consolidated by spark plasma sintering. Journal of Alloys and Compounds. 2008. 453: p. 108-114.
- Koch C.C. Morris D.G., Lu K. and Inoue A. Mater Res Soc Bull . 1999. 24: -p. 54.
- Koch C.C. Structural nanocrystalline materials: an overview. J Mater Sci . 2007. 42(5): p. 1403-1414.
- Kodash V.Y. Groza J.R., Cho K.C., Klotz B.R., and Dowding R.J. Field-assisted sintering of Ni nanopowders. Materials Science and Engineering A. 2004. 385(1-2): p. 367-371.
- Kumar K.S. Van Swygenhoven H., Suresh S. Mechanical behavior of nanocrystalline metals and alloys. Acta Materialia. 2003. 51(19): p. 5743-5774.
- Langer J. Hoffmann M. J., Guillon O. Direct comparison between hot pressing and electric field-assisted sintering of submicron alumina. Acta Materialia. 2009. 57: p. 5454-5465.
- Lavernia E.J. Han B.Q., Schoenung J.M. Cryomilled nanostructured materials: Processing and properties. Materials Science and Engineering A. 2008. 493: p. 207- 214. Lee Z. Rodriguez R., Hayes R.W., Lavernia E.J. and Nutt S.R. Microstructural Evolution and Deformation of Cryomilled Nanocrystalline Al-Ti-Cu Alloy. Metall. Mater. Trans. A. 2003. 34(7): p. 1473-1481.
- Legros M Elliot BR, Rittner MN, Weertman JR, Hemker KJ. Microsample tensile testing of nanocrystalline metals. Phil. Mag. A. 2000. 80: p. 1017.
- Leoni M. Confente T. and Scardi P. PM2K: a flexible program implementing Whole Powder Pattern Modelling. Z. Kristallogr. Suppl. 2006. 23: p. 249 -254.
- Li B.R. WangX.H., Cai M.M., Hao L.F., Li L. Densification of uniformly small-grained BaTiO3 using spark-plasma-sintering. Mater. Chem. Phys. 2003. 82: p. 173-180.
- Libardi S. Leoni M., Facchini L., D'Incau M., Scardi P. and Molinari A. Effect of the dispersion of nanometric silica particles on the thermal stability of a nanostructured iron based powder. Mater Sci Eng A. 2007. 445-446: p. 244-250.
- Liu D. Xiong Y., , Li Y., Topping T. D., Zhou Y., Heines C., Paras J., Martin D., Kapoor D., Schoenung J. M. and Lavernia E. J. Spark Plasma Sintering of cryomilled nanocrystalline Al alloy -Part II: Influence of processing conditions on densification and properties. Metallurgical and Materials Transactions A. 2012. 43: p. 340-350.
- Locci A.M. Cincotti A., Todde S., Orrù R. and Cao G. A methodology to investigate the intrinsic effect of the pulsed electric current during the spark plasma sintering of electrically conductive powders. Sci. Technol. Adv. Mater. 2010. 11: p. 045005.
- Lu K. Sintering of nanoceramics. Int. Mater. Rev. 2008. 53(1): p. 21-38.
- Luton M. J. Jayanth C. S., Disko M. M., Matras S. and Vallone J. Cryomilling of Nano-Phase Dispersion Strengthened Aluminum. MRS Proceedings. 1988. 132: p. 79. -doi:10.1557/PROC-132-79.
- Lutterotti L. Matthies S., Wenk H.R., Schultz A.S., Richardson J.W.Jr. Combined texture and structure analysis of deformed limestone from time-of-flight neutron diffraction spectra. J. Appl. Phys. 1997. 81: p. 594.
- M.Tokita. Mechanism of Spark Plasma Sintering. Sumitomo Coal Mining Company, Internal Comunication . p. 13 pp..
- Ma E. Instabilities and ductility of nanocrystalline and ultrafine-grained metals. Scripta Materialia. -2003. 49: p. 663-668.
- Mamedov V. Spark plasma sintering as advanced PM sintering method. Powder Metall. 2002. 45(4): p. 322-328.
- McWilliams B. Zavaliangos A., Cho, Robert K.C., Dowding J. The modeling of electric-current-assisted sintering to produce bulk nanocrystalline tungsten. JOM. 2006. 58: p. 67.
- Meyers M.A. Mishra A., Benson D.J. Mechanical properties of nanocrystalline materials. Progress in Materials Science. 2006. 51: p. 427-556.
- Misawa T. Shikatani N., Kawakami Y., Enjoji T., Ohtsu Y., Fujita H. Observation of internal pulsed current flow through the ZnO specimen in the spark plasma sintering method. J Mater Sci . 2009. 44: p. 1641-1651.
- Moelle C. H. and Fecht H. J. Thermal stability of nanocrystalline iron prepared by mechanical attrition. Nanostructured Materials. 1995. 6: p. 421-424.
- Molinari A. Libardi S., Leoni M. and Scardi P. Role of lattice strain on thermal stability of a nanocrystalline FeMo alloy. Acta Materialia. 2010. 58: p. 963-966.
- Molinari A. Libardi S., Maines L., Diouf S. Effect of heating rate on Spark Plasma Sintering of nanostructured Fe-Mo powders. Int. J. Powder Metall. 2012. 48(6): p. 31- 39. Molinari A. Lonardelli I., Demetrio K., Menapace C. Effect of the particle size on the thermal stability of nanostructured aluminum powder: dislocation density and second-phase particles controlling the grain growth. J. Mater. Sci. 2010. 45(24 ): p. 6739-6746.
- Mouawad B. Soueidan M., Fabrègue D., Buttay C., Bley V., Allard B., Morel H. Full densification of Molybdenum powders using Spark Plasma Sintering. Metallurgical & Materials Transactions. Part A. 2012. 43(9): p. 3402-3409.
- Mukherjee A.K. An examination of the constitutive equation for elevated temperature plasticity. Mater Sci Eng A. 2002. 322: p. 1-22.
- Munir Z. A. Anselmi-Tamburini U. and Ohyanagi M. The effect of electric field and pressure on the synthesis and consolidation of materials: A review of the spark plasma sintering method. J. Mater. Sci. 2006. 41(3): p. 763-777.
- Munir Z. A. Anselmi-tamburini U., Ohyanagi M. The effect of electric field and pressure on the synthesis and consolidation of materials: A review of the spark plasma sintering method. J. Mater. Sci. 2006. 41: p. 763-777.
- Olevski E. Froyen L. Constitutive modeling of spark-plasma sintering of conductive materials. Scripta mater. 2006. 55: p. 1175-1178.
- Olevsky E. A. Kandukuri S., and Froyen L. Consolidation enhancement in spark- plasma sintering: Impact of high heating rates. J. Appl. Phys. 2007. 102: p. 114913.
- Olevsky E. Froyen L. Constitutive modelling of spark plasma sintering of conductive materials. Scripta Materialia. 2006. 55: p. 1175-1178.
- Omori M. Sintering, consolidation, reaction and crystal growth by the spark plasma system (SPS). Mater Sci Eng A . 2000. 287: p. 183-188.
- Orrù R. Licheri R., Locci A. M., Cincotti A., and Cao G. Consolidation/synthesis of materials by electric current activated/assisted sintering. Mater. Sci. Eng. R. 2009. 63: p. 127-287.
- Ovid'ko I. A. Review on the fracture processes in nanocrystalline materials. J Mater Sci . 2007. 42(5): p. 1694-1708.
- Ovid'ko I.A. Langdon T.G. Enhanced ductility of naocrystalline and ultrafine-grained metals. Rev. Adv. Mater. Sci. 2012. 30: p. 103-111.
- Perez R.J. Jiang H.G., Dogan C.P. and Lavernia E.J. Grain Growth of Nanocrystalline Cryomilled Fe-Al Powders. Metall. Mater. Trans. A. 1998. 29: p. 2469-2475.
- Prasad Y.V.R.K. Rao K.P. Influence of oxygen on rate-controlling mechanisms in hot deformation of polycrystalline copper: oxygen-free versus electrolytic grades. Materials Letters. 2004. 58(14): p. 2061-2066.
- Risbud S.H. Groza J.R. & Kim M.J. Clean grain boundaries in aluminium nitride ceramics densified without additives by a plasma-activated sintering process. Phil. Mag. B. 1994. 69(3): p. 525-533.
- Ritasalo R. Cura M. E., Liu X. W., Söderberg O., Ritvonen T. and Hannula S. P. Spark plasma sintering of submicron-sized Cu-powder Influence of processing parameters and powder oxidization on microstructure and mechanical properties. Mater Sci Eng A. 2010. 527: p. 2733-2737.
- Roy I. Chauhan M., LAVERNIA E. J. and Mohamed F. A. Thermal Stability in Bulk Cryomilled Ultrafine-Grained 5083 Al Alloy. METALLURGICAL AND MATERIALS TRANSACTIONS A. 2006. 37: p. 721-730.
- Sakka Y. Reduction and sintering of ultrafine copper powders. Journal of Materials Science Letters. 1989. 8: p. 273-276.
- Sanders P.G. Eastman J.A., Weertman J.R. Elastic and tensile behavior of nanocrystalline copper and palladium. Acta Materialia. 1997. Vol. 45(10): p. 4019- 4025.
- Sanders P.G. Youngdahl C.J., Weertman J.R. The strength of nanocrystalline metals with and without flaws. Mater. Sci. Eng. A. 1997. 234-236: p. 77-82.
- Sergueeva A.V. Mara N.A., Mukherjee A.K. Deformation Mechanisms in a Nanocrystalline Vitroperm Alloy. Rev. Adv. Mater. Sci. 2004. 7(2): p. 67-74.
- Shewmon P. Diffusion in Solids. 1989. Warrendale (PA) : The Minerals, Metals and Materials Society..2nd edition. p. 202-205.
- Shima Y. Ishikawa Y., Nitta H., Yamazaki Y., Mimura K., Isshiki M. and Iijia Y. Self-diffusion along dislocations in ultra high purity iron. Materials Transactions. 2002. 43(2): p. 173-177.
- Siddiqui R. A. Alp T. Effect of isothermal annealing on the Bordoni relaxation in cold worked copper. J. Mater. Sci. 1991. 26: p. 6362-6372.
- Siegel R.W. Fougere G.E. Mechanical properties of nanophase metal. Nanostruct. Mater. 1995. 6: p. 205-216.
- Simões S. Calinas R., Vieira M. T., Vieira M. F. and Ferreira P. J. In situ TEM study of grain growth in nanocrystalline copper thin films. Nanotechnology. 2010. 21: p. 145701.
- Sobol' V. R. Logvinovich P. N., Bel'skii S. E. and Blokhin A. V. Temperature mechanisms of the interaction of dislocations with impurities in the processes of transfer of the energy of elastic vibrations. Journal of Engineering Physics and Thermophysics. 2007. 80(4): p. 840-846.
- Song X. Liu X. and Zhang J. Neck Formation and Self-Adjusting Mechanism of Neck Growth of conducting powders in Spark Plasma Sintering. J. Am. Ceram. Soc. 2006. 89(2): p. 494-500.
- Srinivasarao B. Oh-ishi K., Ohkubo T., Mukai T. and Hono K. Synthesis of high- strength bimodally grained iron by mechanical alloying and spark plasma sintering. Scripta Mater. 2008. 58: p. 759-762.
- Srinivasarao B. Suryanarayana C., Oh-ishi K. and Hono K. Microstructure and mechanical properties of Al-Zr nanocomposite materials. Materials Science and Engineering A. 2009. 518(1-2): p. 100-107.
- Suryanarayana C. Koch C.C. Nanocrystalline materials -Current research and future directions. Hyperfine Interactions. 2000. 130(1-4): p. 5-44.
- Suryanarayana C. Mechanical alloying and milling [Rivista] // Prog. Mater. Sci.. - 2001. 46: p. 1-184.
- Team R Development Core. R: a language and environment for statistical computing. R Foundation for Statistical Computing. 2010. Vienna .
- Tellkamp V. L. Melmed A. and Lavernia E.J. Mechanical Behavior and Microstructure of a Thermally Stable Bulk Nanostructured Al Alloy, Metall. Mater. Trans. A. 2001. 32: p. 2335-2343.
- Tiwari D. Basu B., Biswas K. Simulation of thermal and electric field evolution during spark plasma sintering. Ceramics International. 2009. 35: p. 699-708.
- Tokita M. Development of Large-Size Ceramic/Metal Bulk FGM Fabricated by Spark Plasma Sintering. Mater Sci Forum. 1999. 308-311: p. 83-88.
- Valiev R. Z. Islamgaliev R.K. and Alexandrov I. V. Bulk nanostructured materials from severe plastic deformation. Prog. Mater. Sci. 2000. 45. -p. 103-189.
- Vanmeensel K. Laptev A., Hennicke J., Vleugels J., Van der Biest O. Modelling of the temperature distribution during field assisted sintering. Acta Materialia. 2005. 53: p. 4379-4388.
- Wang S.W. Chen L.D., and Hirai T. Densification of Al2O3 powder using spark plasma sintering. J. Mater. Res. 2000. 15(4): p. 982-987.
- Wang Y. Chen M., Zhou F., Ma E. High tensile ductility in a nanostructured metal. Nature. 2002. 419 912-915.
- Wang Y. Fu Z. Study of temperature field in spark plasma sintering. Mater. Sci. Eng. B. 2002. 90: p. 34 .
- Wang Y. M. Ma E. Enhanced tensile ductility and toughness in nanostructured Cu. Appl. Phys. Lett. 2002. 80(13):.p. 2395-2397.
- Wang Y.M. Ma E. Three strategies to achieve uniform tensile deformation in a nanostructured metal. Acta Materialia. 2004. 52(6): p. 1699-1709.
- Wen H. Zhao Y., Zhang Z., Ertorer O., Dong S. and Lavernia E. J. The influence of oxygen and nitrogen contamination on the densification behavior of cryomilled copper powders during spark plasma sintering. Journal of Materials Science. 2011. 46(9): p. 3006-3012.
- Wolf D. Yamakov V., Phillpot S.R., Mukherjee A., Gleiter H. Deformation of nanocrystalline materials by molecular-dynamics simulation: relationship to experiments? Acta Materialia. 2005. 53(1): p. 1-40.
- Xiong Y. Liu D., Li Y., Zheng B., Heines C., Paras J., Martin D., Kapoor D., Lavernia E. J. and Schoenung J. M. Spark Plasma Sintering of cryomilled nanocrystalline Al alloy -Part I: Microstructure Evolution. Metallurgical and Materials Transactions A. 2012. 43: p. 327-339.
- Yanagisawa O. Kuramoto H., Matsugi K. and Komatsu M. Observation of particle behavior in copper powder compact during pulsed electric discharge. Materials Science and Engineering A. 2003. 350: p. 184-189.
- Ye J. Ajdelszajn L., Scoenhung J.M. Bulk nanocrystalline aluminum 5083 alloy fabricated by a novel technique: cryomilling and spark plasma sintering. Metall. Mater. Trans. A. 2006. 37: p. 2569.
- Zadra M. Casari F., Girardini L. and Molinari. A Spark plasma sintering of pure aluminium powder: mechanical properties and fracture analysis. Powder Metallurgy. 2007. 50(1): p. 40-45.
- Zavaliangos A. Zhang J., Krammer M., Groza J.R. Temperature evolution during field activated sintering. Materials Science and Engineering A. 2004. 379: p. 218- 228. Zhang X. Wang H. and Koch C. C. Mechanical behavior of bulk ultrafine-grained and nanocrystalline Zn. Rev. Adv. Mater. Sci. 2004. 6: p. 53-93.
- Zhang Z. H. Wang F. C., Lee S. K., Liu Y., Cheng J. W., Liang Y. Microstructure characteristic, mechanical properties and sintering mechanism of nanocrystalline copper obtained by SPS process. Mater Sci Eng A. 2009. 523: p. 134-138.
- Zhang Z. H. Wang F. C., Wang L. and Li S. K. Ultrafine-grained copper prepared by spark plasma sintering process. Materials Science and Engineering A. 2008. 476. p. 201-205.
- Zhao Y. H. Lu K. Microstructure evolution and thermal properties in nanocrystalline Cu during mechanical attrition. Physical Review B. 2002. 66: p. 085404. Zhaohui Z Fuchi W., Lin W., Shukui L., Osamu S. Sintering mechanism of large- scale ultrafine-grained copper prepared by SPS method. Materials Letters. 2008. 62(24): p. 3987-3990.
- Zhao-Hui Z. Fu-Chi W., Lin W., and Shu-Kui L. Ultrafine-grained copper prepared by spark plasma sintering process. Mater Sci Eng A. 2008. 476: p. 201-205.
- Zhou F. Liao X.Z., Zhu Y.T., Dallek S. and Lavernia E.J. Microstructural evolution during recovery and recrystallization of a nanocrystalline Al-Mg alloy prepared by cryogenic ball milling. Acta Mater. 2003. 51: p. 2777-2791.
- Zúñiga A. Ajdelsztajn L., and Lavernia E.J. Spark Plasma Sintering of a Nanocrystalline Al-Cu-Mg-Fe-Ni-Sc Alloy. Metall. Mater. Trans. A. 2006. 37(4): p. 1343-52.