Process simulation of lime calcination in mixed feed shaft kilns (original) (raw)
Abstract
Ich erkläre hiermit, dass ich die vorliegende Arbeit ohne unzulässige Hilfe Dritter und ohne Benutzung anderer als der angegebenen Hilfsmittel angefertigt habe. Die aus fremden Quellen direkt oder indirektübernommenen Gedanken sind als solche kenntlich gemacht. Insbesondere habe ich nicht die Hilfe einer kommerziellen Promotionsberatung in Anspruch genommen. Dritte haben von mir weder unmittelbar noch mittelbar geldwerte Leistungen für Arbeiten erhalten, die im Zusammenhang mit dem Inhalt der vorgelegten Dissertation stehen. Die Arbeit wurde bisher weder im Inland noch im Ausland in gleicher oderähnlicher Form als Dissertation eingereicht und ist als Ganzes auch noch nicht veröffentlicht. Magdeburg, den 09.01.2012
Key takeaways
![]()
AI
- The study develops a mathematical model to optimize mixed feed shaft kiln operations for lime production.
- Key parameters include fuel ratio (optimal around 7%), limestone size, and air excess number.
- The model predicts temperature profiles, conversion rates, and gas concentrations along the kiln's height.
- Experimental measurements validate the model, showing discrepancies in temperature profiles due to limestone quality.
- Improving limestone quality and managing fuel characteristics can enhance kiln efficiency.
Figures (86)
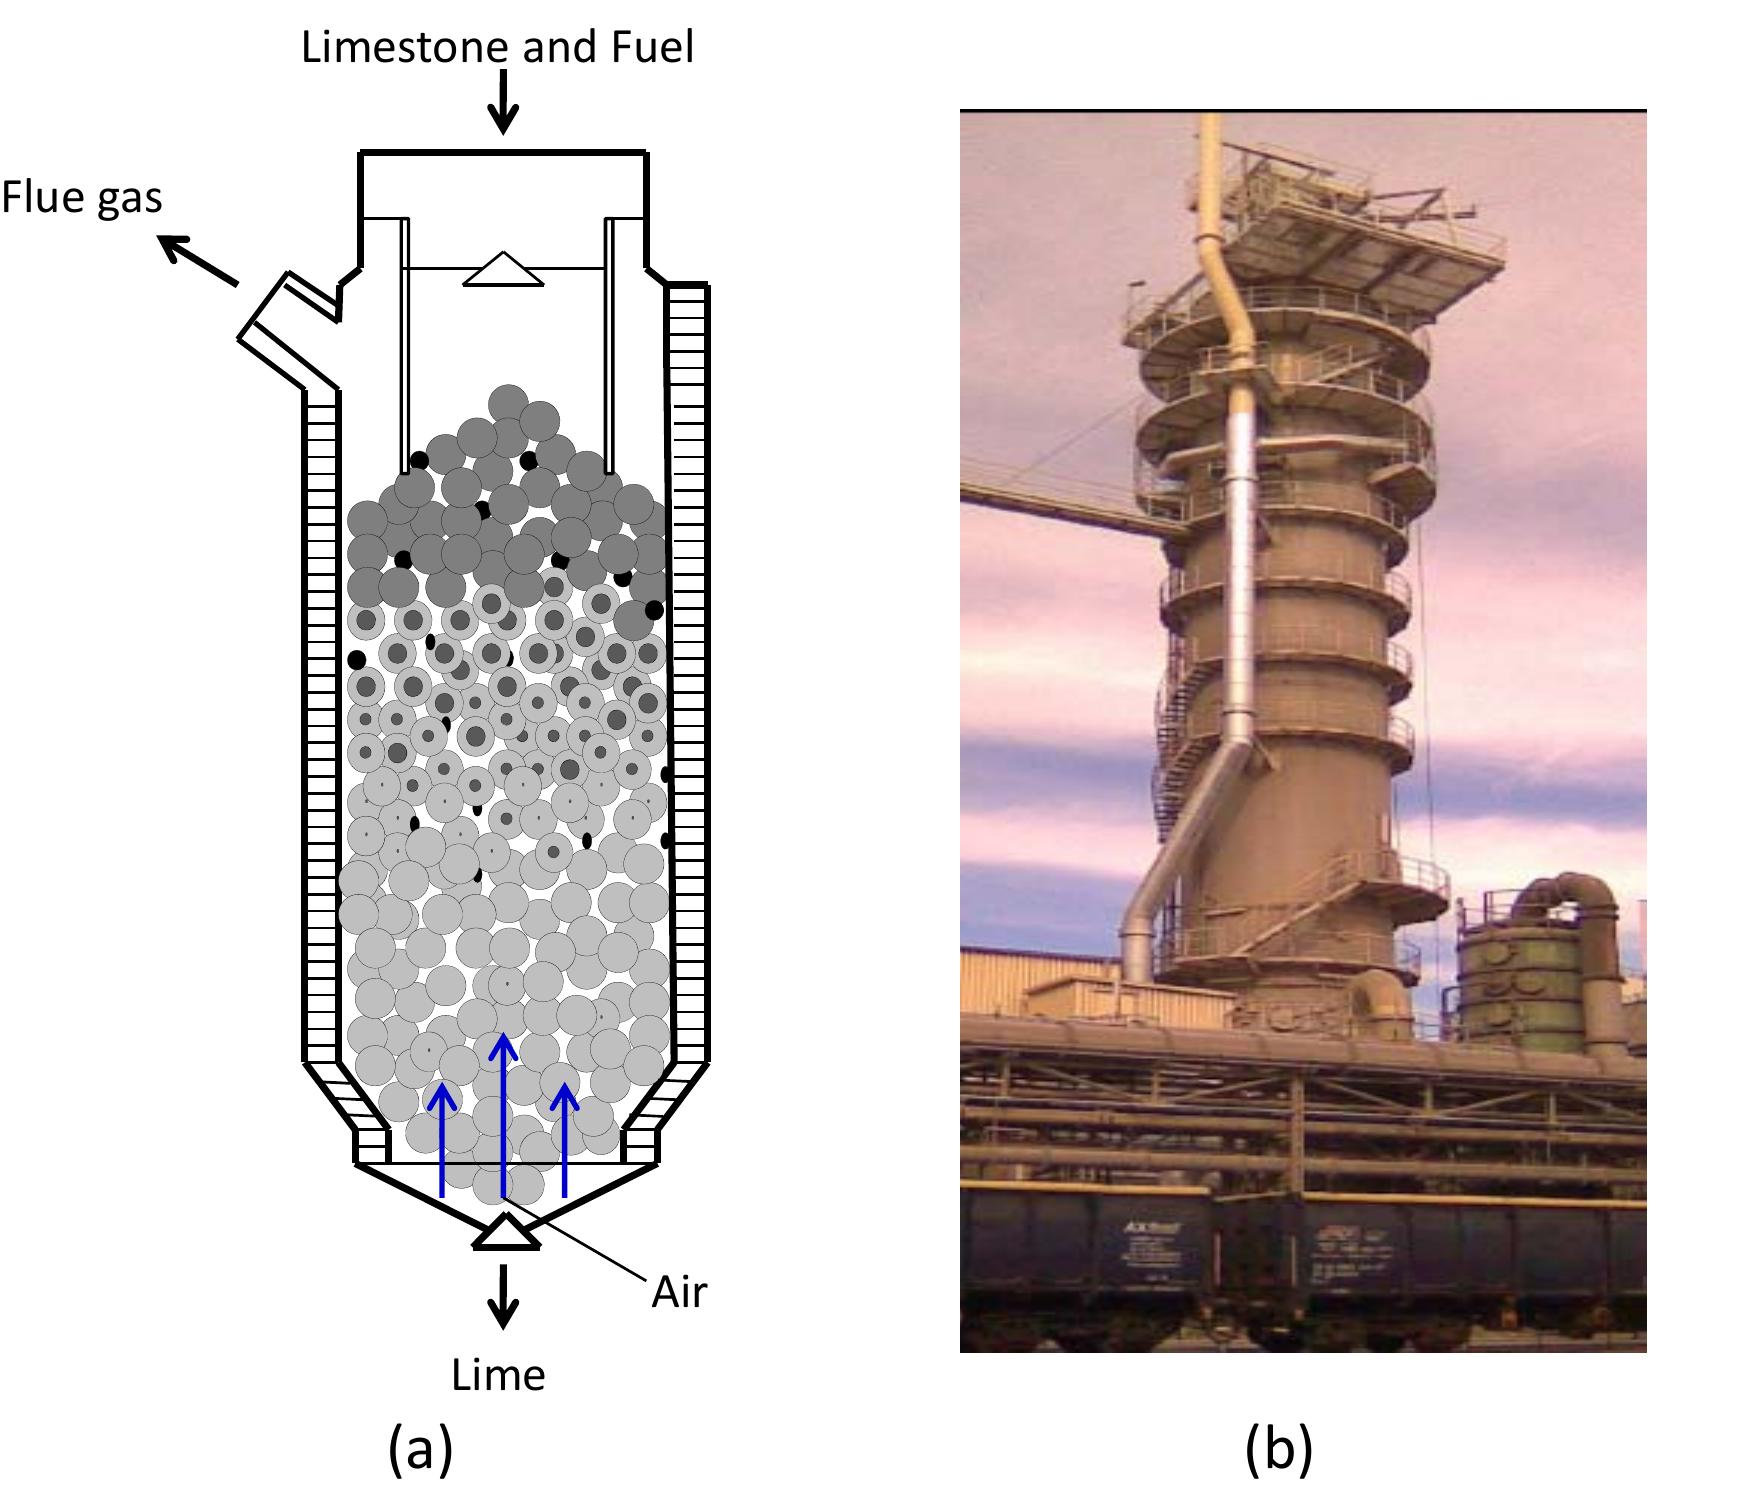
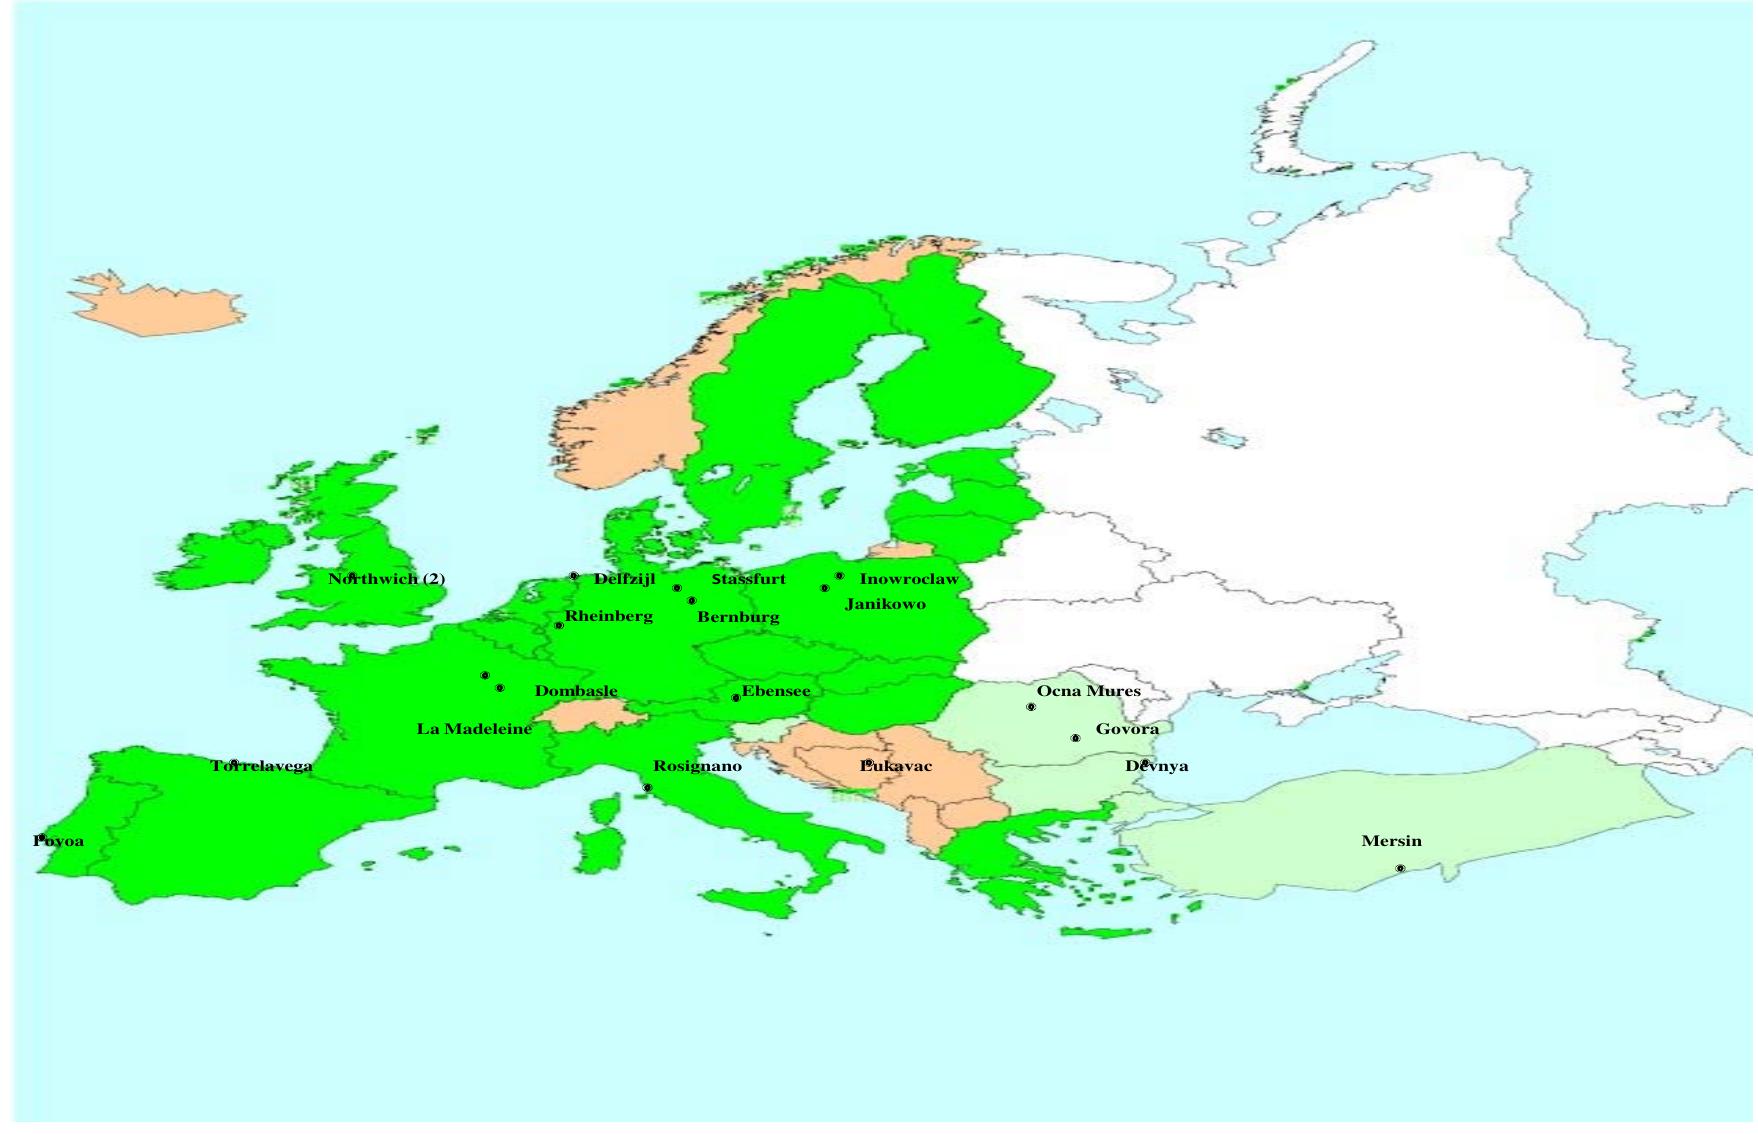
Figure 1.2: Overview of the location of soda ash plants (Solvay process)within the European Union (2002).
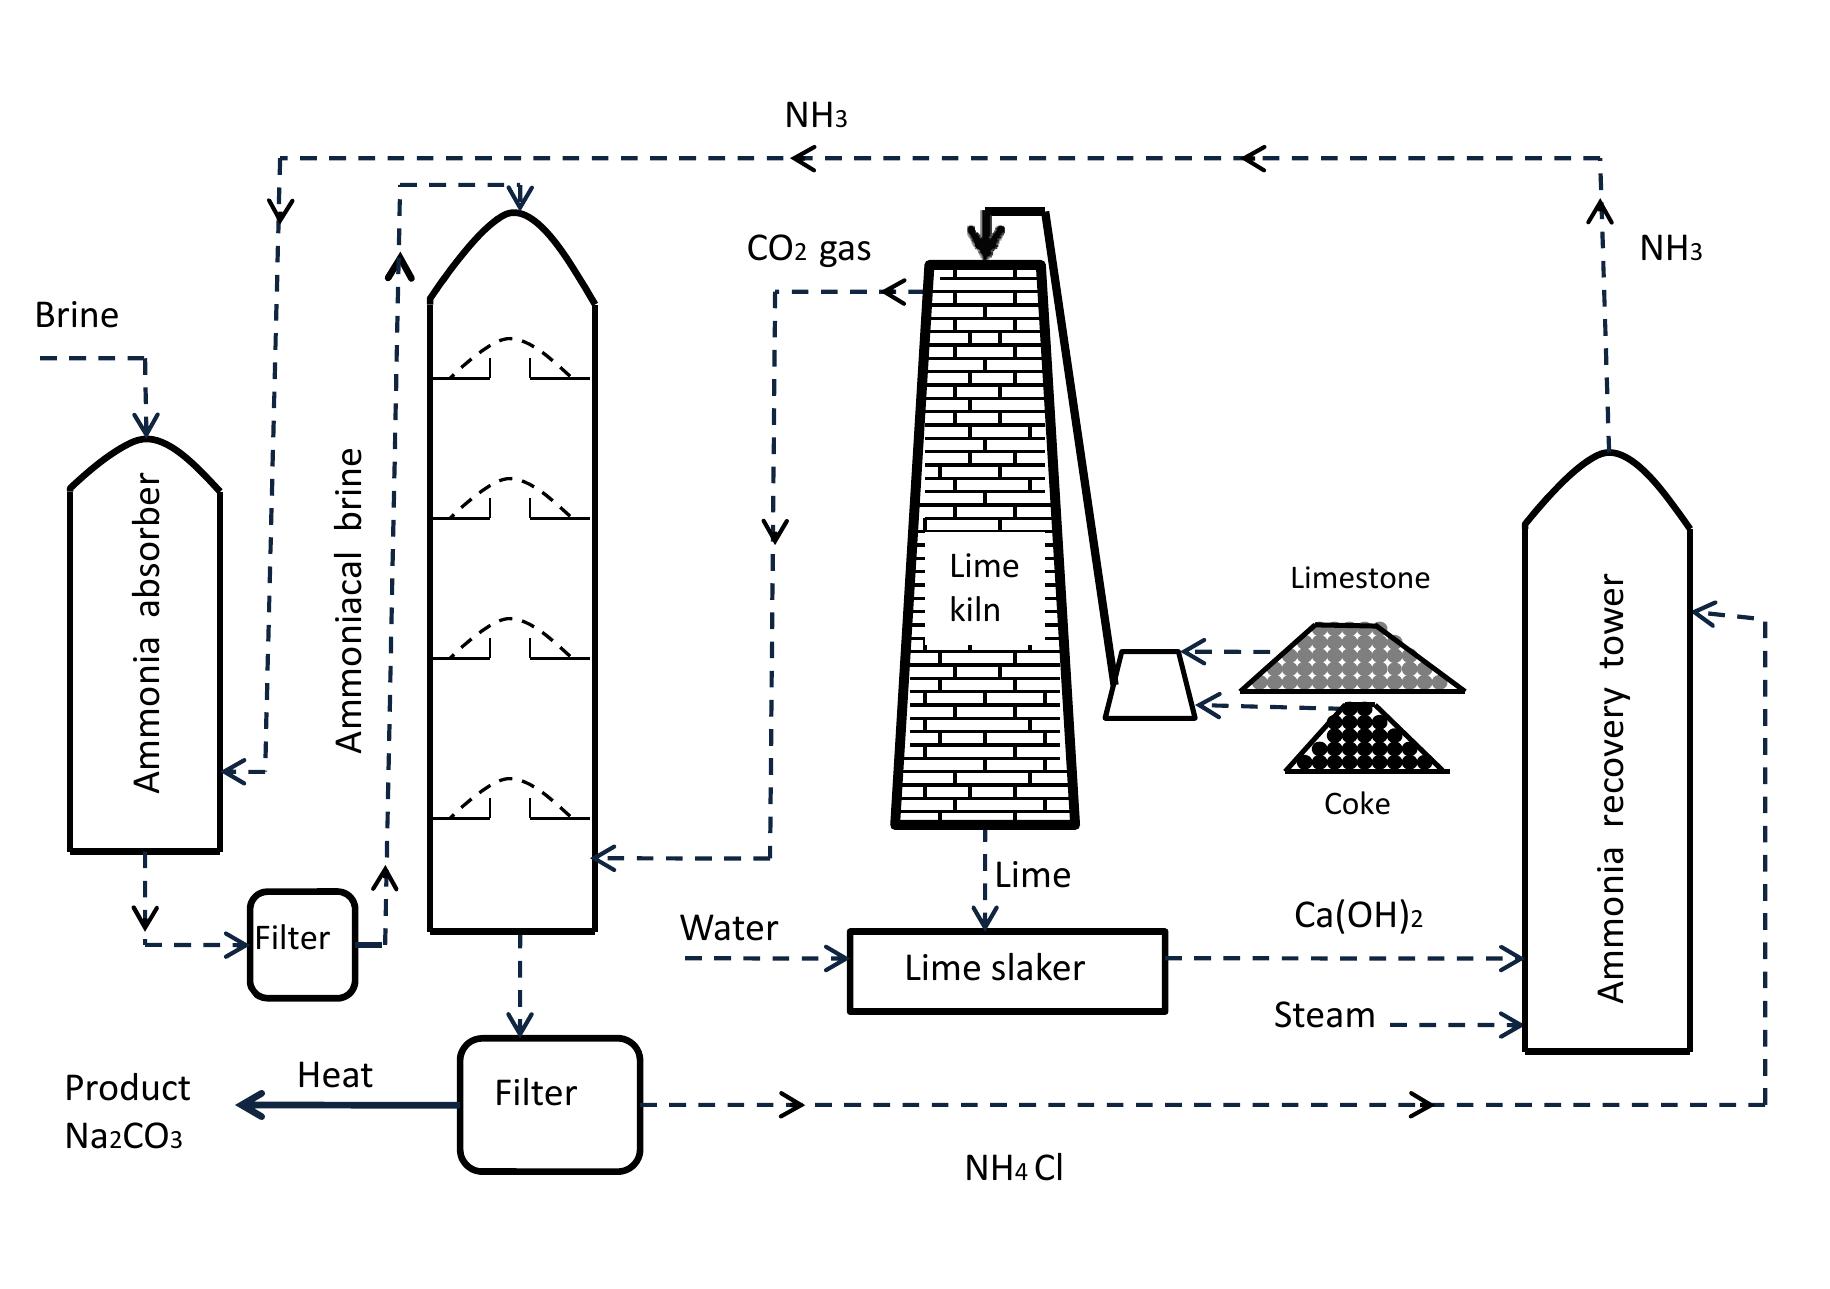
Figure 1.3: Flow diagram of soda ash plant.
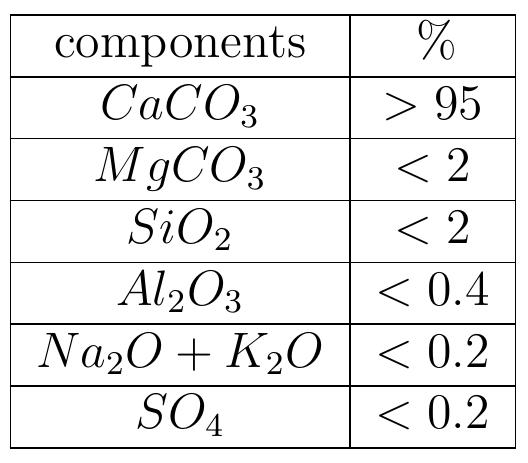
Table 1.1: Typical composition of limestone for the lime kiln Particle size distribution of limestone from quarries is generally between 40 and 200 mm. The more homogeneous they are, the better lime kiln will work. Before lime- stone is put into the kiln it should be clean of clay and mud because these materials block the complete exit of the gas from the kiln.
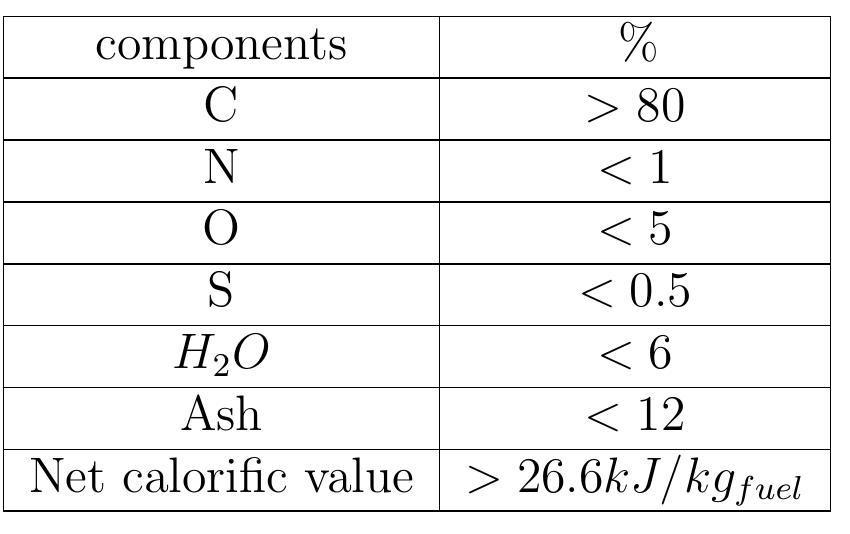
Table 1.2: Suitable coke composition for use in the lime kiln
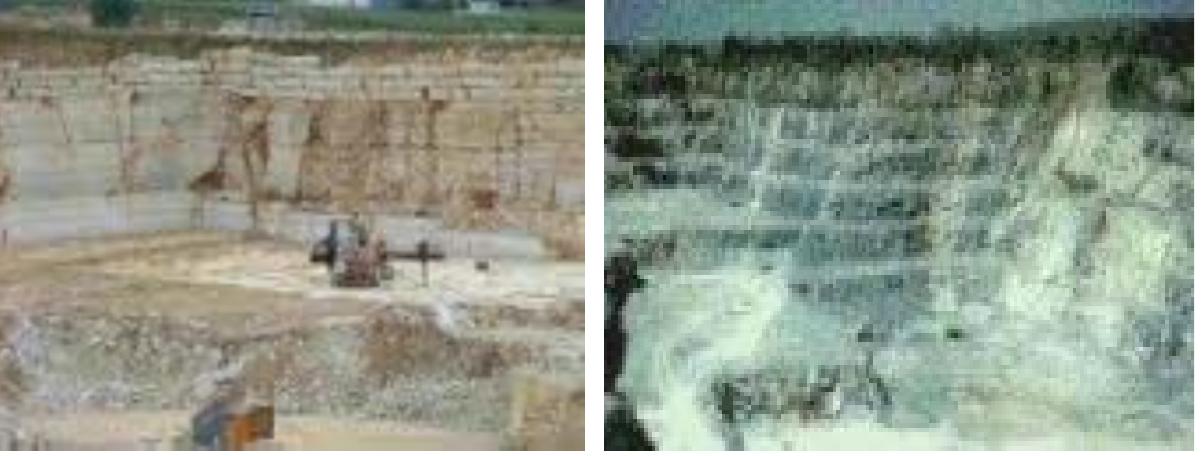
Figure 1.4: Photograph of limestone quarry.
![Figure 1.5: Photograph of a crystalline slag fragment roughly 70 mm in diameter [7].](https://figures.academia-assets.com/82863391/figure_005.jpg) ](
](Figure 1.5: Photograph of a crystalline slag fragment roughly 70 mm in diameter [7].
![Figure 1.6: Cross section of unburned lime particles [9].](https://figures.academia-assets.com/82863391/figure_006.jpg) ](
](Figure 1.6: Cross section of unburned lime particles [9].
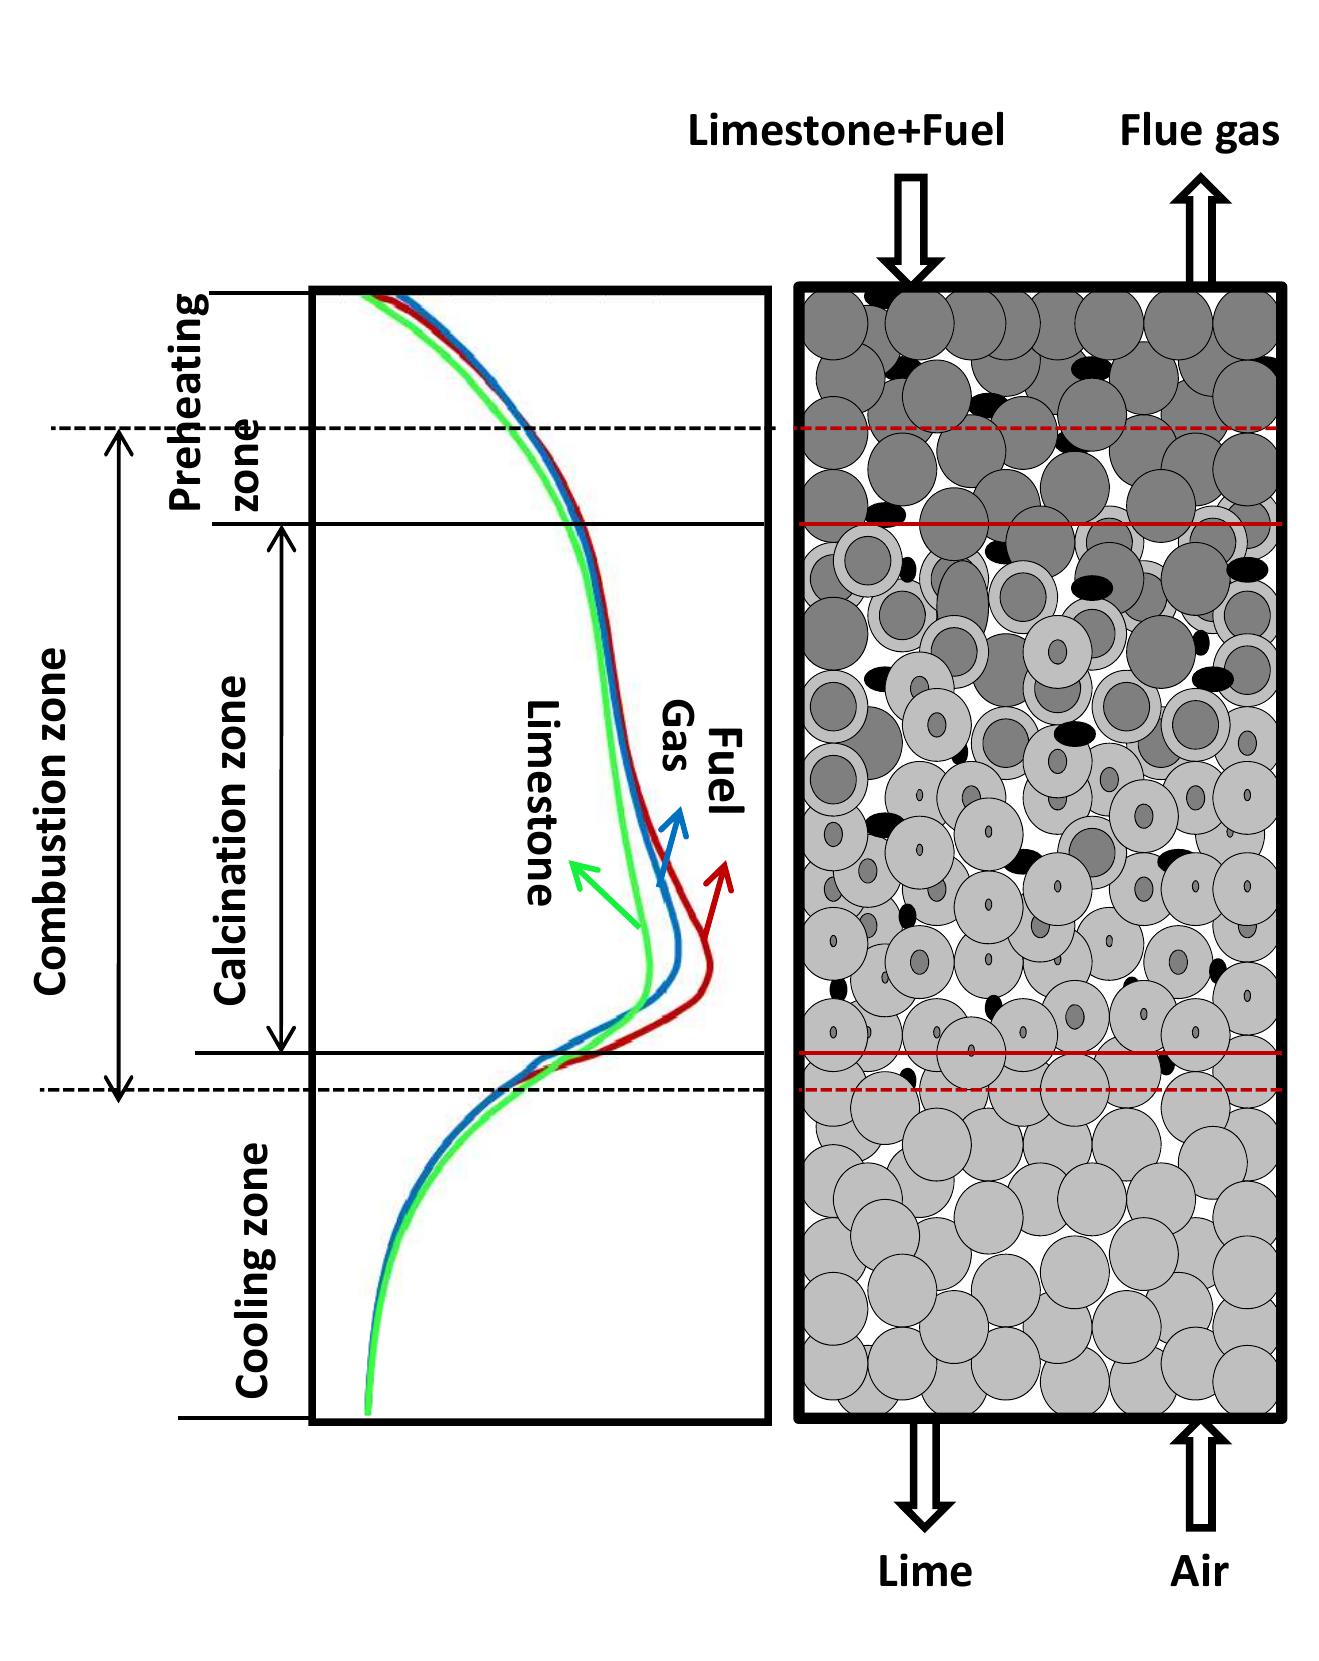
Figure 2.1: Temperature profile and flow direction of solid and gas.
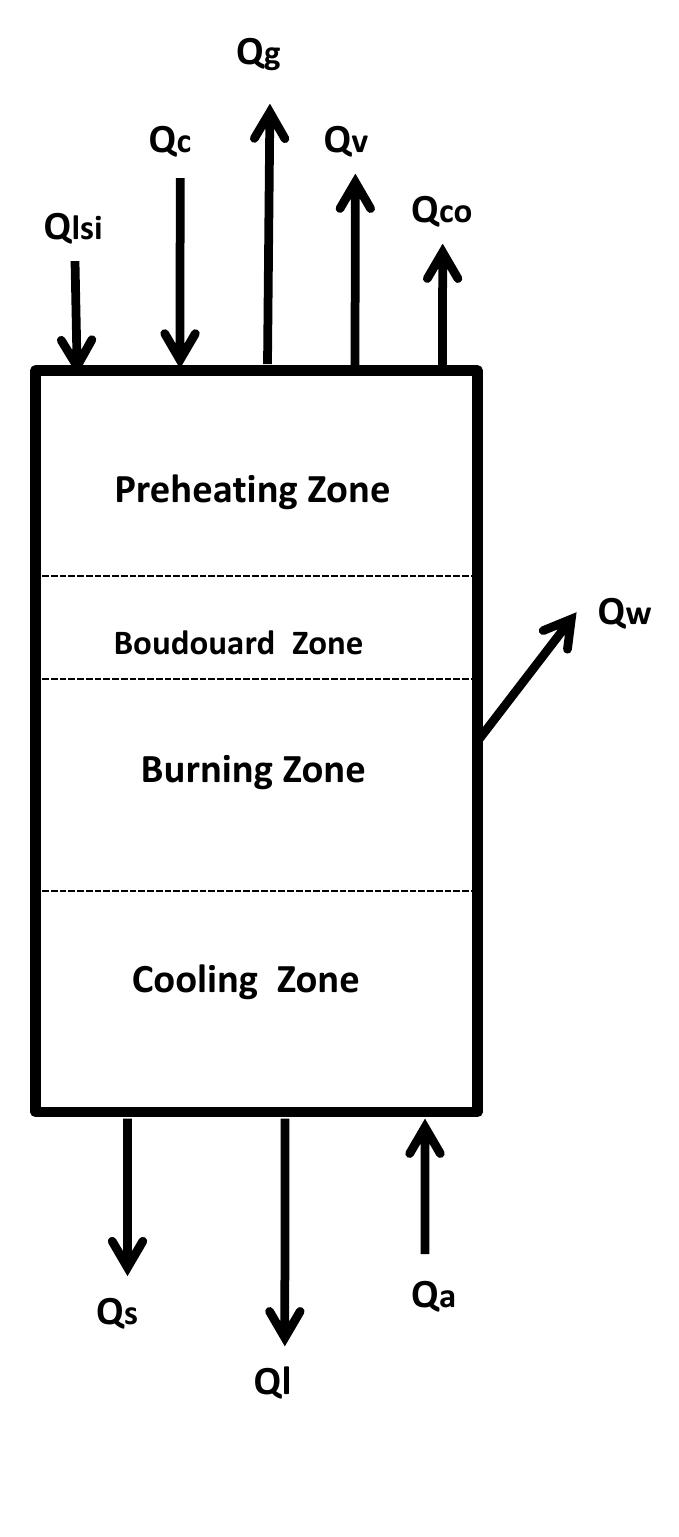
Figure 2.2: Heat input and output of Mixed feed shaft kiln.
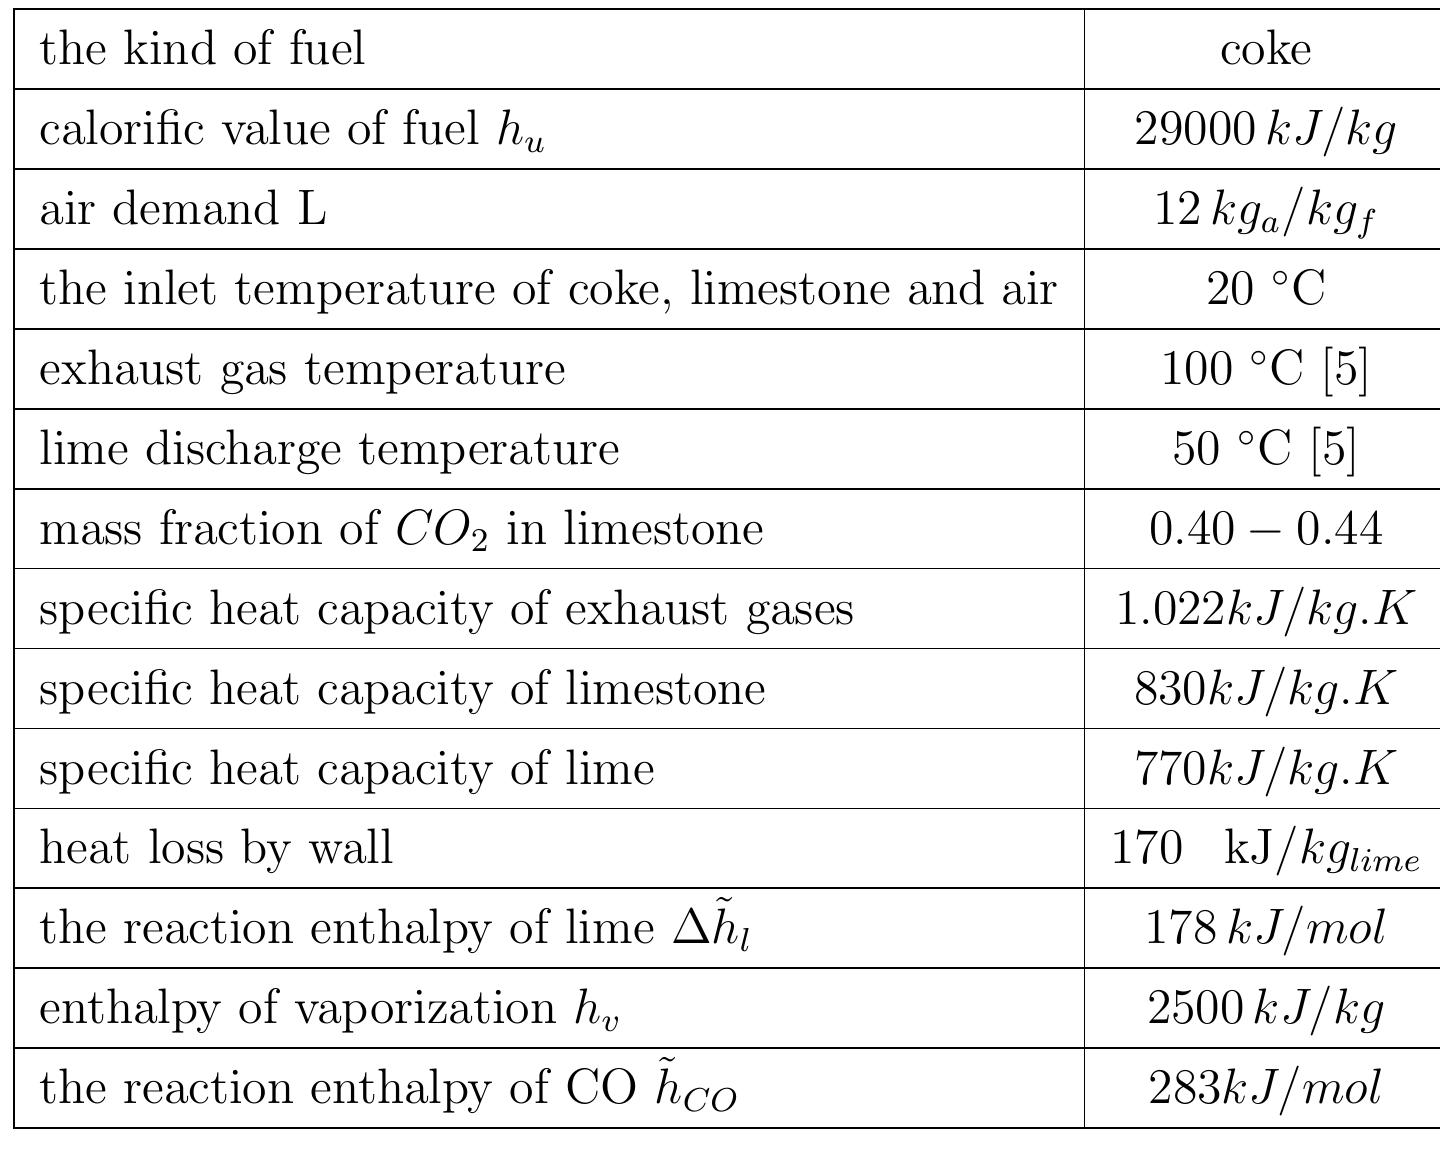
Table 2.1: Summary of assumptions to energy balance calculations 2.3.2 Energy consumption With the set of equations 2.1 to 2.9 the energy balance for the kiln can be calculated. Also, the assumptions in table 2.1 are postulated in order to calculate the energy balance of the kiln. The calculations were carried out with the mean values of specific heat capacities.
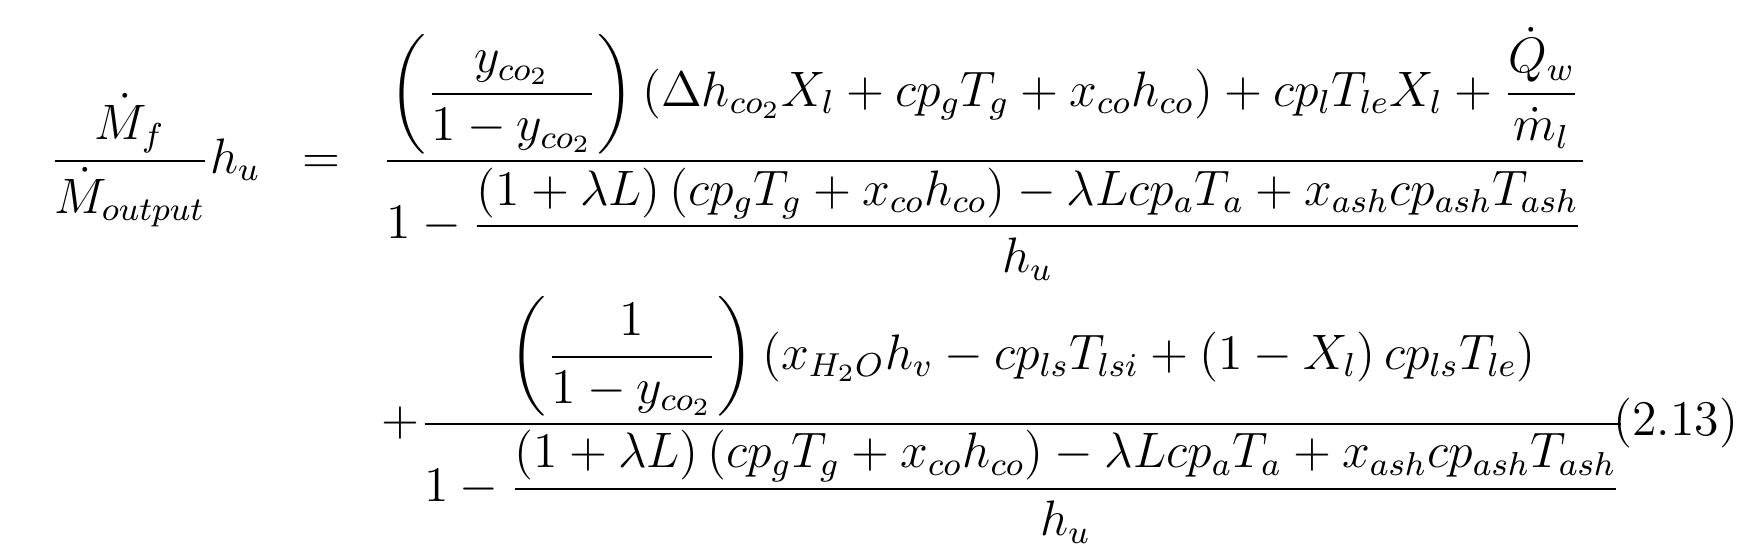
consumption per kg of output is obtained: From equation 2.13 and previous assumptions, the energy consumption of mixed feed lime kiln can be calculated. Figure 2.3 shows the energy consumption per output of kiln for different conversion degrees of limestone that are dependent on the air excess number. For mixed feed lime kiln, air excess number should be in a range of theoretical to 20% over the theoretical. Therefore, here, the energy consumption is calculated for air excess number in the range of 1 to 1.2. The energy consumption increases linearly with air excess number and also increases with increasing conversion degree of limestone. The energy consumption for complete calcination of limestone is the highest and decreases by approximately 0.155 MJ/kgoutput with 5% of conversion decree.
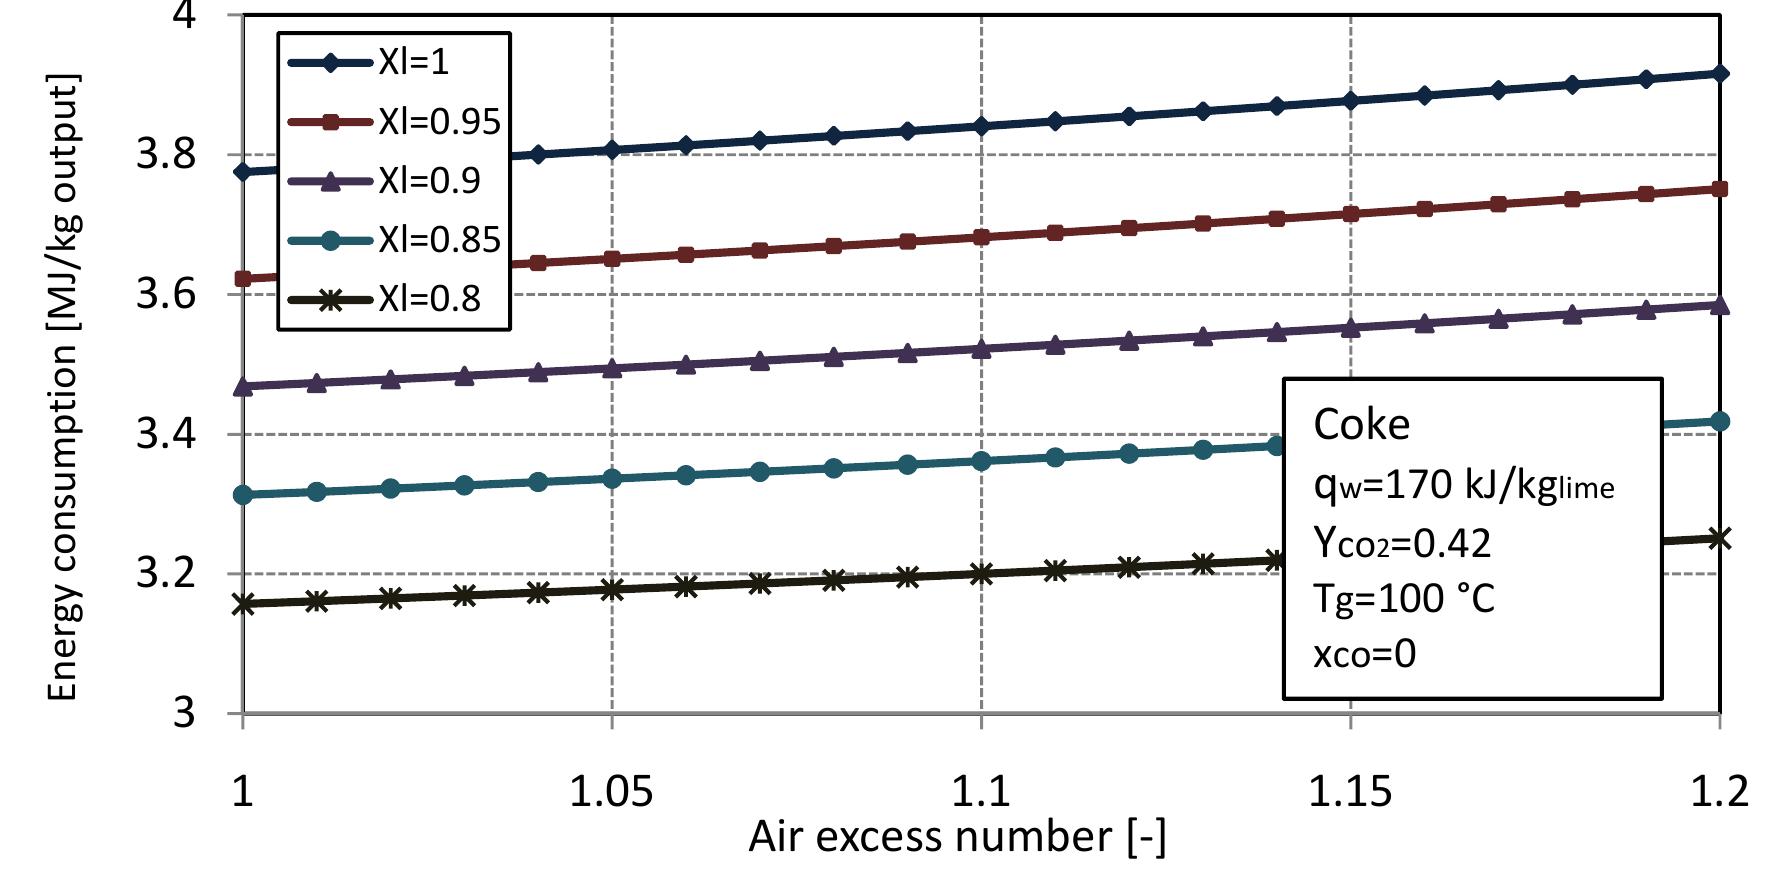
Figure 2.3: Energy consumption for different conversion degrees of limestone with air excess number.
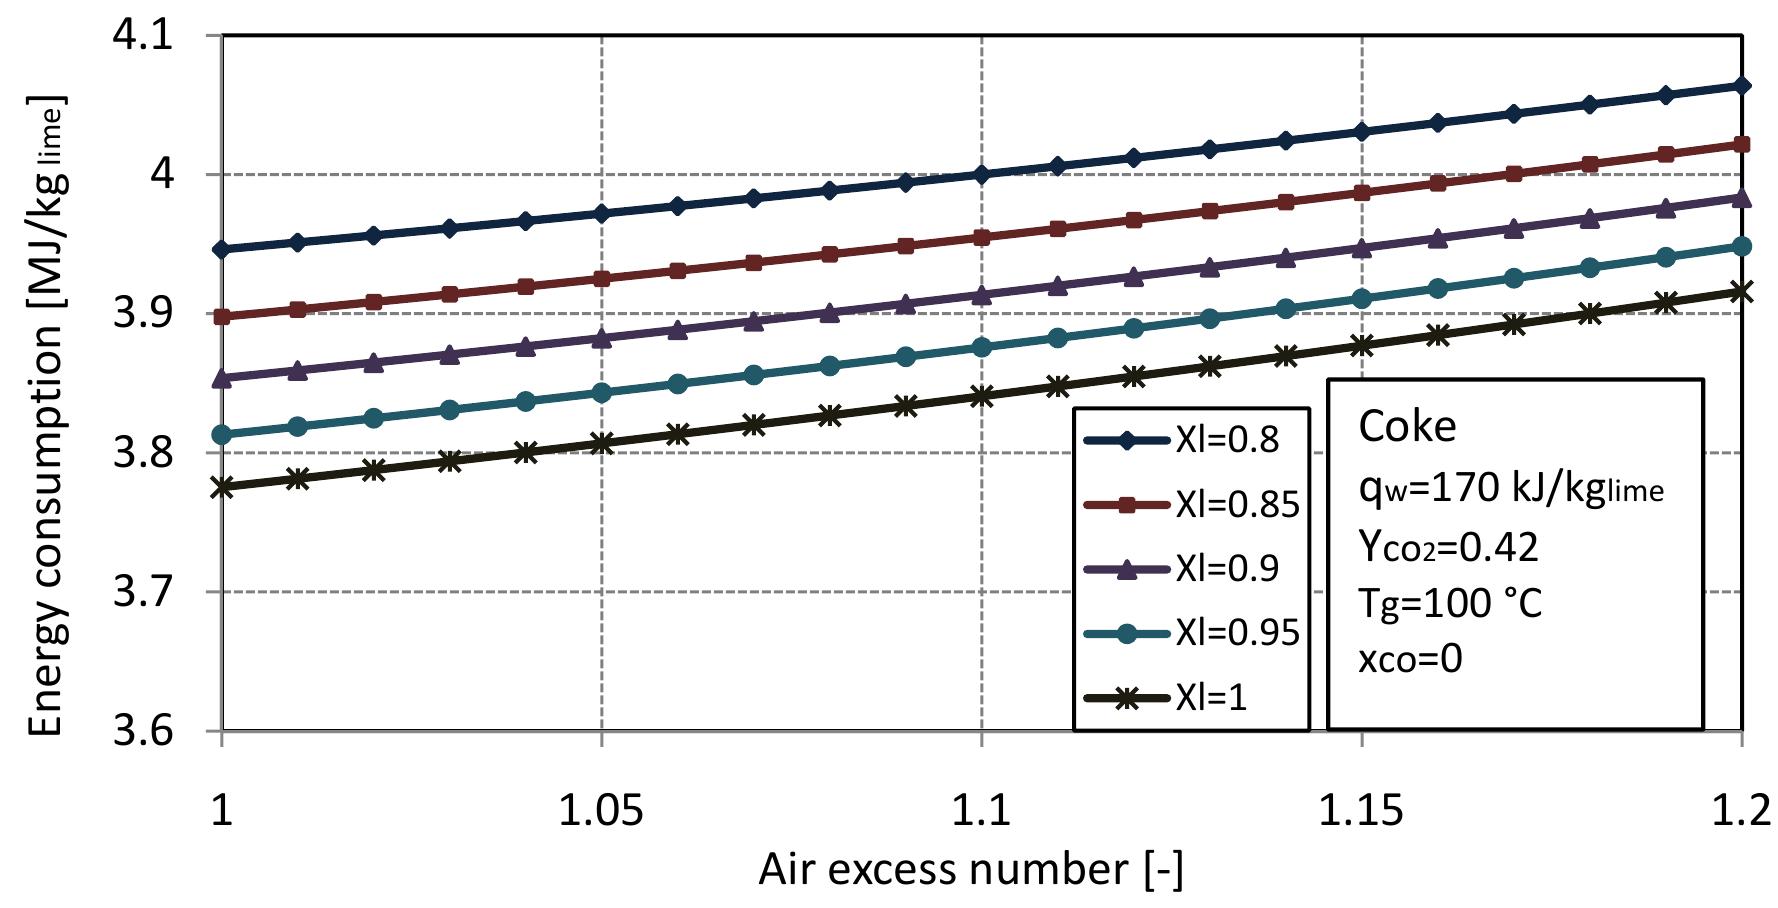
Figure 2.4: Energy consumption per lime with air excess number at different conver- sion degrees of limestone. and increases with the decreasing of the conversion degree. The energy consumption per pure lime at different conversion degrees of limestone with air excess number is shown in Figure 2.4. For the same conditions, the energy consumption per lime is different than the energy consumption per output where the amount of lime increases with increasing conversion degree of limestone so, the en- ergy consumption per pure lime for complete calcination of limestone is the lowest and increases with the decreasing of the conversion degree.
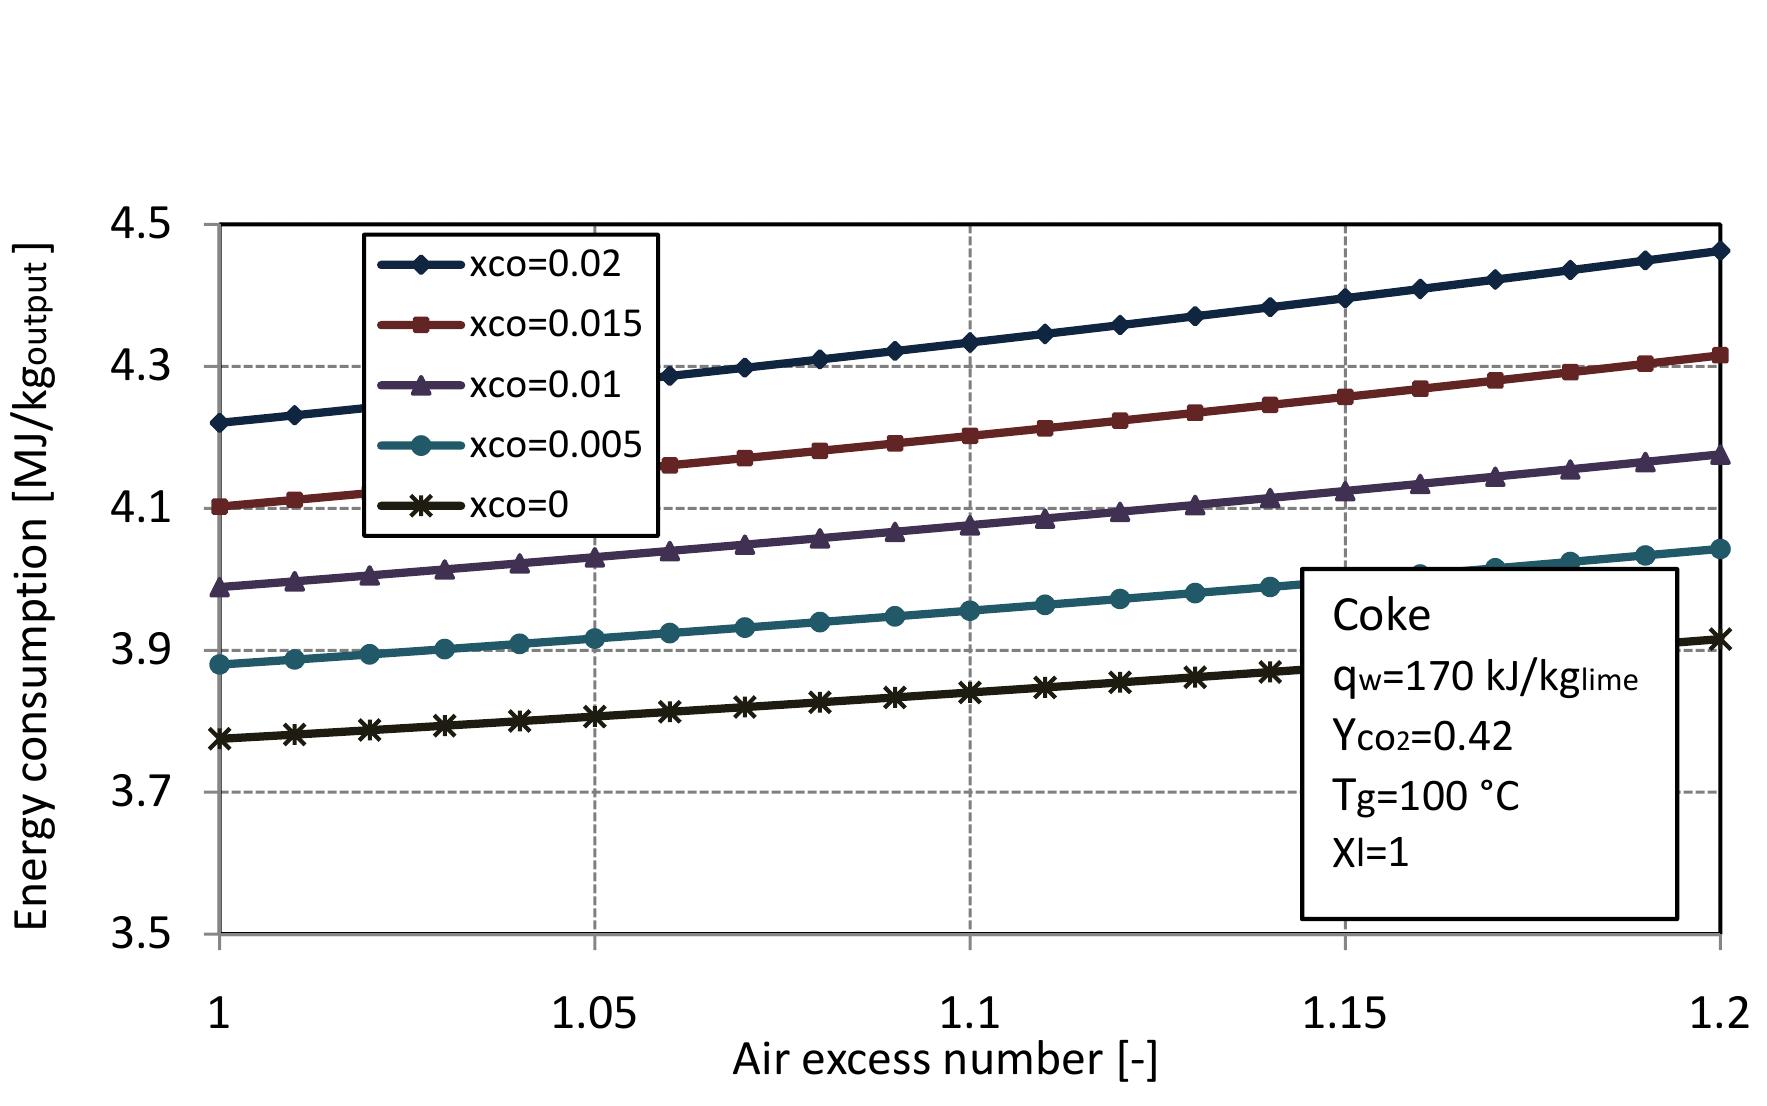
Figure 2.5: Energy consumption for different x,, with air excess number.
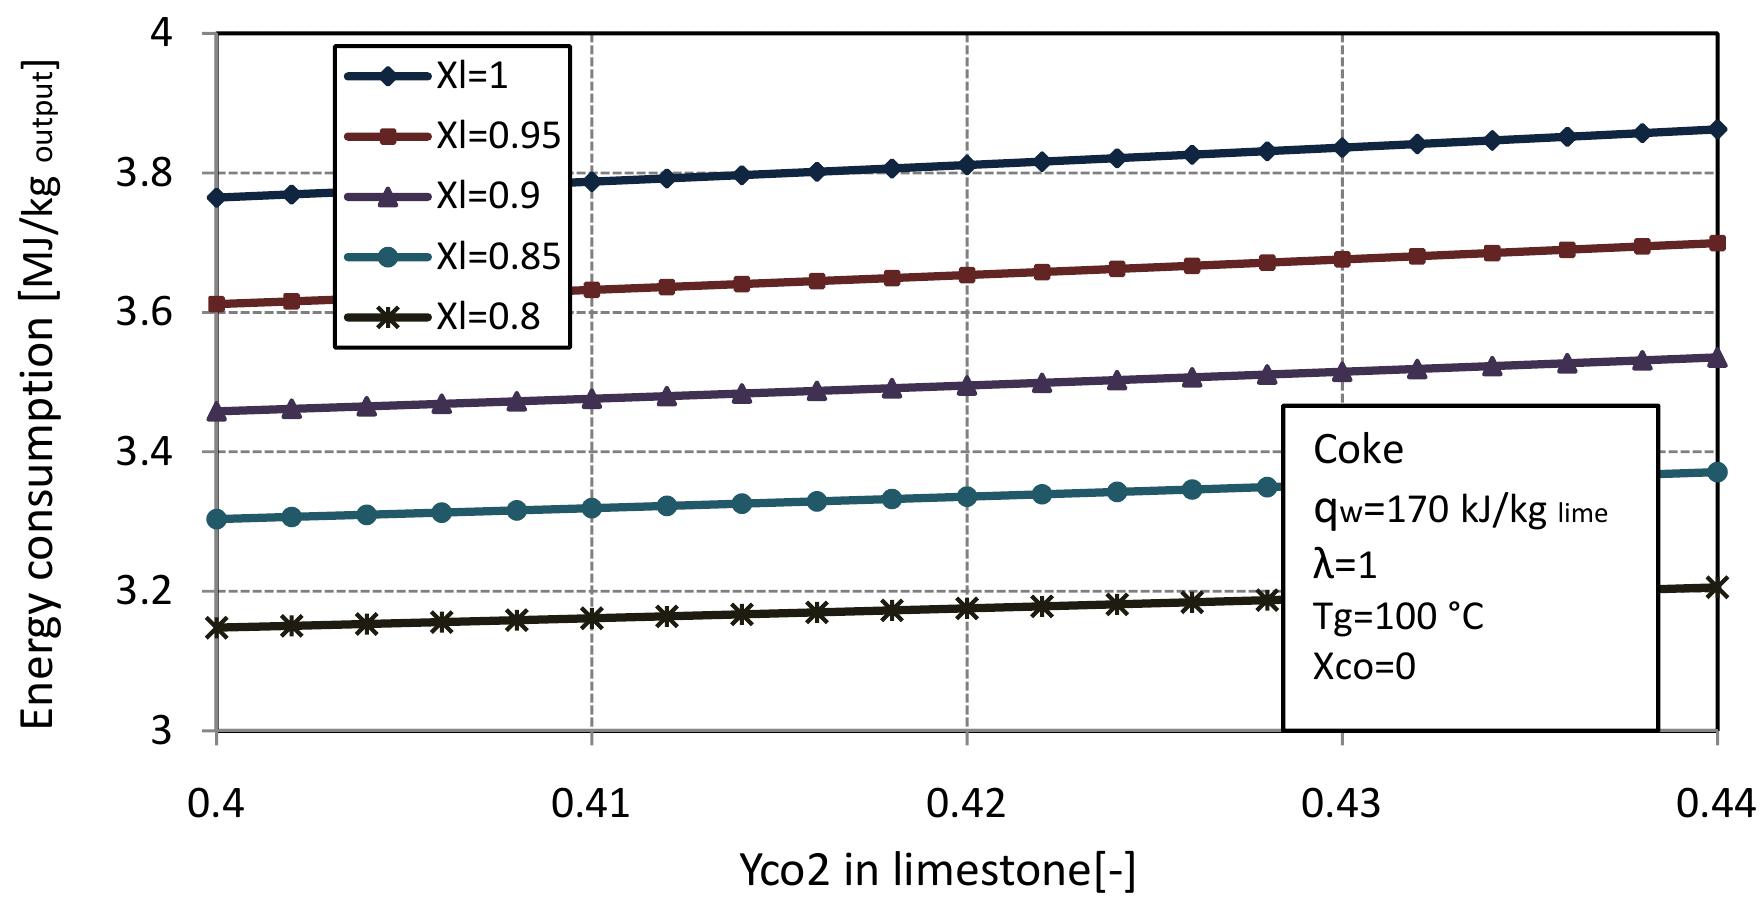
Figure 2.6: Energy consumption for different conversion degree of limestone with CO. mass fraction in limestone.
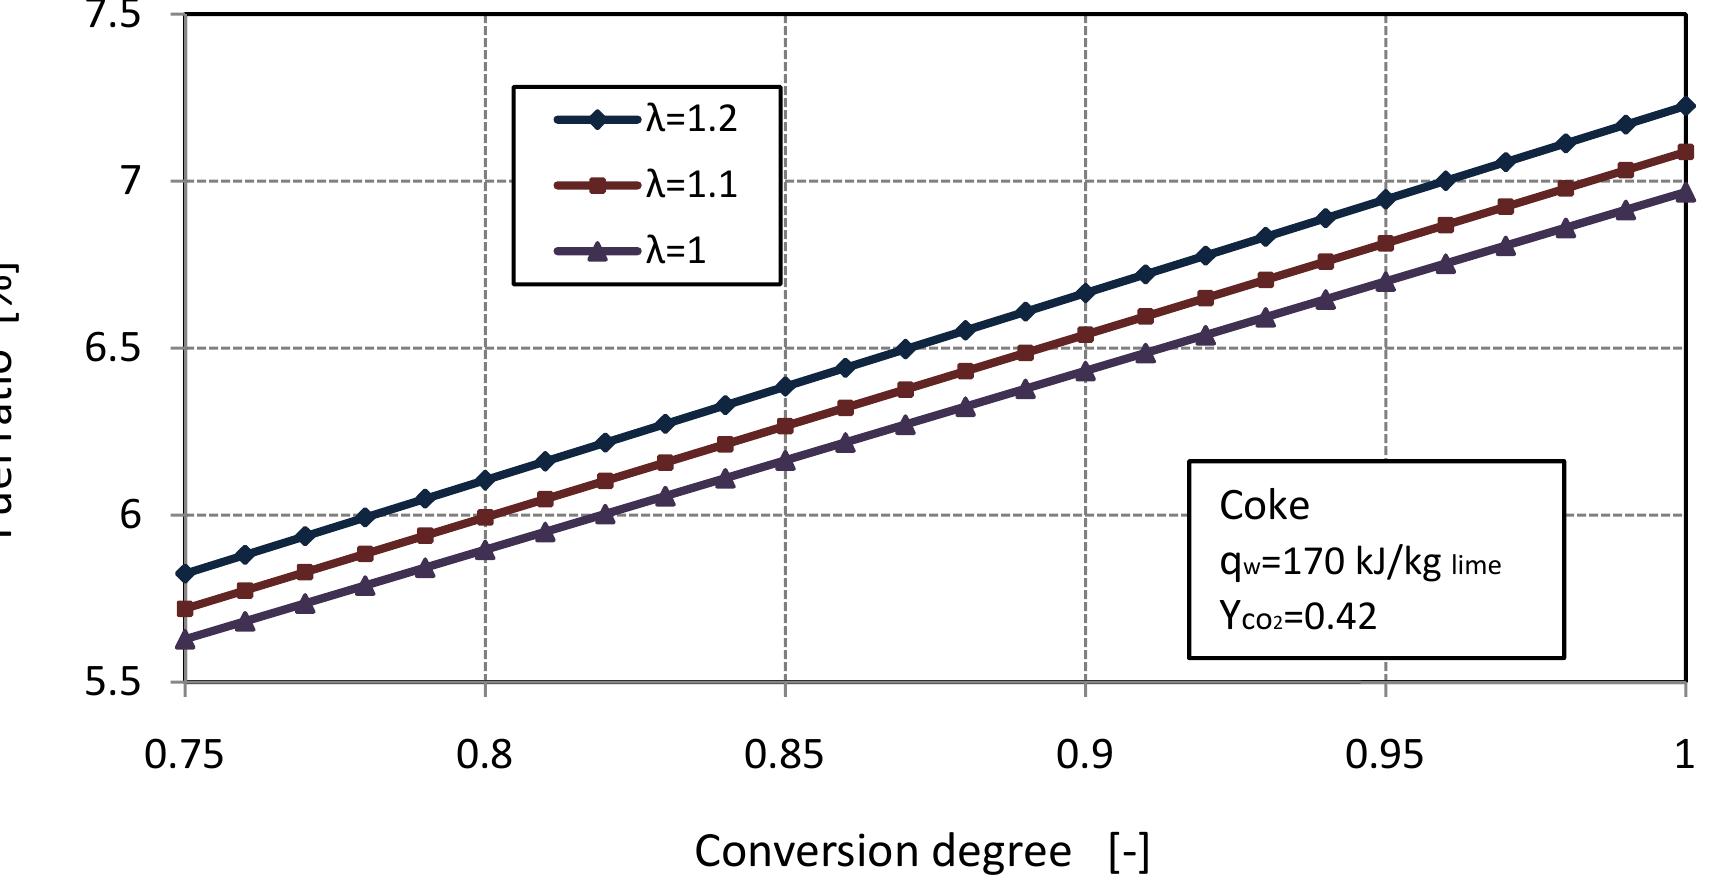
Figure 2.7: Fuel ratio for different air excess number with conversion degrees of limestone. \Vlixed feed lime kilns generally use coke or anthracite or both as fuel in operation. Suitable fuel ratio for the kiln is important to produce high quality of lime and higl concentration of CO» in flue gas and helps to maximize thermal efficiency and avoic excessive operating costs. So we study the fuel ratio for the kiln to determine th« suitable value. Figure 2.7 shows the fuel ratio with conversion degree of limestone at different values of air excess number. With the increase of air excess number, the fue ratio increases linearly with increasing of conversion degree of limestone. According to the assumption, the best value of fuel ratio is a bout 7%, for complete limestone calcination. ‘ore 7f a i yy °F W 1 Pa. “, 1 Pa. r te
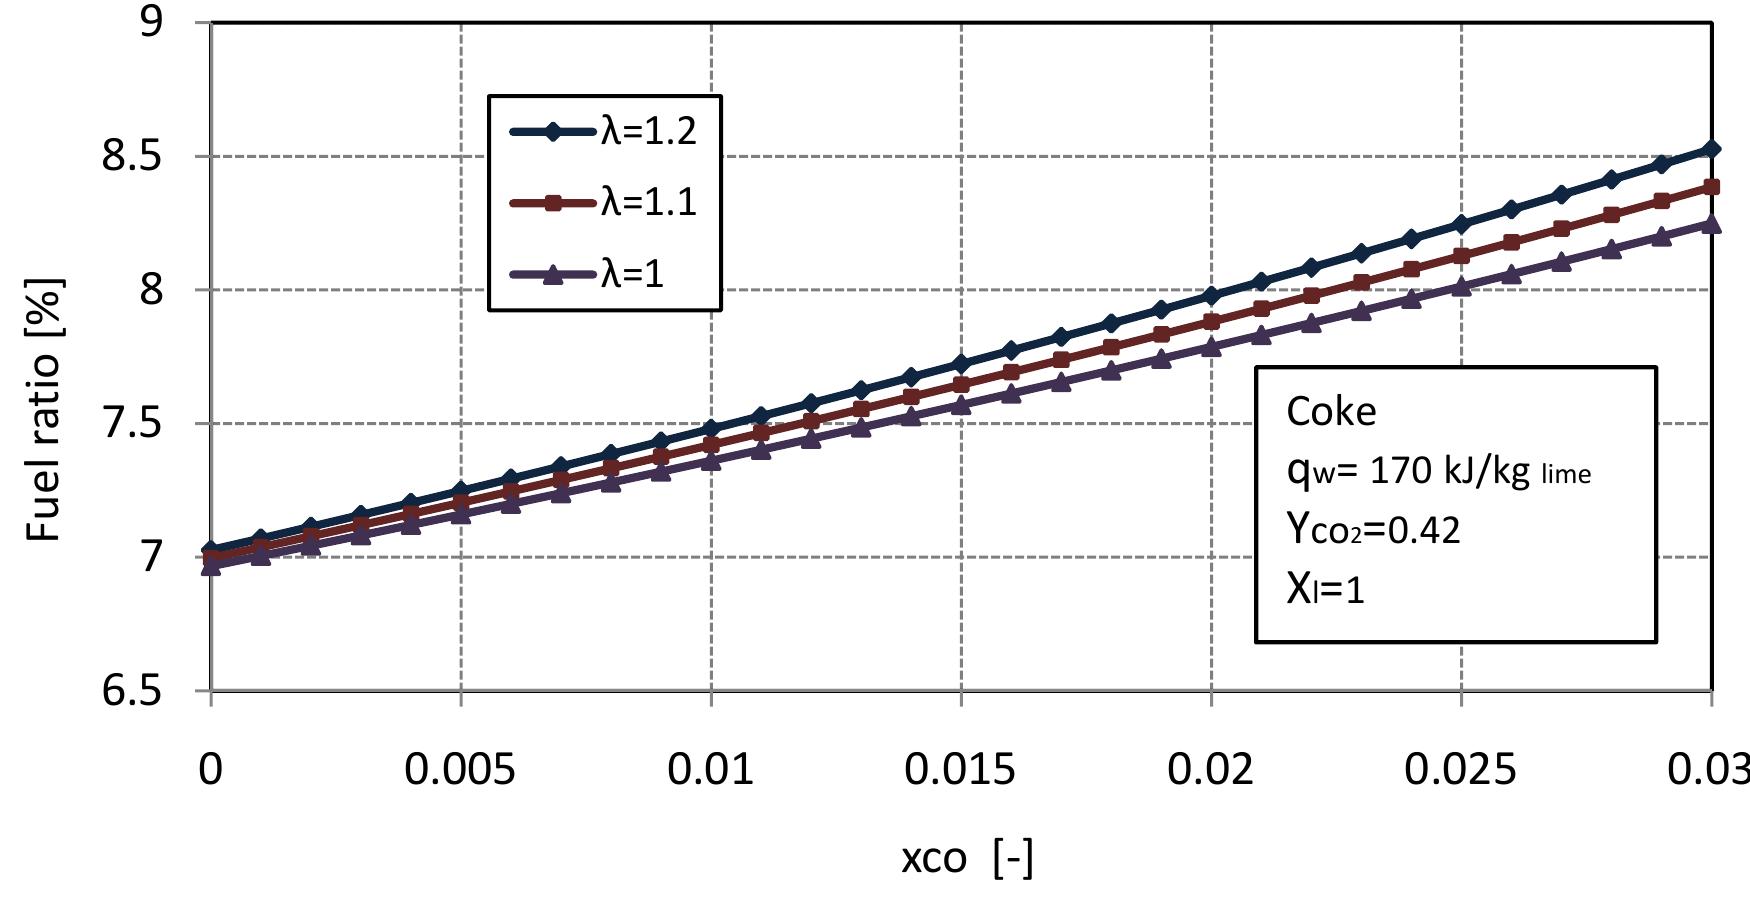
Figure 2.8: Fuel ratio for different air excess number with volume fraction of co in flue gas. oxygen, the carbon dioxide reacts with fuel to produce CO. Suitable fuel ratio would result in at lower concentration of CO in flue gas. Figure 2.8 shows the fuel ratio in dependence on the air excess number and volume fraction of CO in flue gas at complete calcination of limestone. For the previous assumption of exit temperatures and heat loss by the wall, the CO content in flue gas increases with fuel ratio. It can seen from Figure 2.8, that the lowest value of CO in flue gas is at the fuel ratio of 7%. Figures 2.7 and 2.8 indicated that, the fuel ratio 7% is the best value for high quality of lime and low concentration of C’O in flue gas.
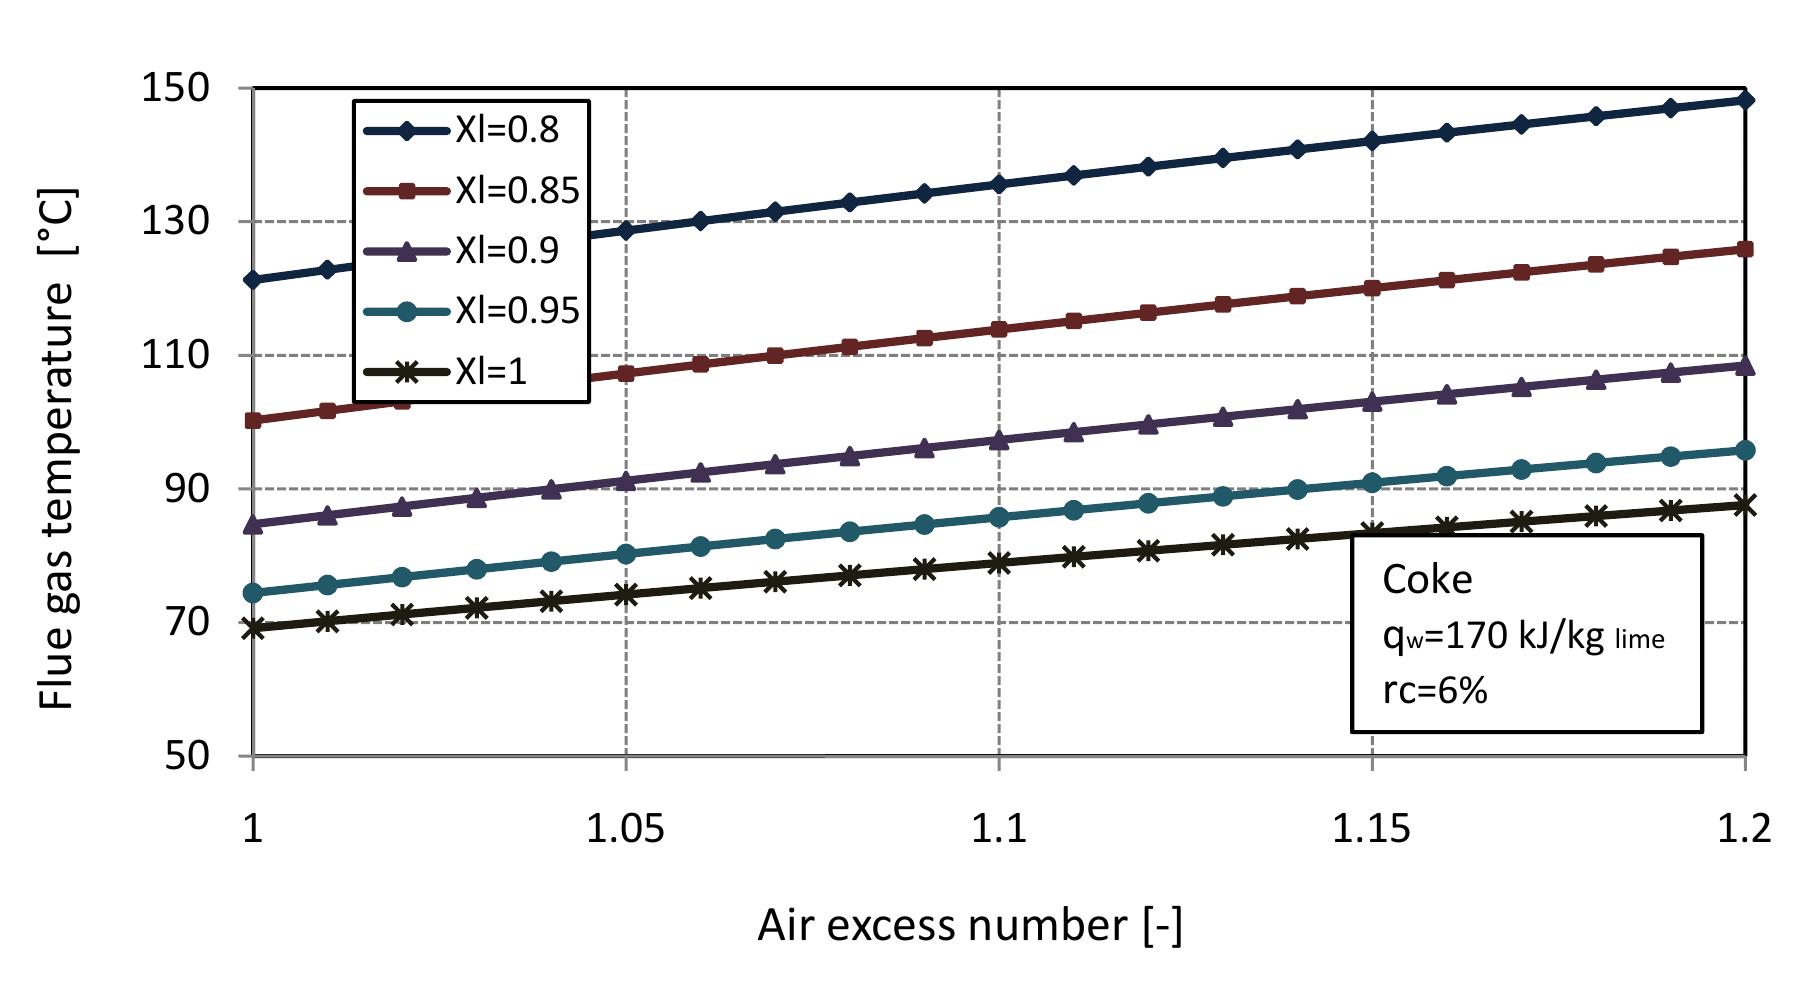
Figure 2.9: Flue gas temperature for different conversion degrees of limestone with air excess number.
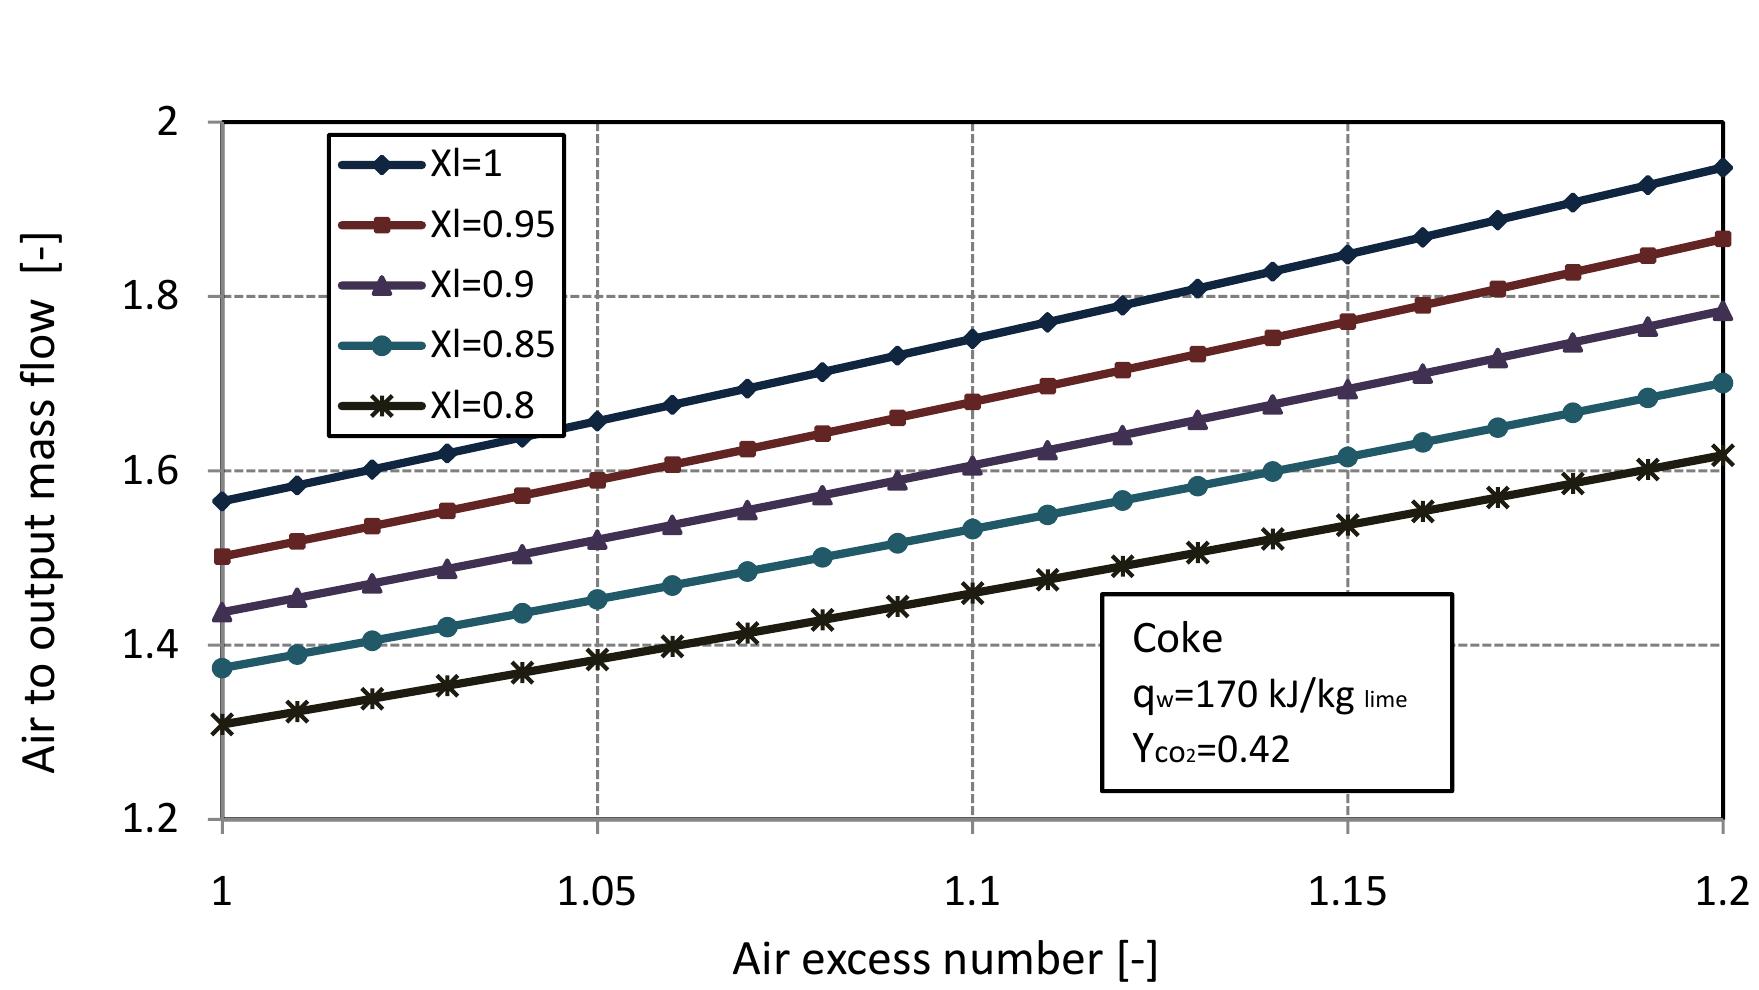
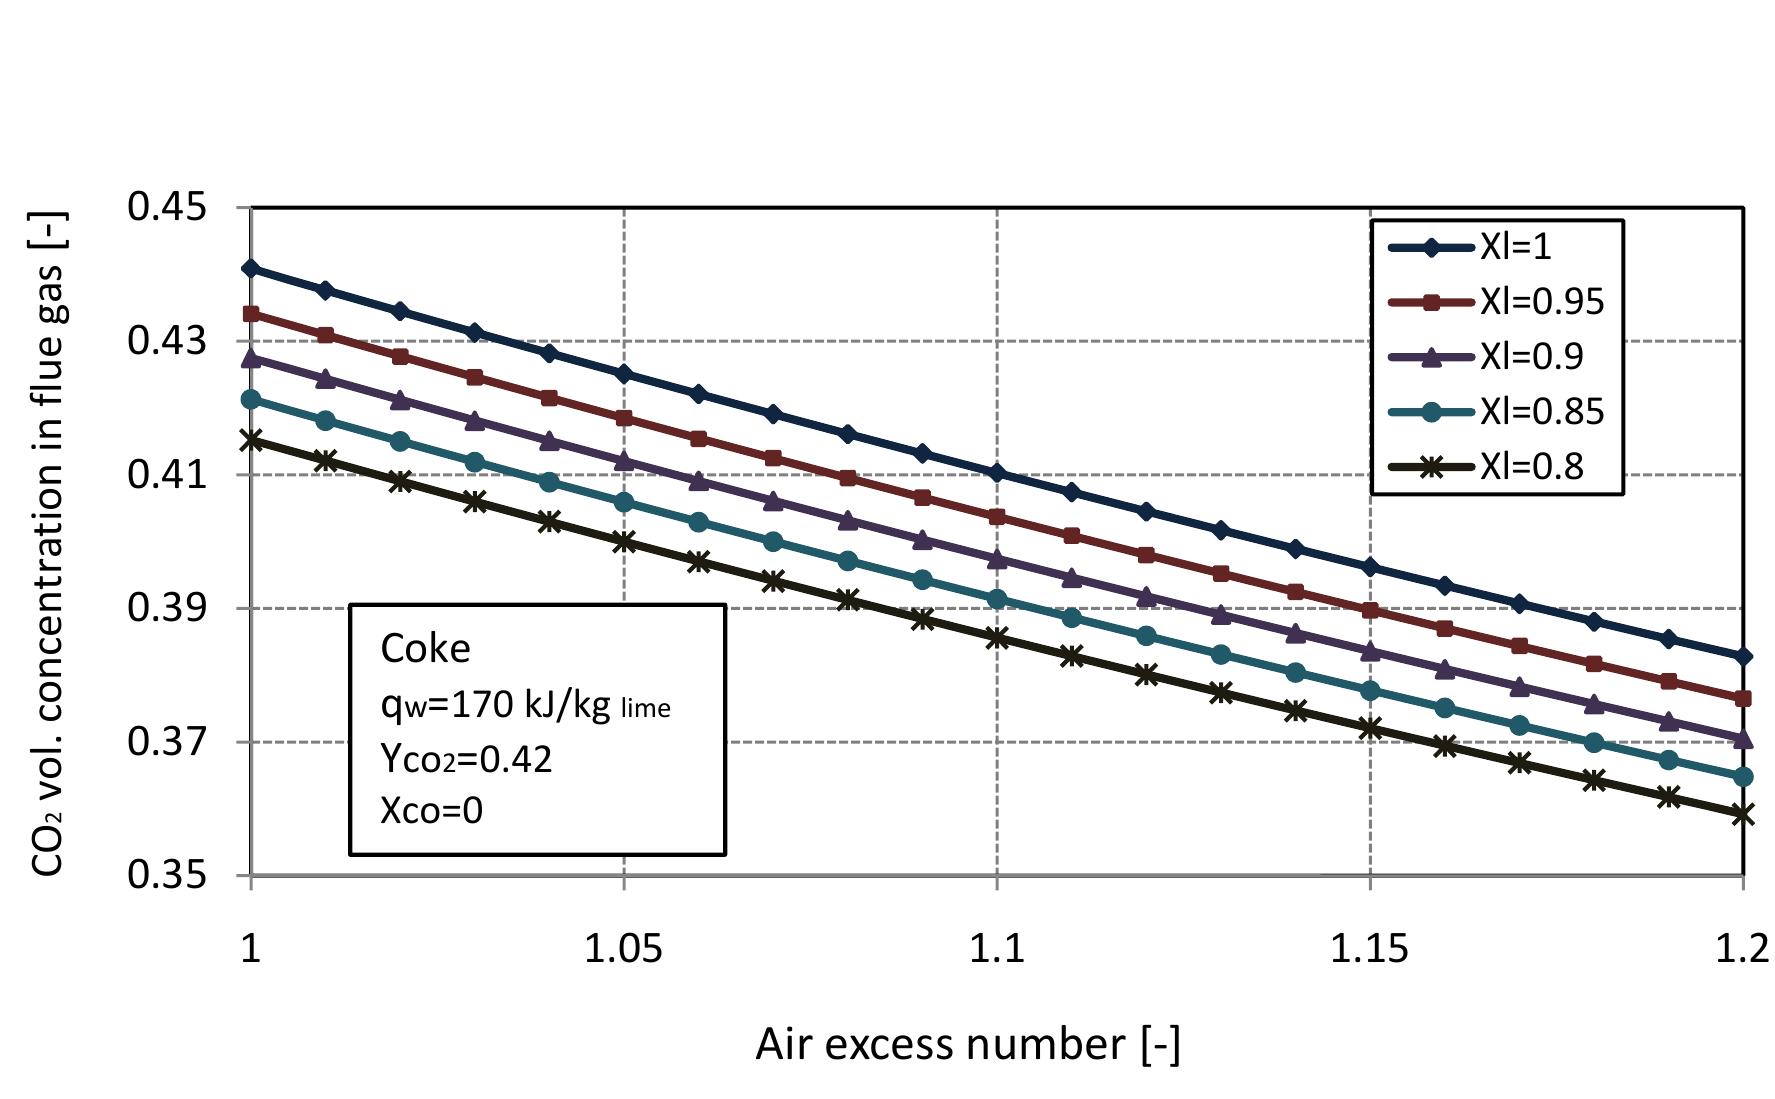
Figure 2.11: Volumetric concentration of CO in flue gas with air excess number at different conversion degrees of limestone.
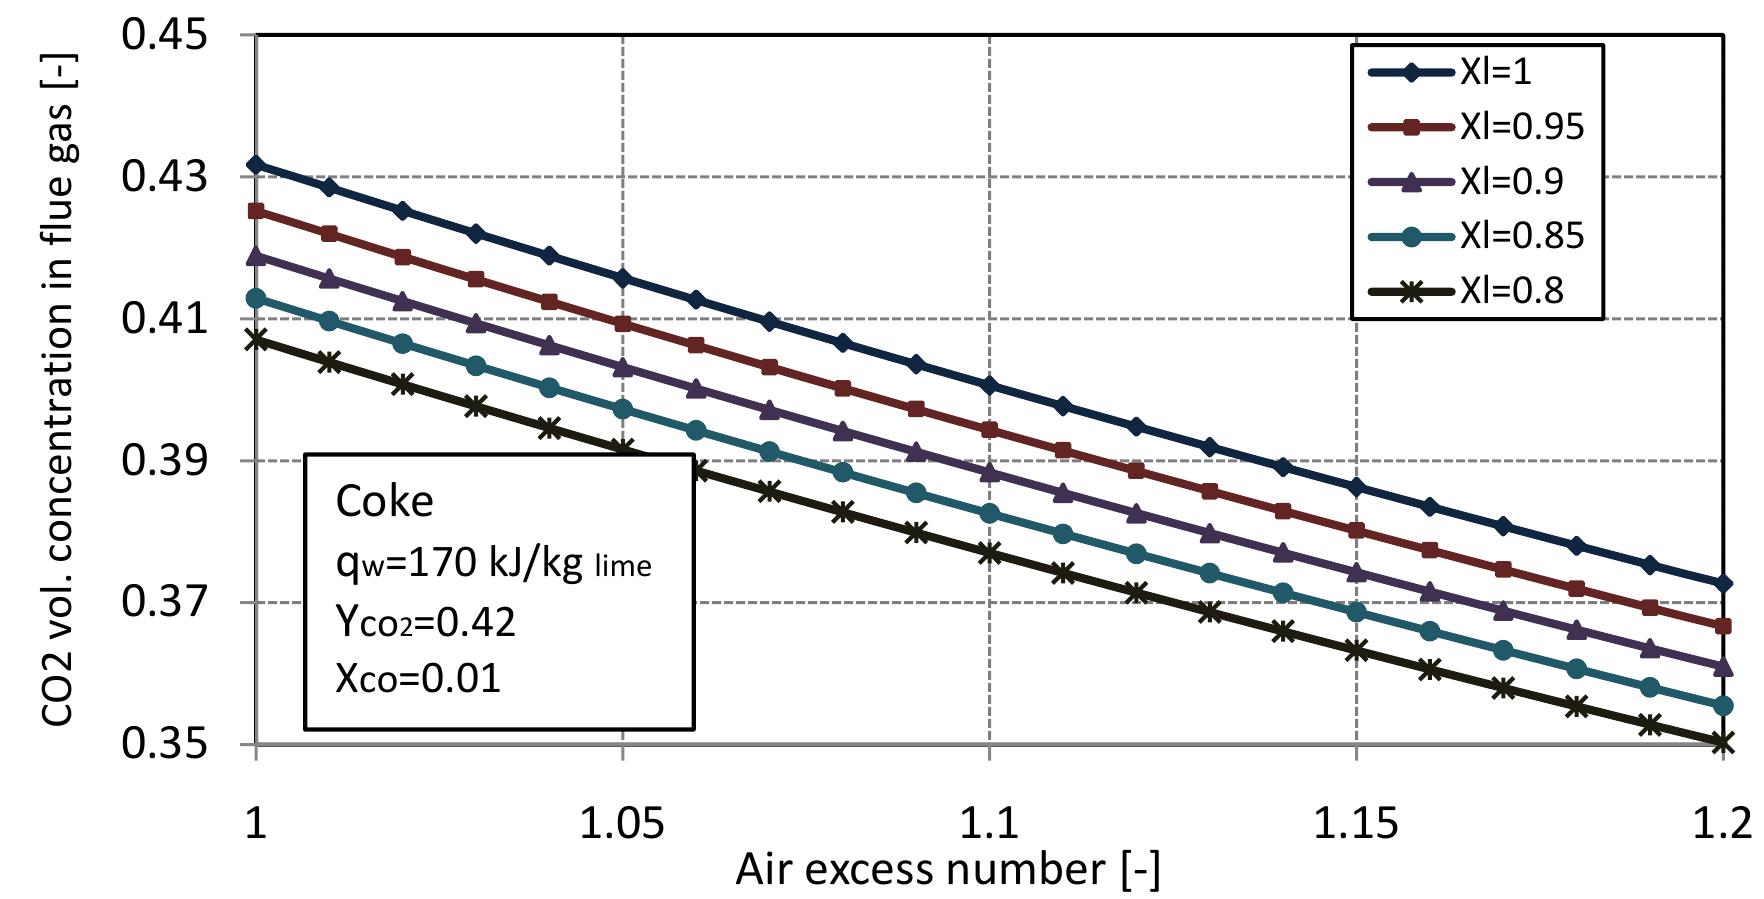
Figure 2.12: Volumetric concentration of CO2 in flue gas with air excess number.
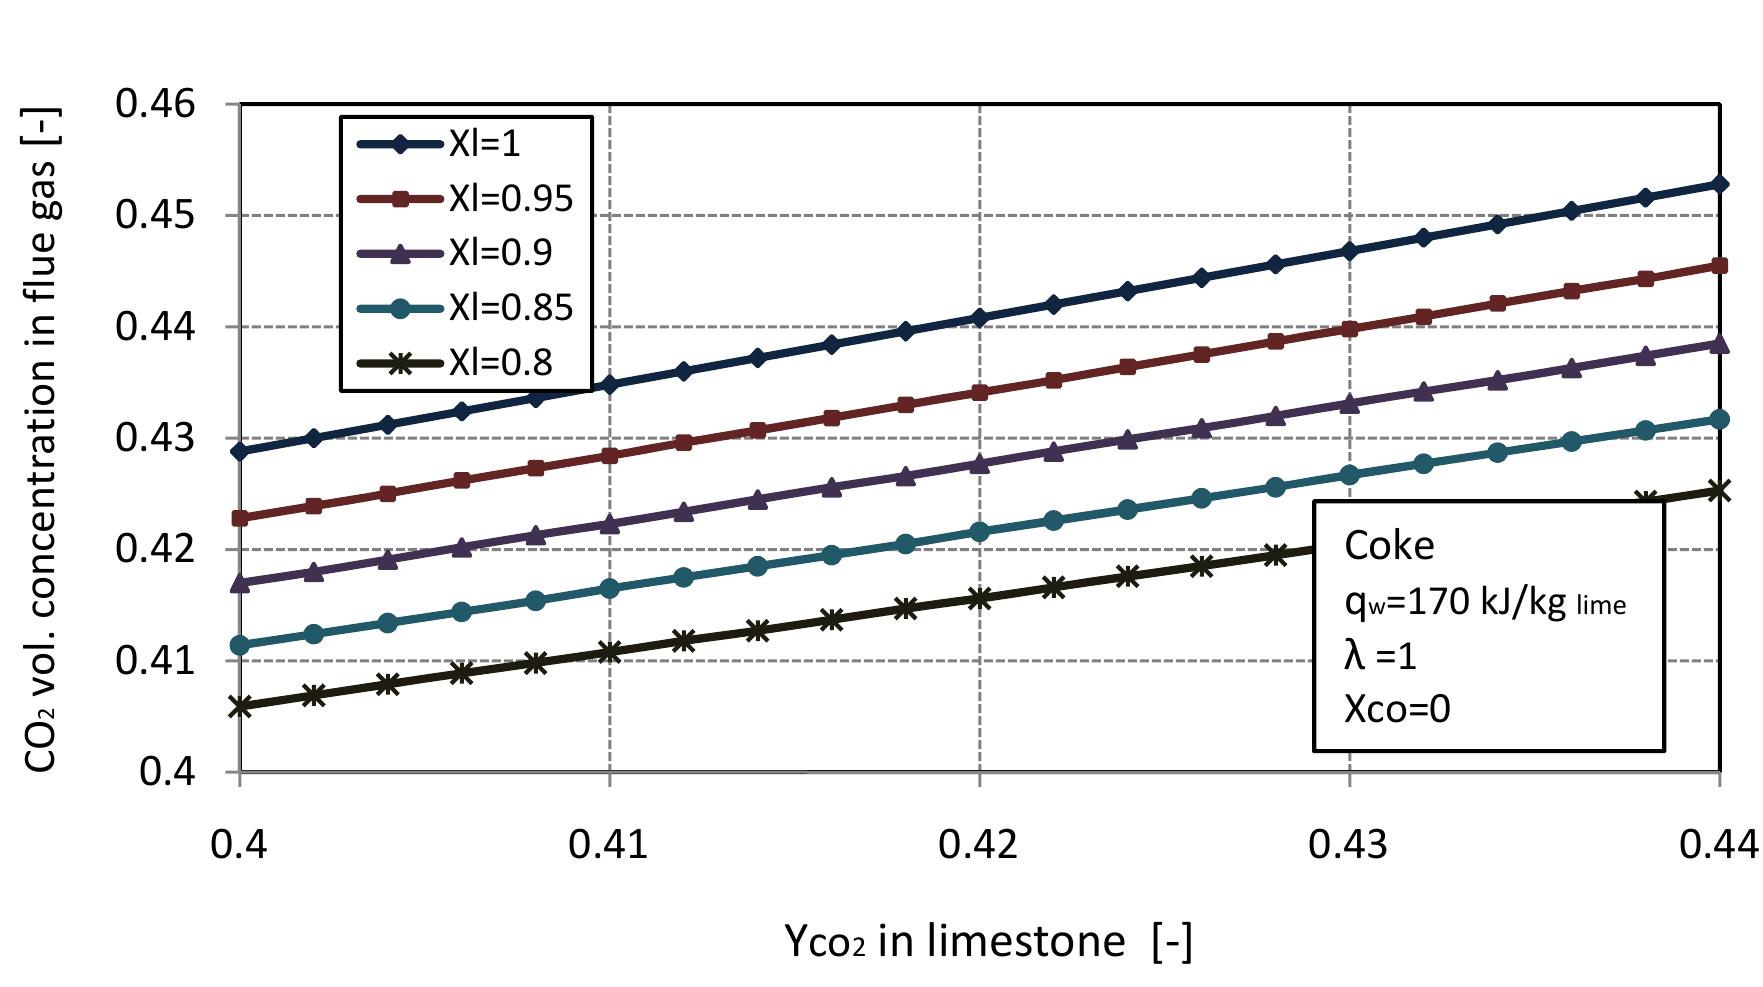
Figure 2.13: Volumetric concentration of C'O, in flue gas with CO, mass fraction in limestone at different conversion degrees of limestone.
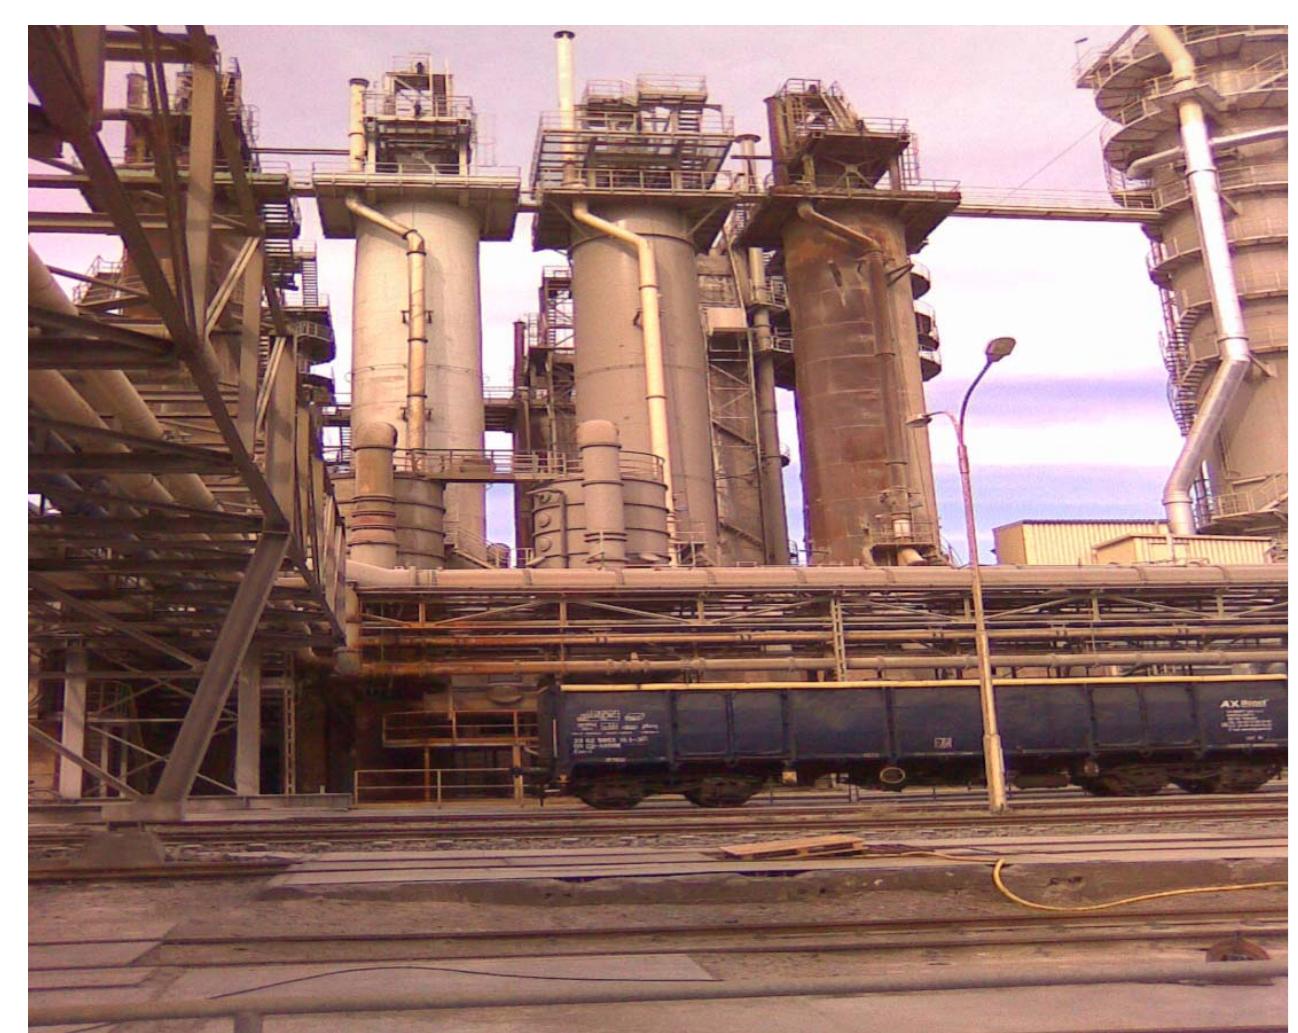
Figure 3.1: Mixed feed lime kilns.
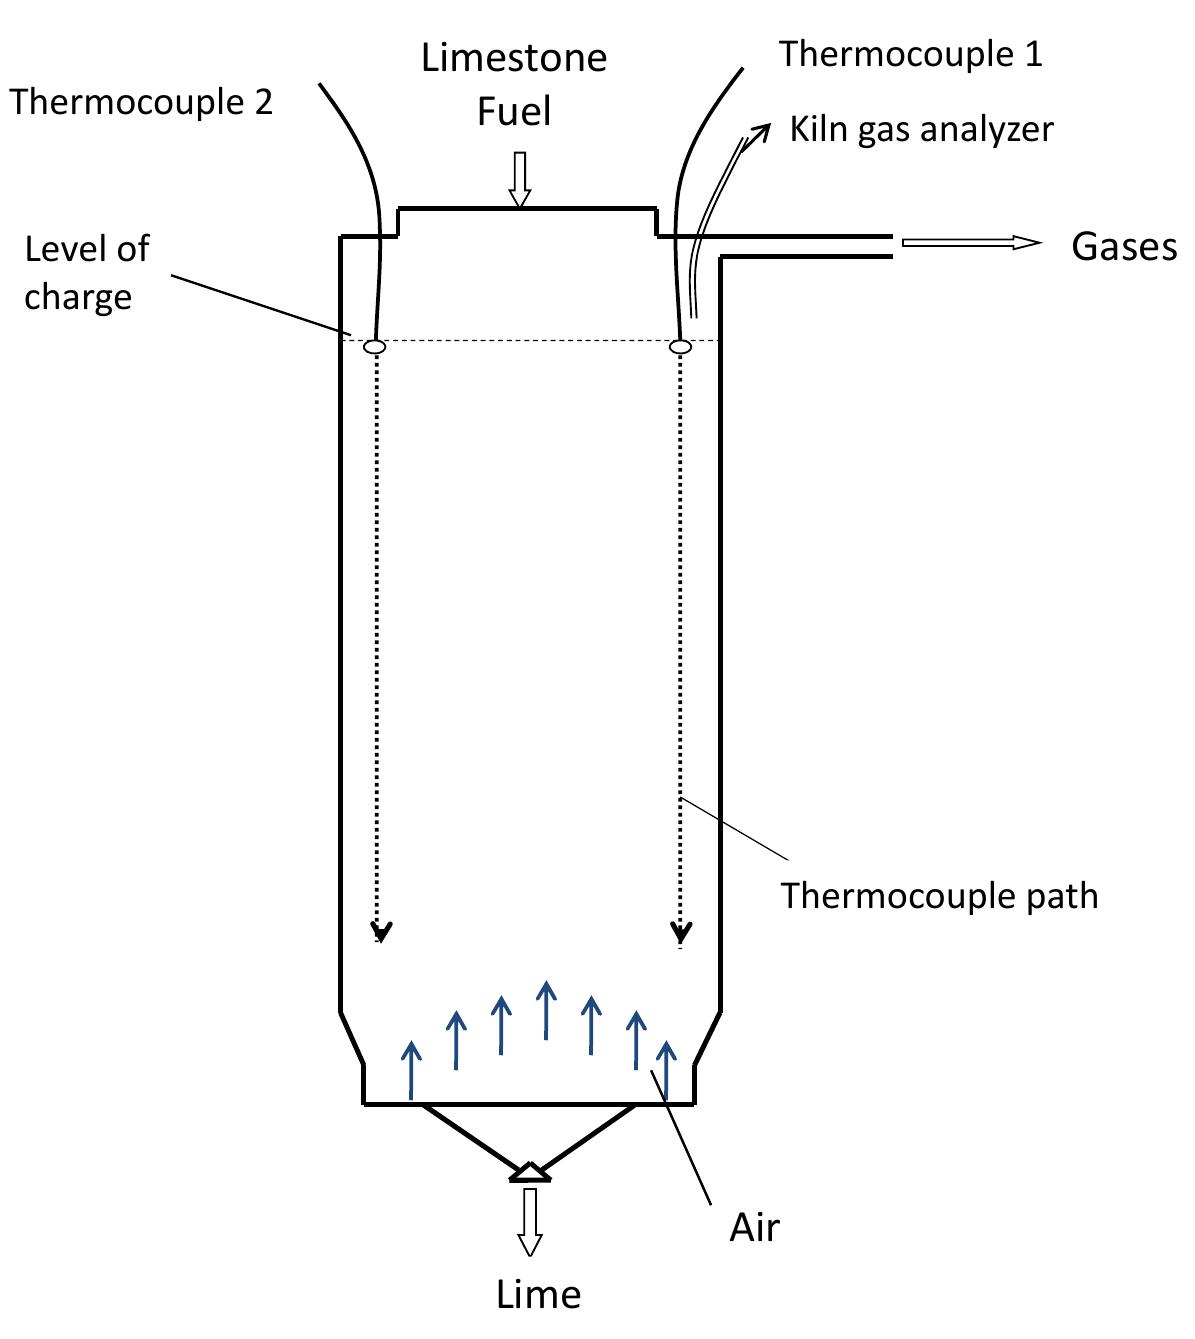
Figure 3.2: Measurement of temperature profile and kiln gas composition.
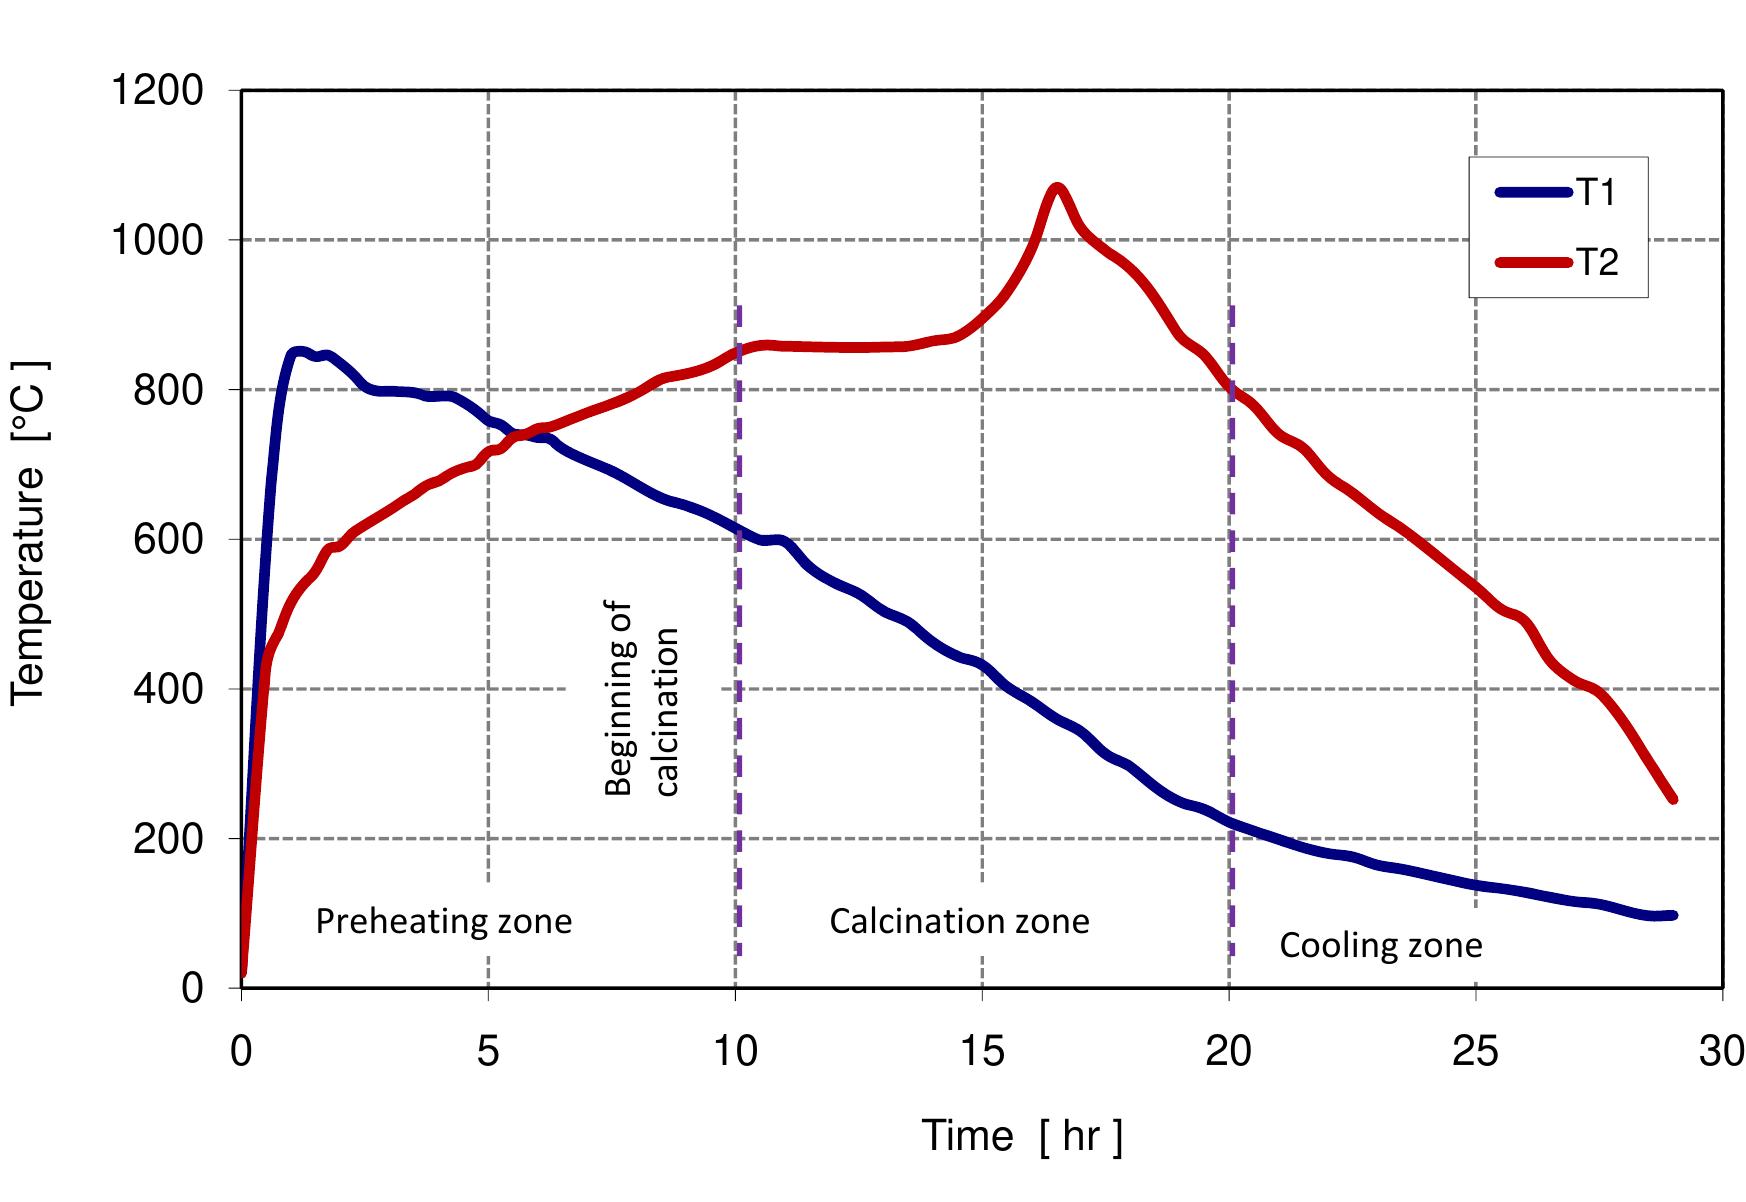
Figure 3.3: Measured temperature profile.
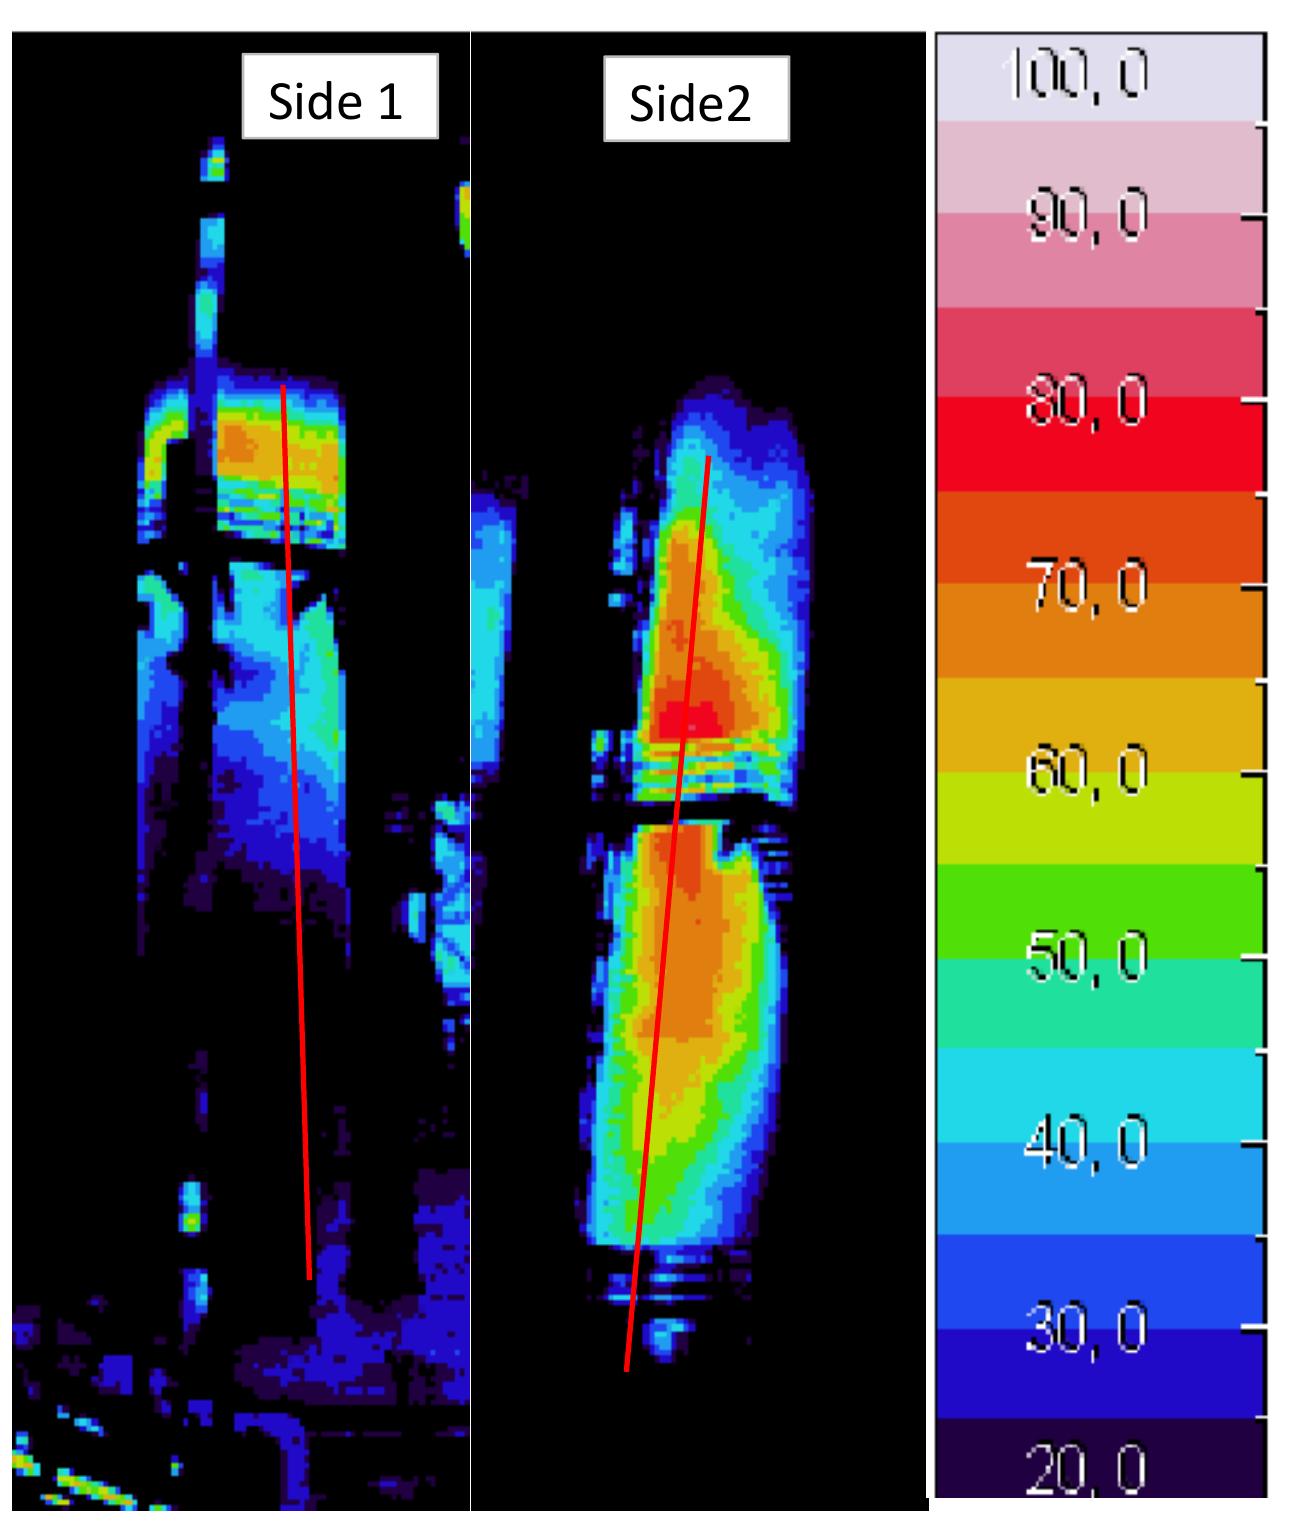
Figure 3.4: Infrared image of the kiln temperature.
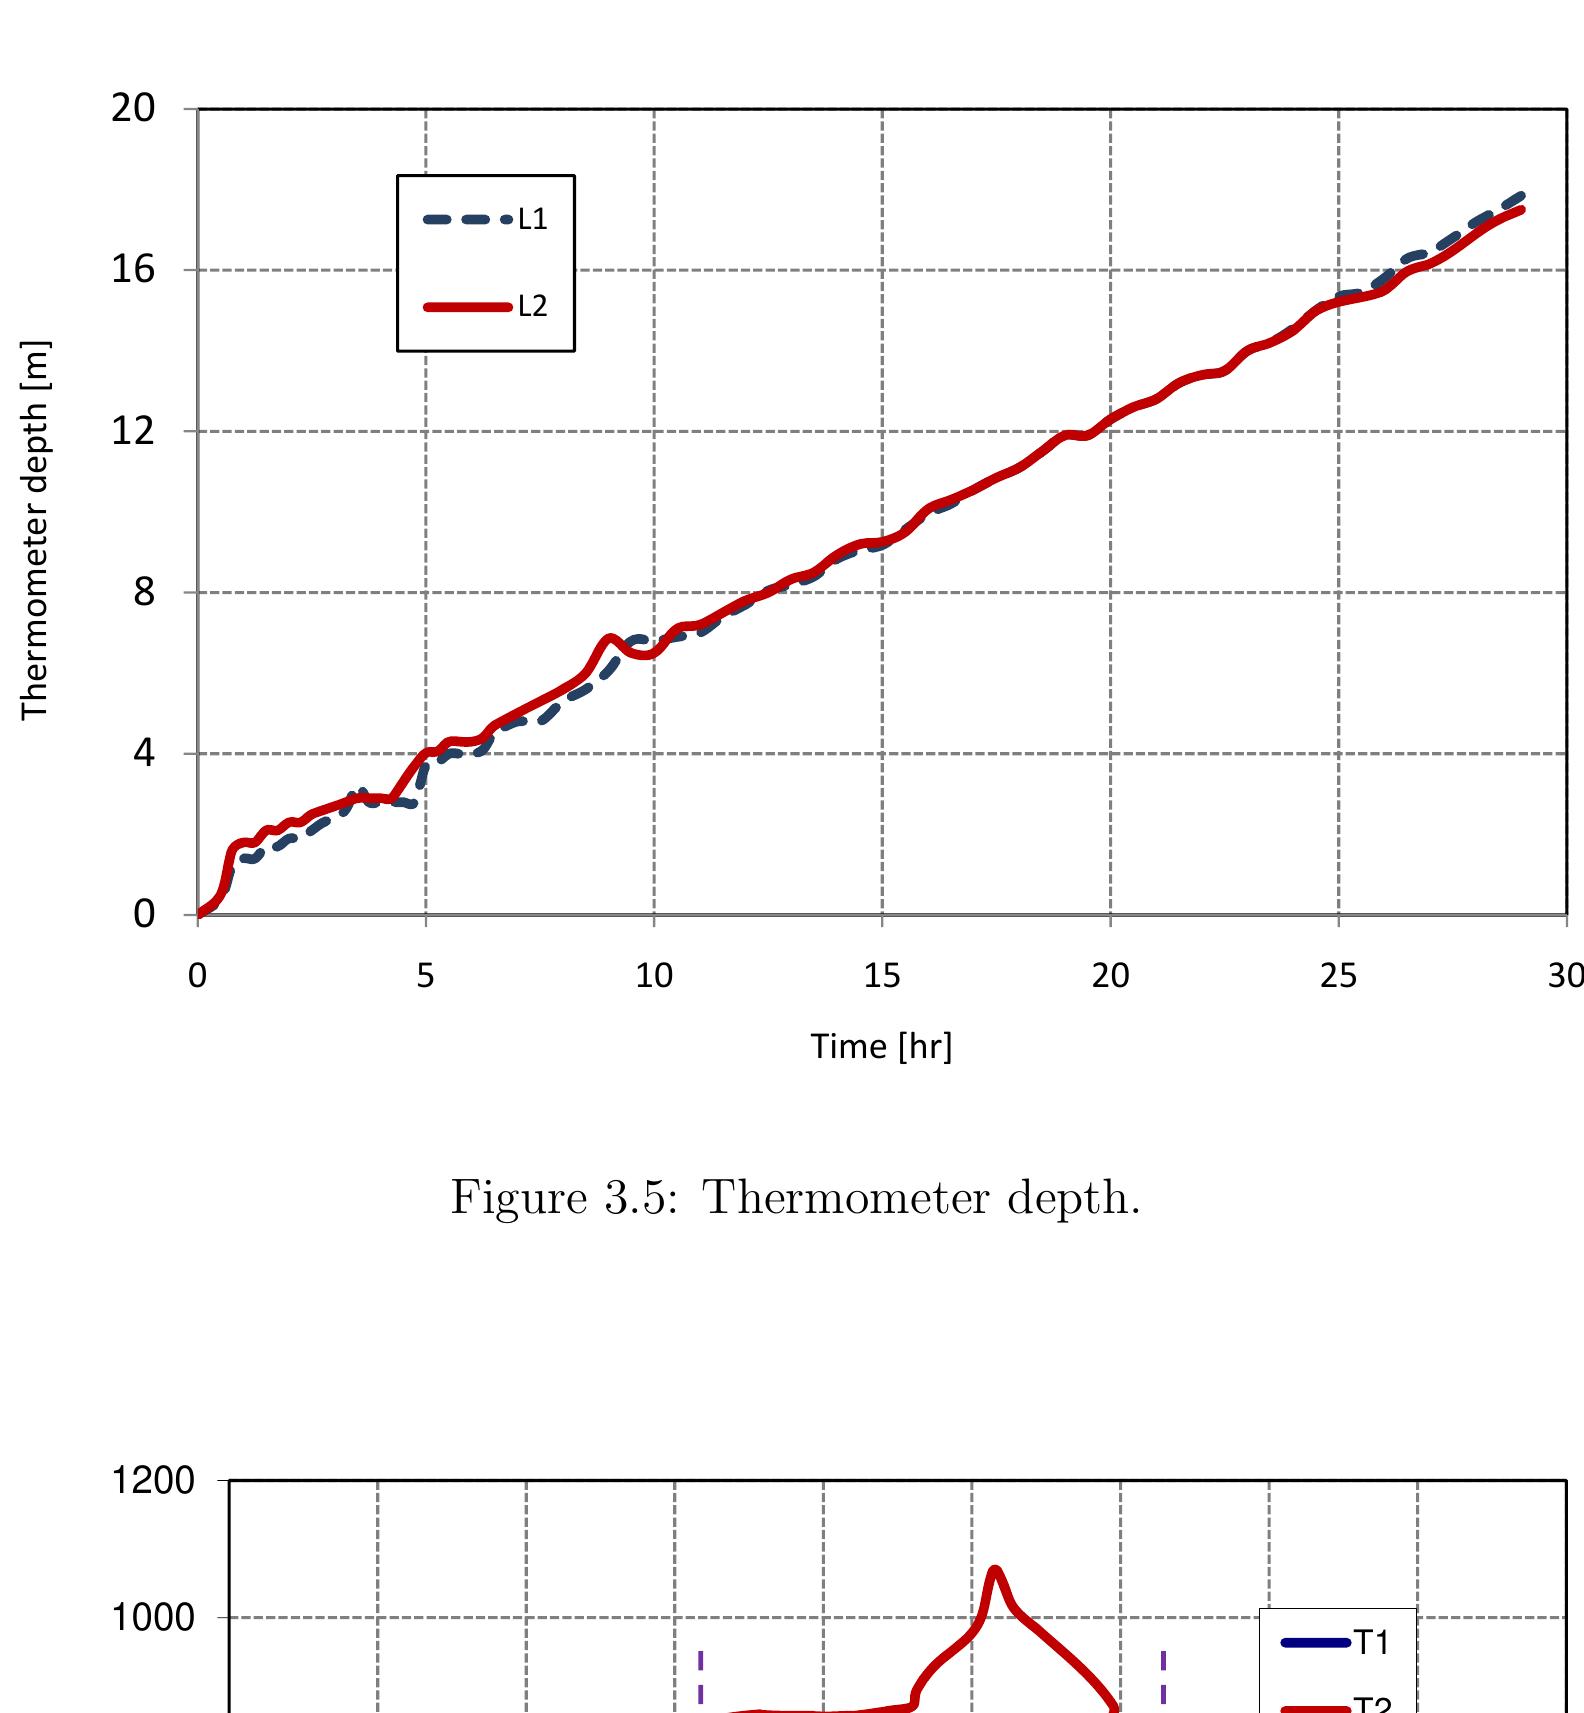
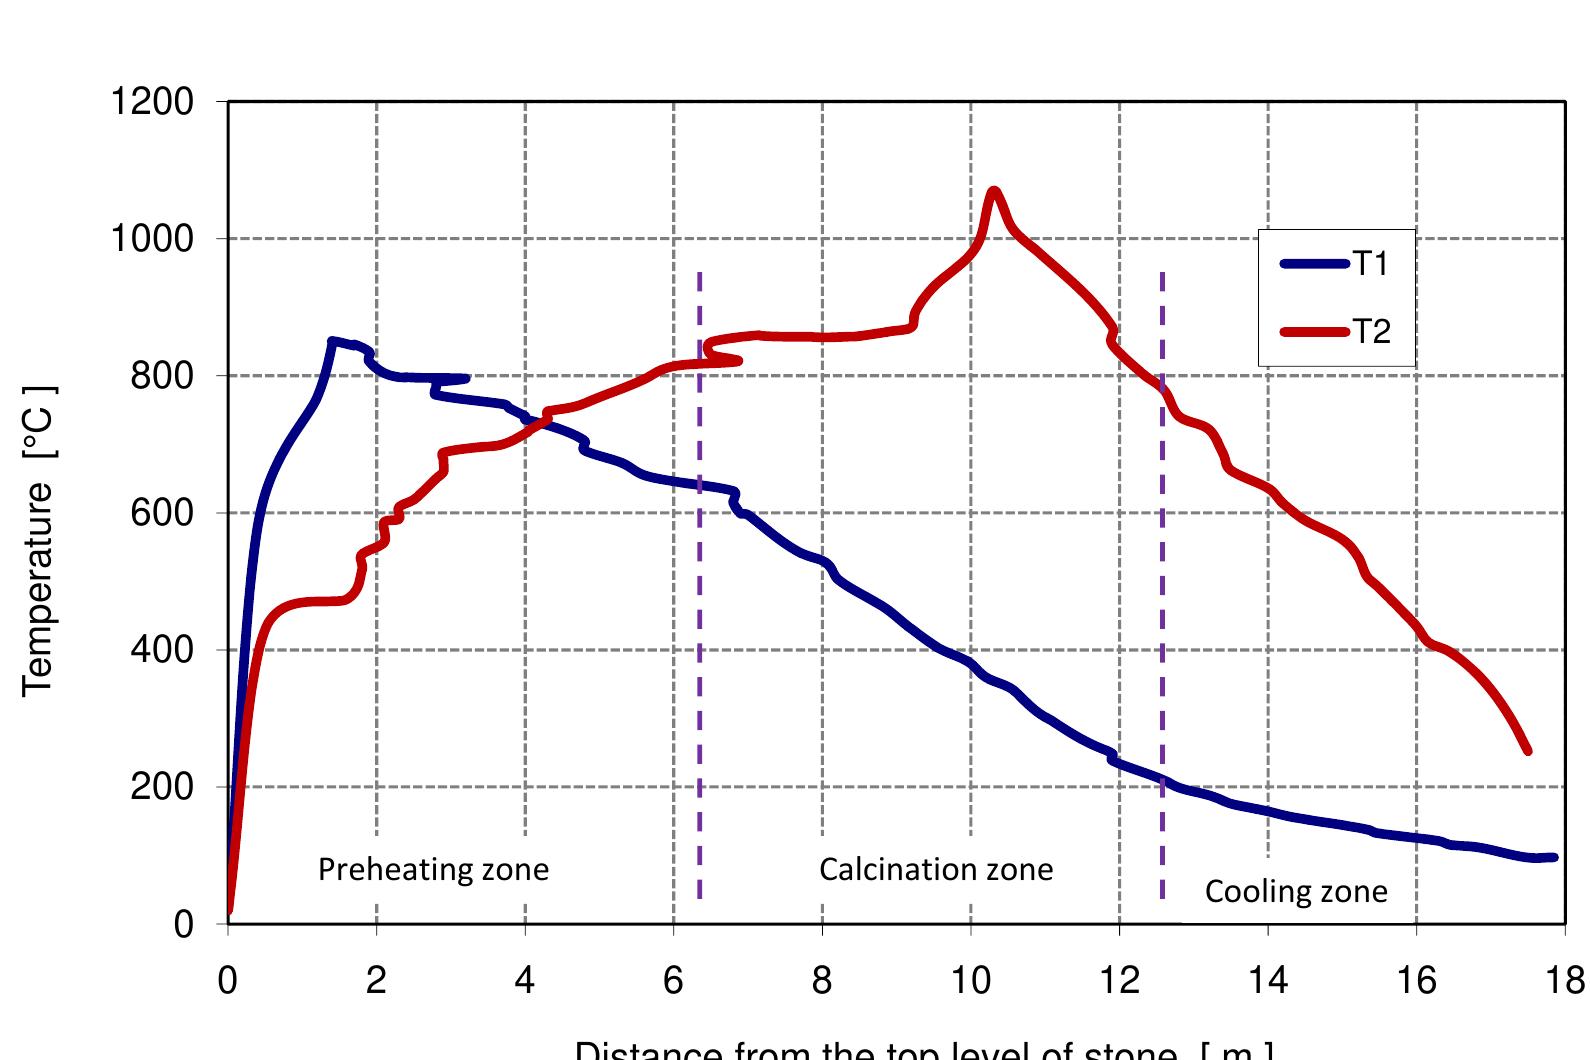
Figure 3.6: Measured temperature profile.
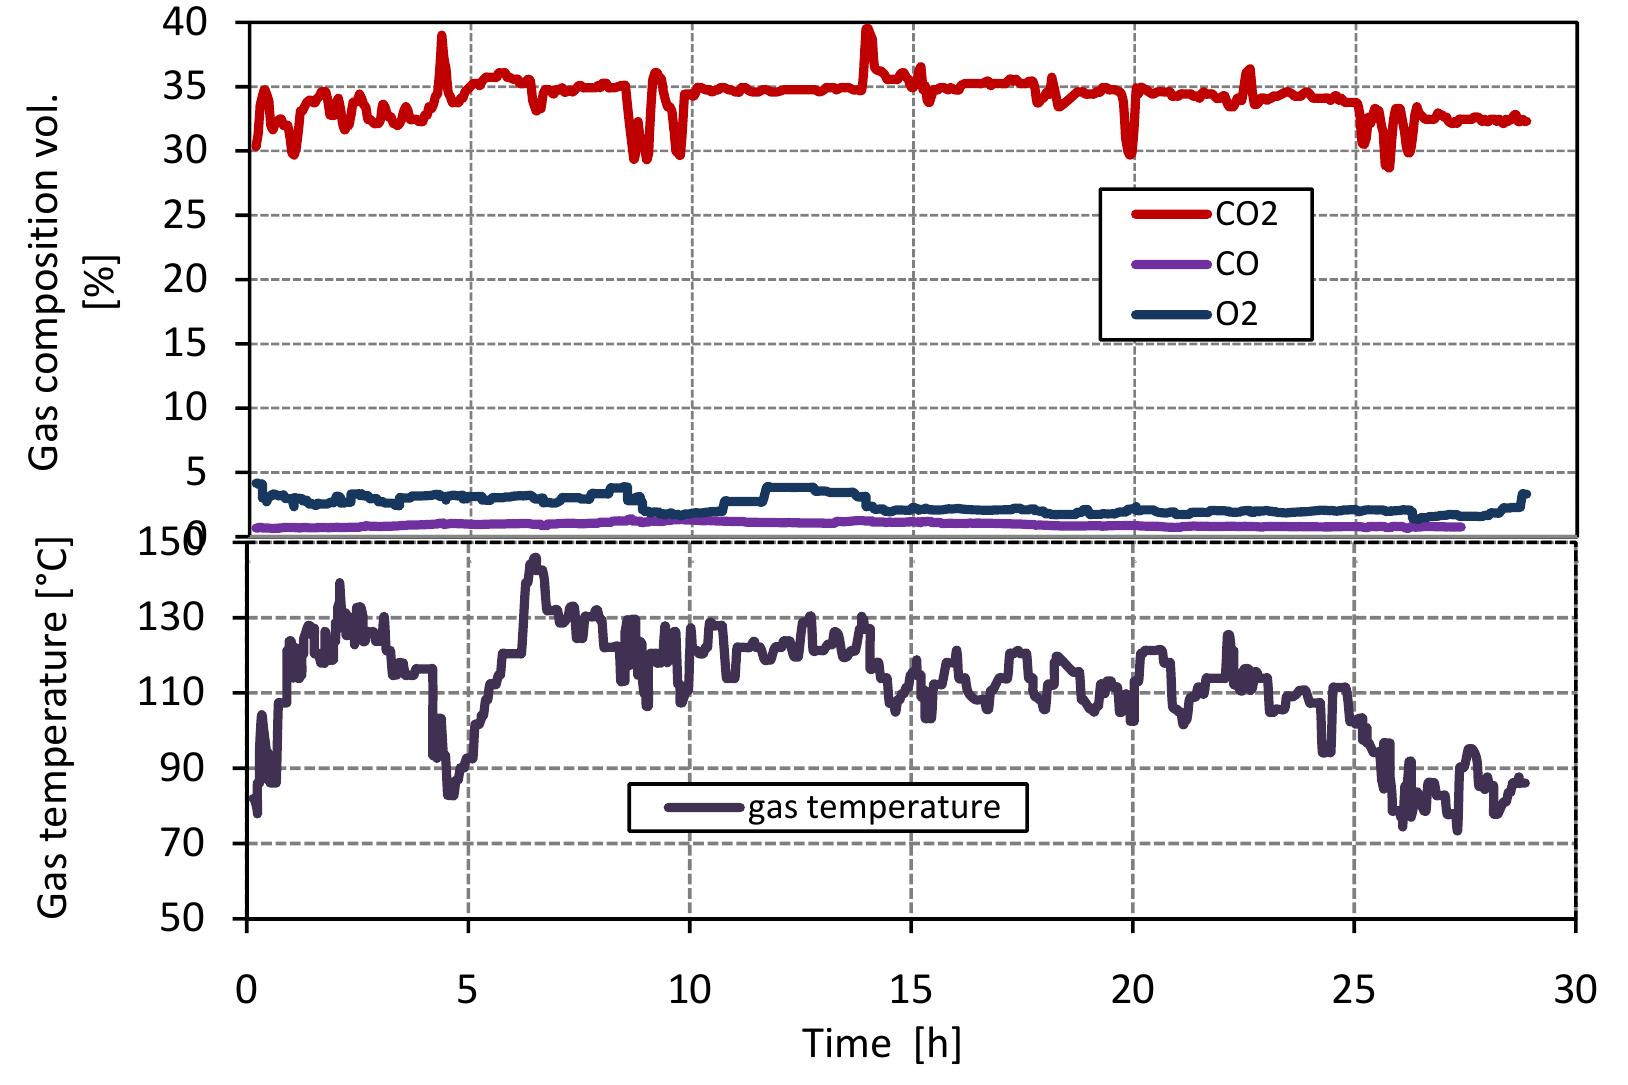
Figure 3.7: Composition of kiln gases. In a soda ash plant, the coke and anthracite are used as a fuel for the lime kiln 1 produce the high concentration of CO, in flue gas required for the process but thes fuels also produced CO. Figure 3.7 shows the results of Op, CO and CO, conce1 tration of flue gas measured at the top of the kiln against time. The concentratic of COz is at about 30 to 40%, but mostly at about 35%, This value is lower tha the amount required in soda process. These two factors can be explained with tl following reasons: (1) the content of CaCOs3 in limestone is about 87.40%, see se tion input/output data, (2) the conversion degree of limestone is about 80%. Tl concentration of O2 in flue gas is about 2% because the air excess number is ov the theoretical amount by 10 to 20%. The concentration of CO in flue gas is abou 0.8%. CO in flue gas is produced from gasification of fuel (Boudourd reaction) « from volatiles but the flue gas also contains a certain a mount of oxygen. This due to the waste mixing with air and fuel. Figure 3.7 also shows the variation « flue gas temperature with time. The flue gas temperature at the top of the kiln (¢ outlet) is between 80 and 150 °C. The variation in flue gas temperature is due to tl temperature measured at the top of the kiln, so the flow profile and heat loss effec the measurement and also the false air measurement. The flue gas temperature fro: mixed feed lime kilns is lower than the other lime kilns because the fuel combus with the onset of surface calcination, so that there is little waste with flue gas. with the onset of surface calcination, so that there is little waste with flue gas.
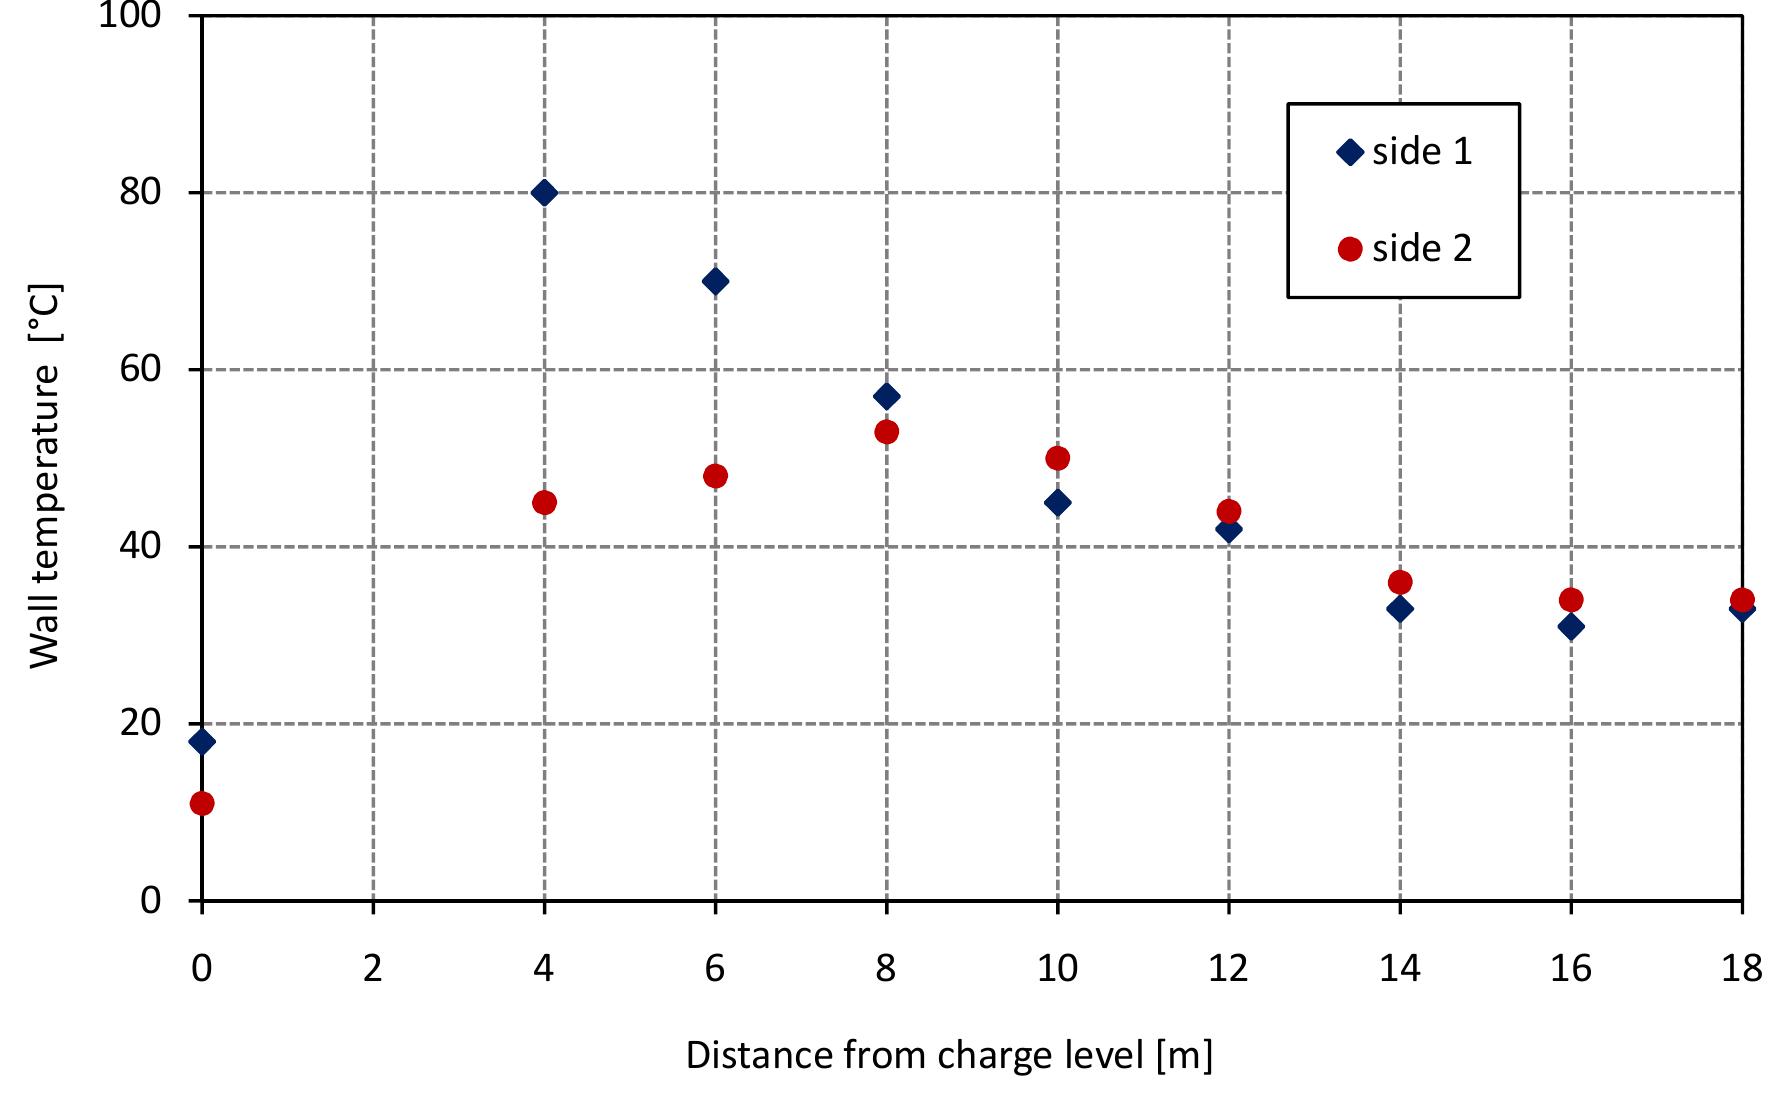
Figure 3.8 shows the results of wall temperature measurements at two sides of the kiln (south-east side (1) and north-west side (2)) plotted against vertical position The wall temperature measurement is affected by the speed and direction of wind. I can be seen from the figure that the measured wall temperature has a similar trend tc that of the temperature profile inside the kiln where the wall temperature of side (1. is high near the top of the kiln and reduced with the length of the kiln while the wal temperature of side (2) is low at the top of the kiln and increases until the middle o the kiln, and after that decreases. The wall temperature for both sides is decreasec slowly after 14 m until the bottom of the kiln because the type of refractory material are different than the above zones of the kiln. Figure 3.8: Measured wall temperature.
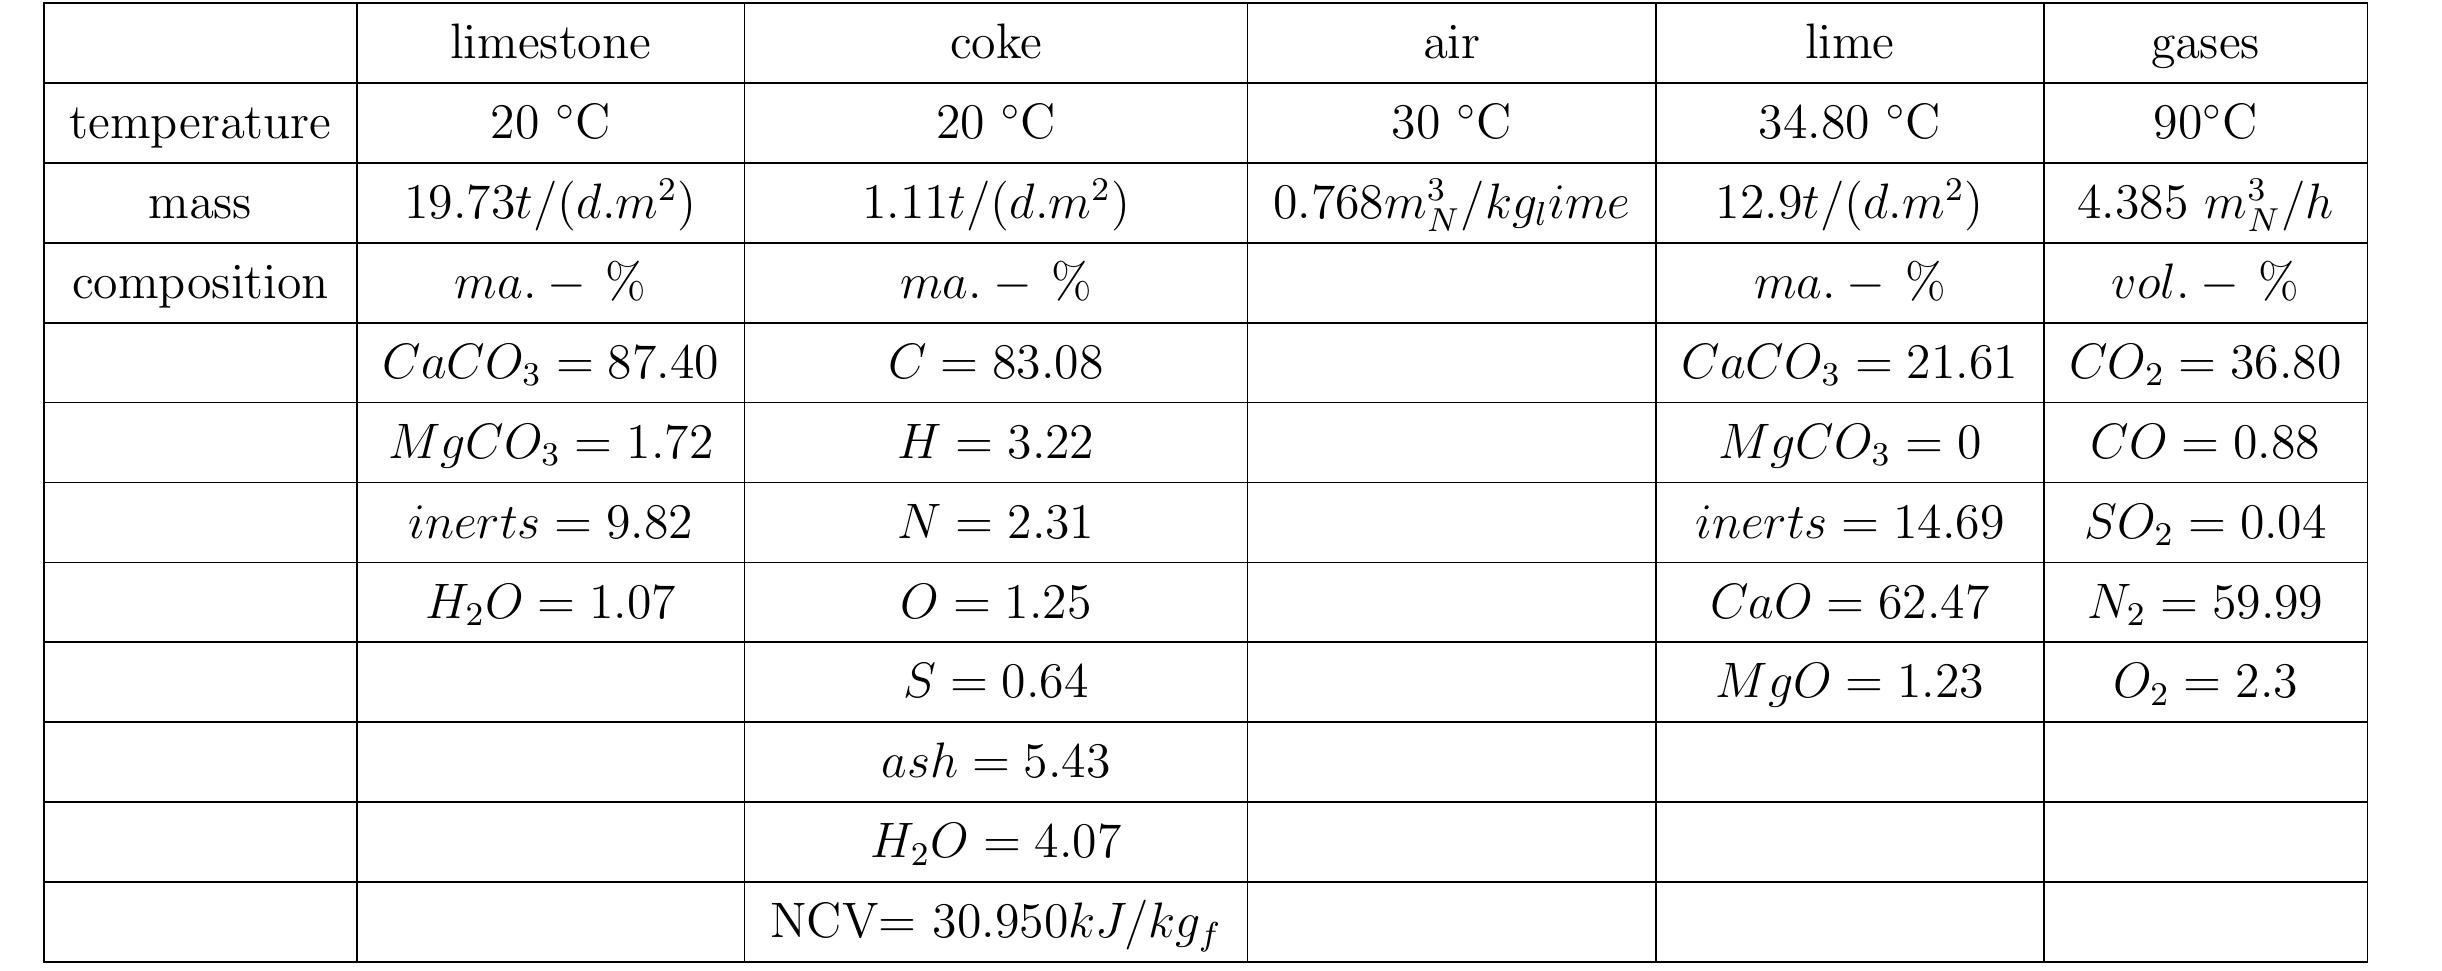
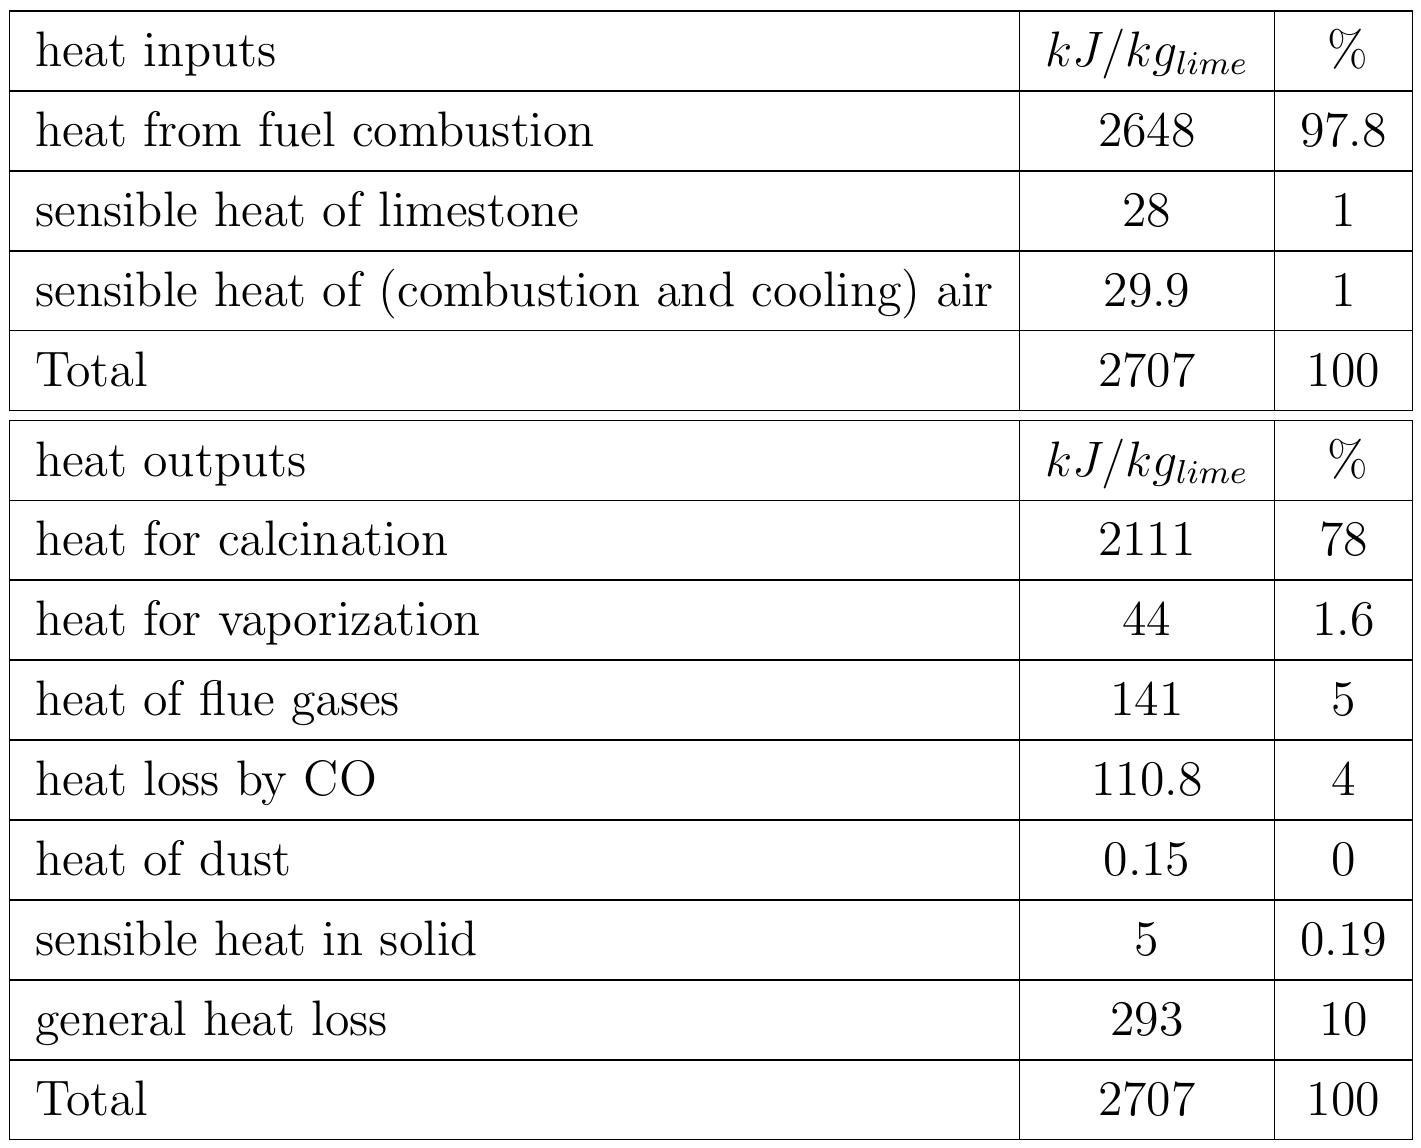
Table 3.2: Heat balance of the kiln No.6
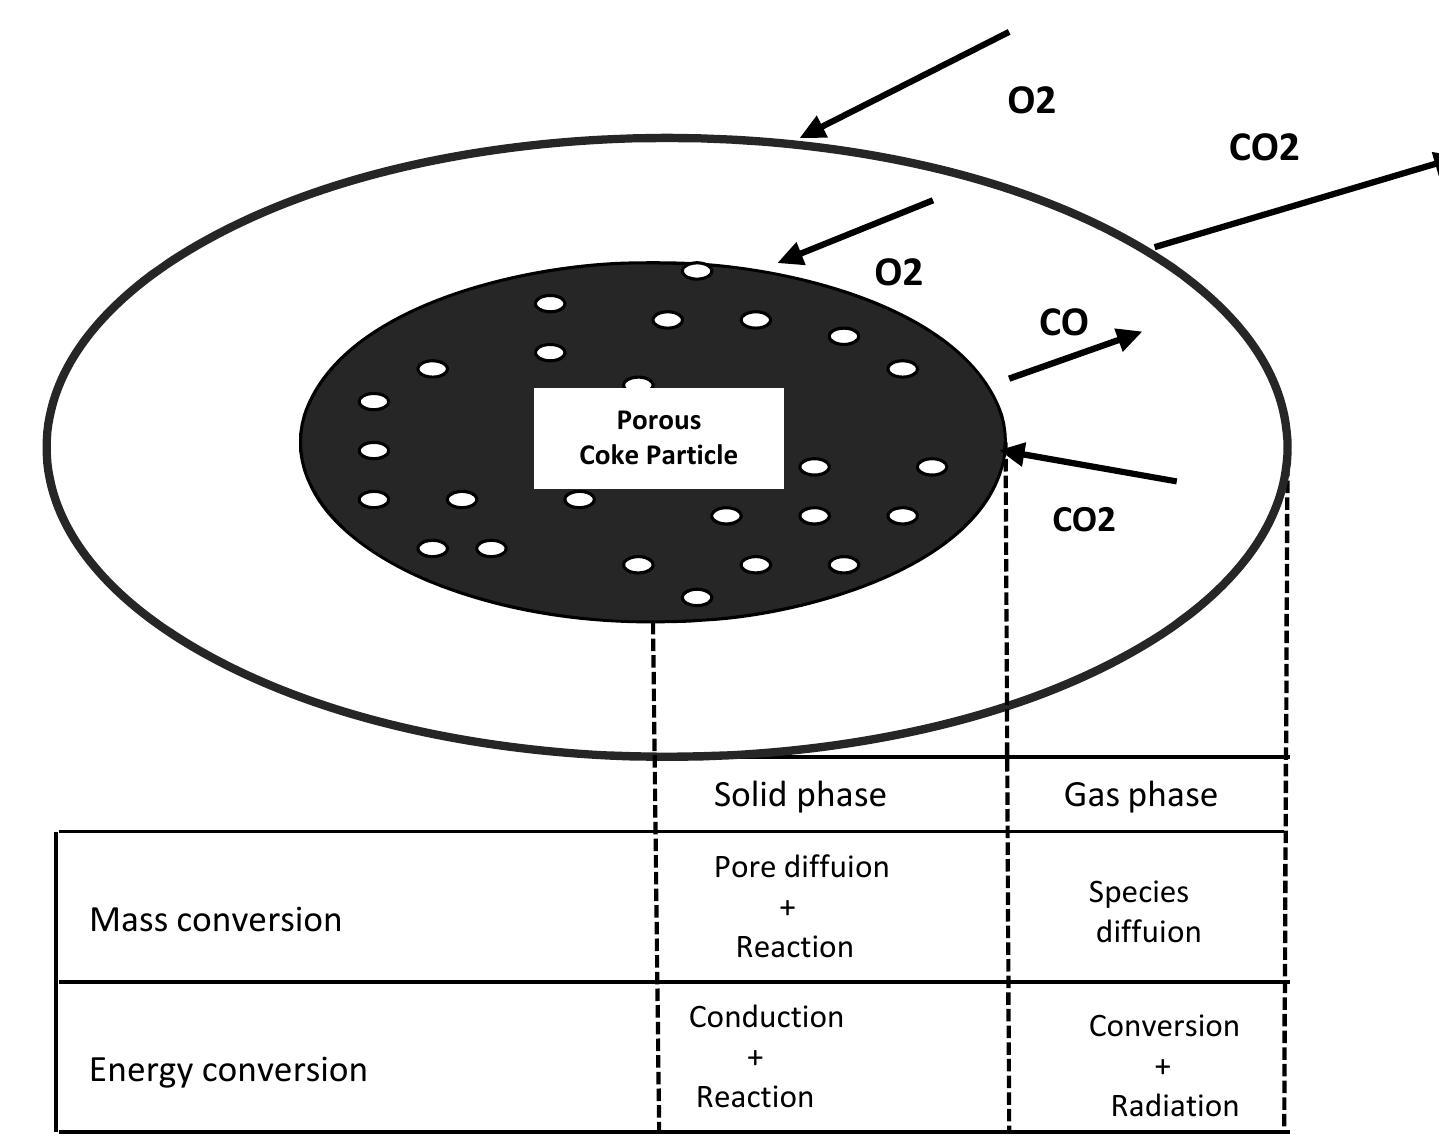
Figure 4.1: Basic scheme for description of combustion process of a single coke particle t d t t d d he diffusion coefficient of O2 is slightly larger he particle surface. If the temperature of the ioxide is diffused to the surface of the partic Depending on the size and temperature of the etermined. Therefore, we have chosen to use d he surface and diffuses outwards and reacts with incoming oxygen to form CO, . Several researchers have argued that oxygen diffuses to the particle surface or carbon ioxide. Most of them decided that if the temperature is greater than about 1100 K than that of CO». and Oy, diffuses the particle is above 1373 K, the carbon e and QO, will not reach the surface. particle, the validity of the models is the continuous film model in order to escribe the combustion of the coke particle because of the change of temperature and size of the particle through the combustion.
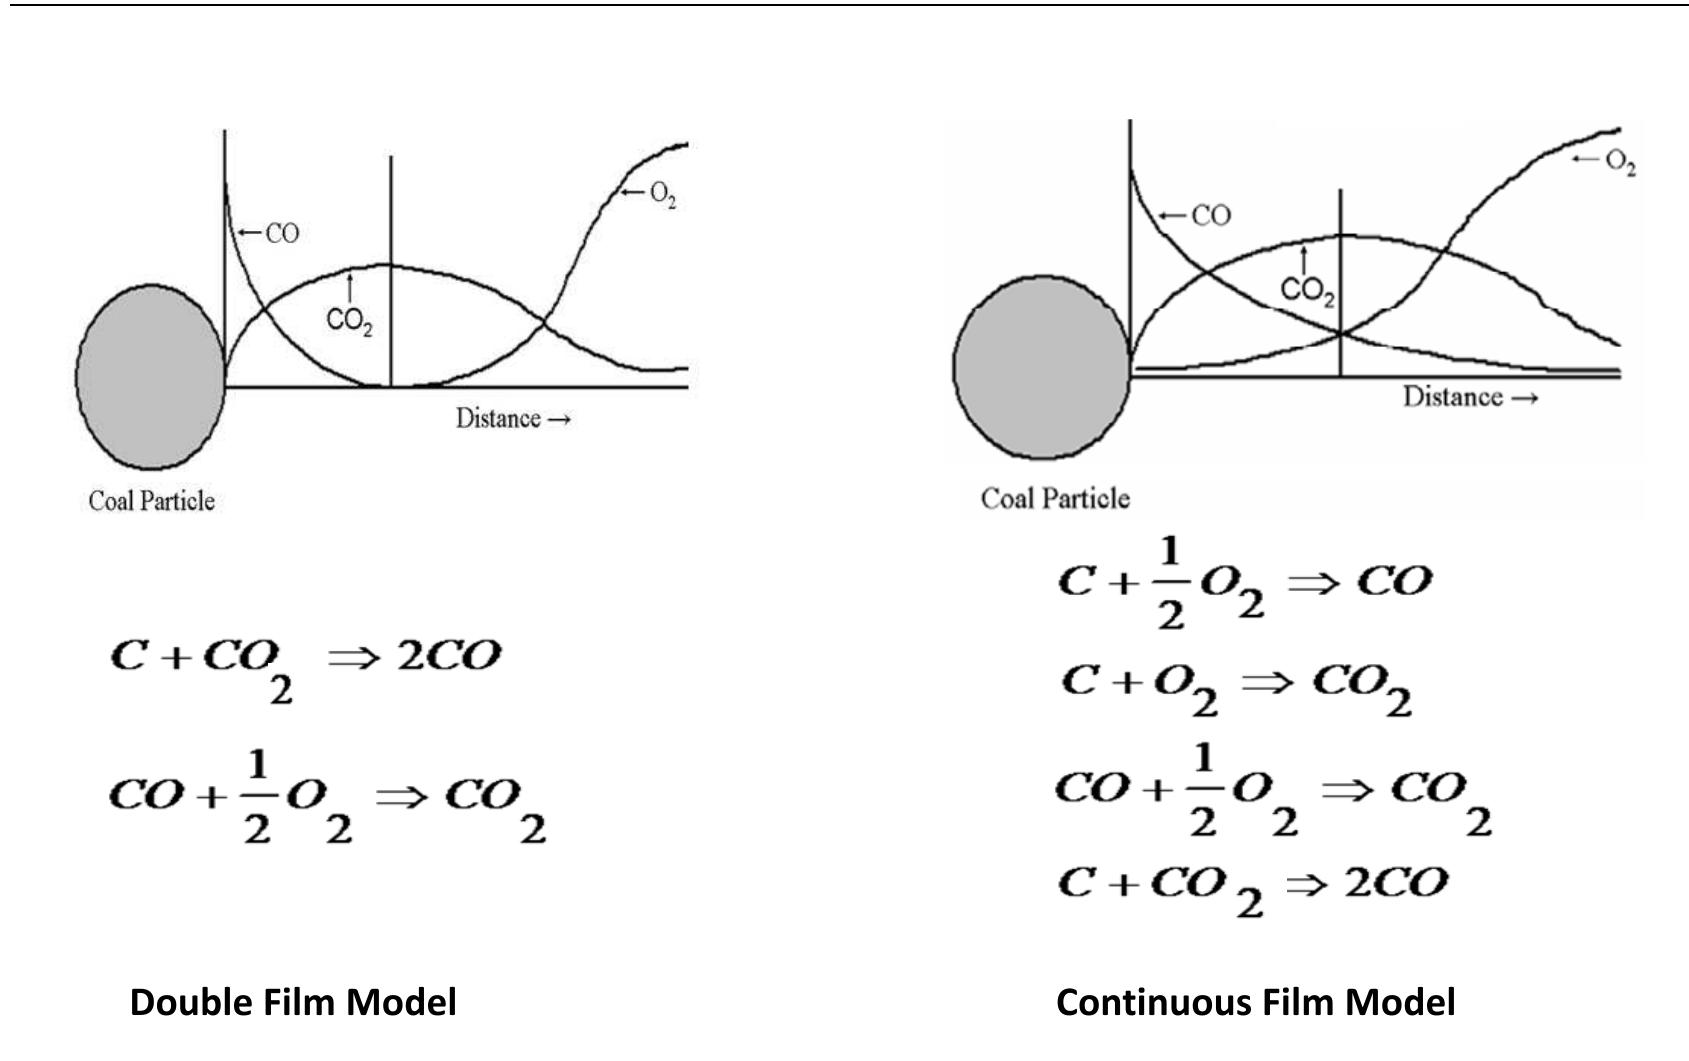
Figure 4.2: Schematic concentration profiles in combustion models for burning of coke particle.
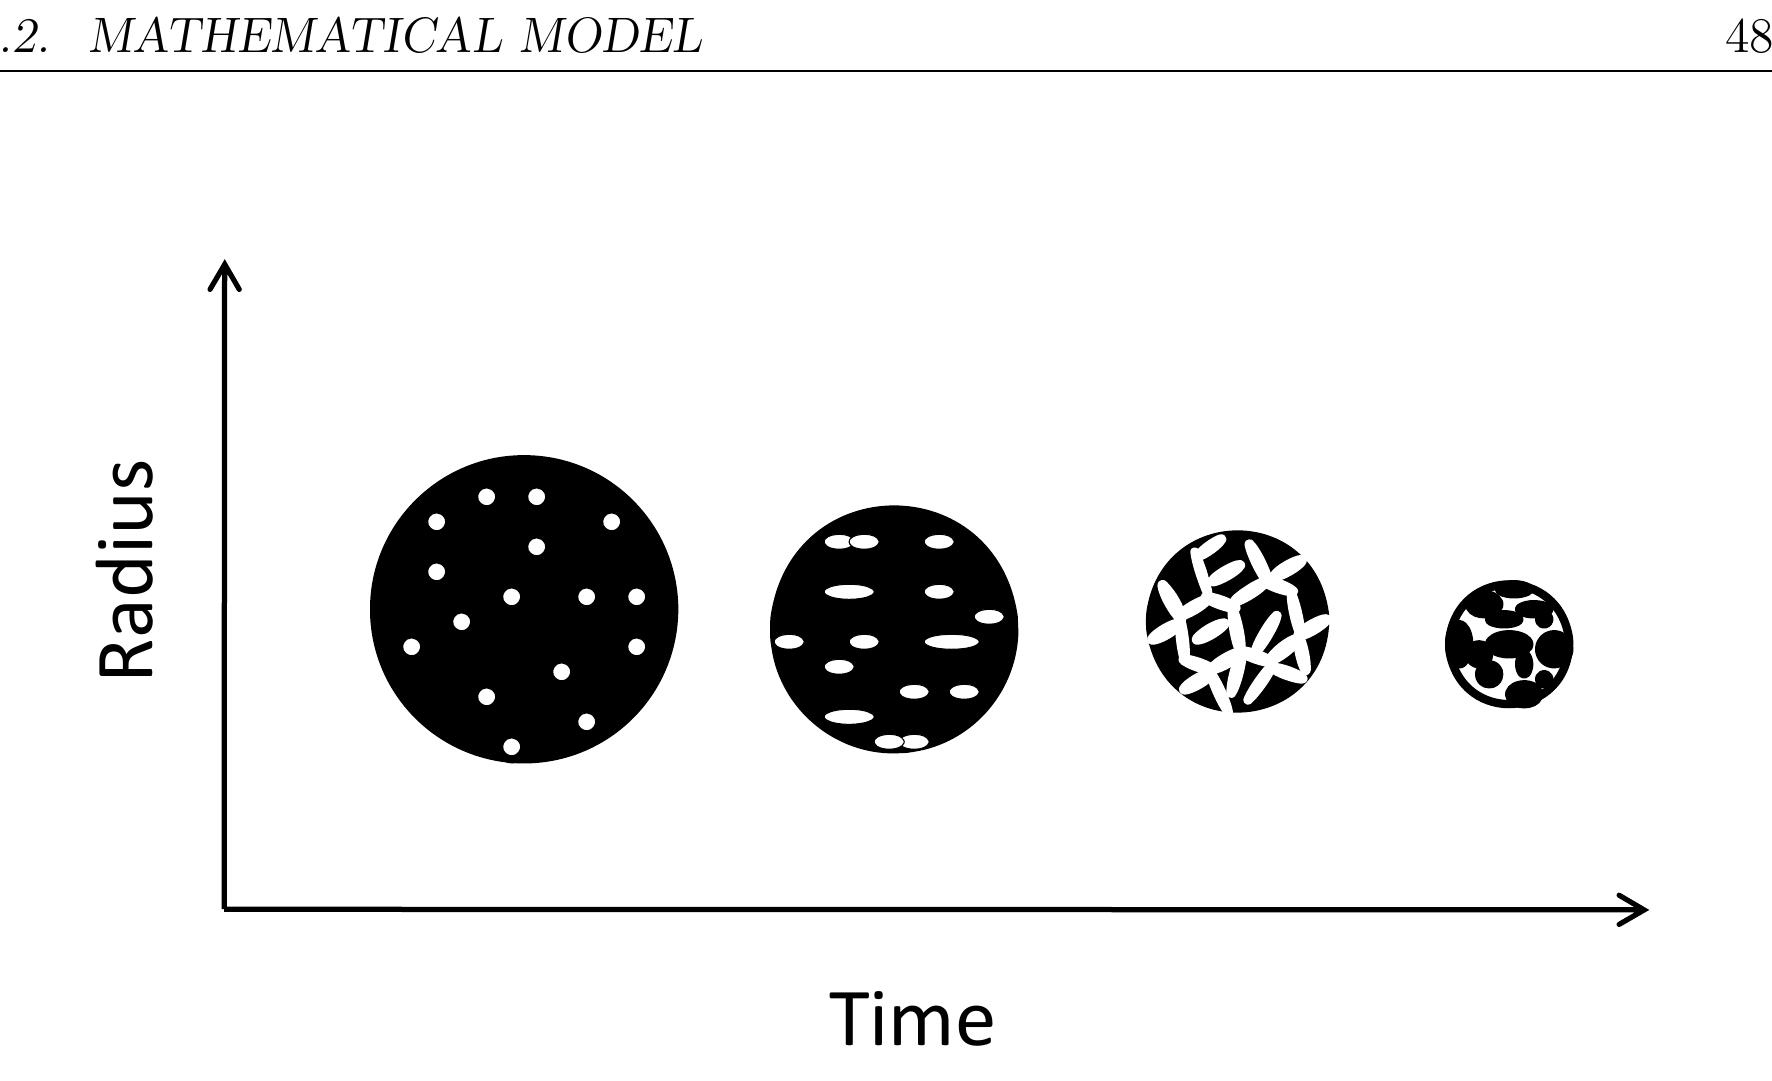
Figure 4.3: Schematic diagram of the particle shrinkage and porosity with time layer because of attrition during combustion in the kiln.
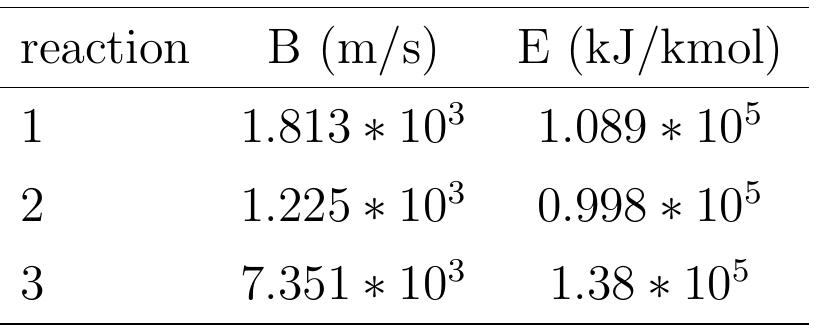
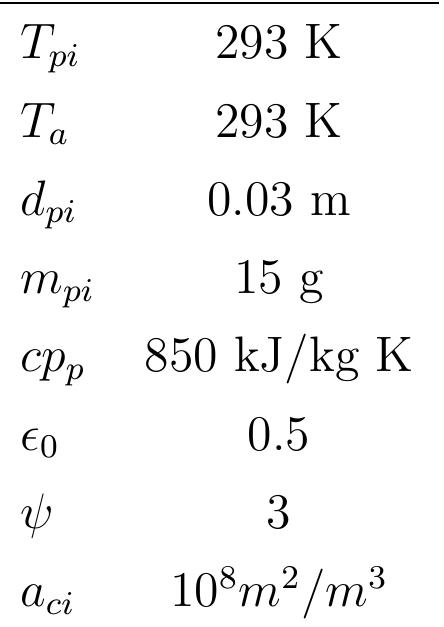
Table 4.2: Parameters used in the simulations Figure 4.4 shows the variation of temperature and mass fraction of the particle with burning time. As shown in figure 4.4, at the beginning, the coke particle i: preheated by surrounding gases to reach the ignition temperature, the ignition of the particle starts in the range of 650 °C, but this is not visible on the temperature pro- file because the heat of combustion is so low. This temperature has been determinec from the profile of mass fraction of the particle where it stays constant during heat ur and starts to decrease with burning. The coke particle is preheated so the decrease of mass is due to combustion. The particle temperature increases continuously tc reach the maximum temperature and then stays constant. Because the particle is large (dp; = 0.03m), the reaction surface area is large and the oxygen diffusion rate tc Figure 4.4 shows the variation of temperature and mass fraction of the particle
![Figure 4.4: Profiles of particle temperature and particle mass fraction during com- bustion the particle surface of the gases is large. Because of this, more coke is combusted bu the heat transfer coefficient is small with a large particle so the temperature of th« particle increases to a maximum value. During the combustion of the particle, th mass fraction of the particle decreases continuously with time until burnout. Figur 4.4 shows also the comparison of the model’s predictions to the data available in th literature for the particle temperature in 21% O 2 composition in the gas stream [52] The model simulation’s results seem to have a good agreement with the experimenta data.](https://figures.academia-assets.com/82863391/figure_032.jpg) ](
](Figure 4.4: Profiles of particle temperature and particle mass fraction during com- bustion the particle surface of the gases is large. Because of this, more coke is combusted bu the heat transfer coefficient is small with a large particle so the temperature of th« particle increases to a maximum value. During the combustion of the particle, th mass fraction of the particle decreases continuously with time until burnout. Figur 4.4 shows also the comparison of the model’s predictions to the data available in th literature for the particle temperature in 21% O 2 composition in the gas stream [52] The model simulation’s results seem to have a good agreement with the experimenta data.
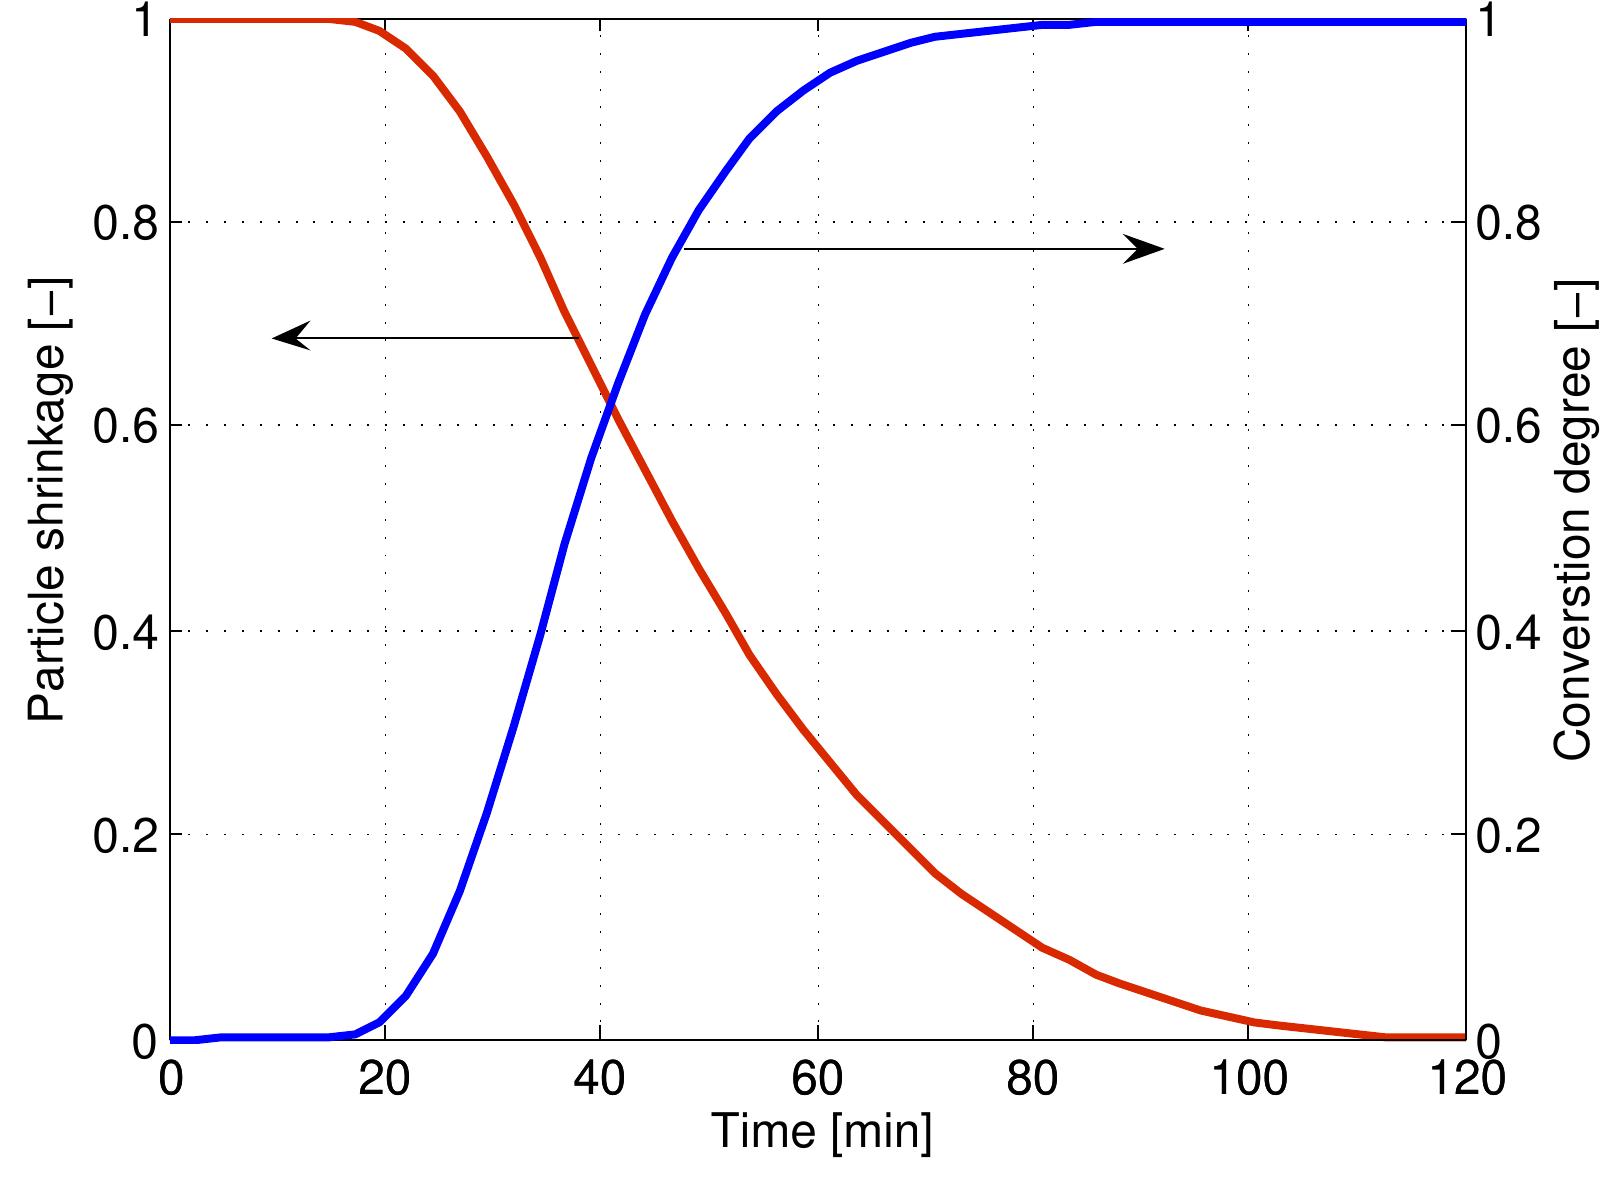
Figure 4.5: Profiles of particle shrinkage and conversion degree during combustion The temperature of the particle over the lifetime of a coke particle is shown in Figure
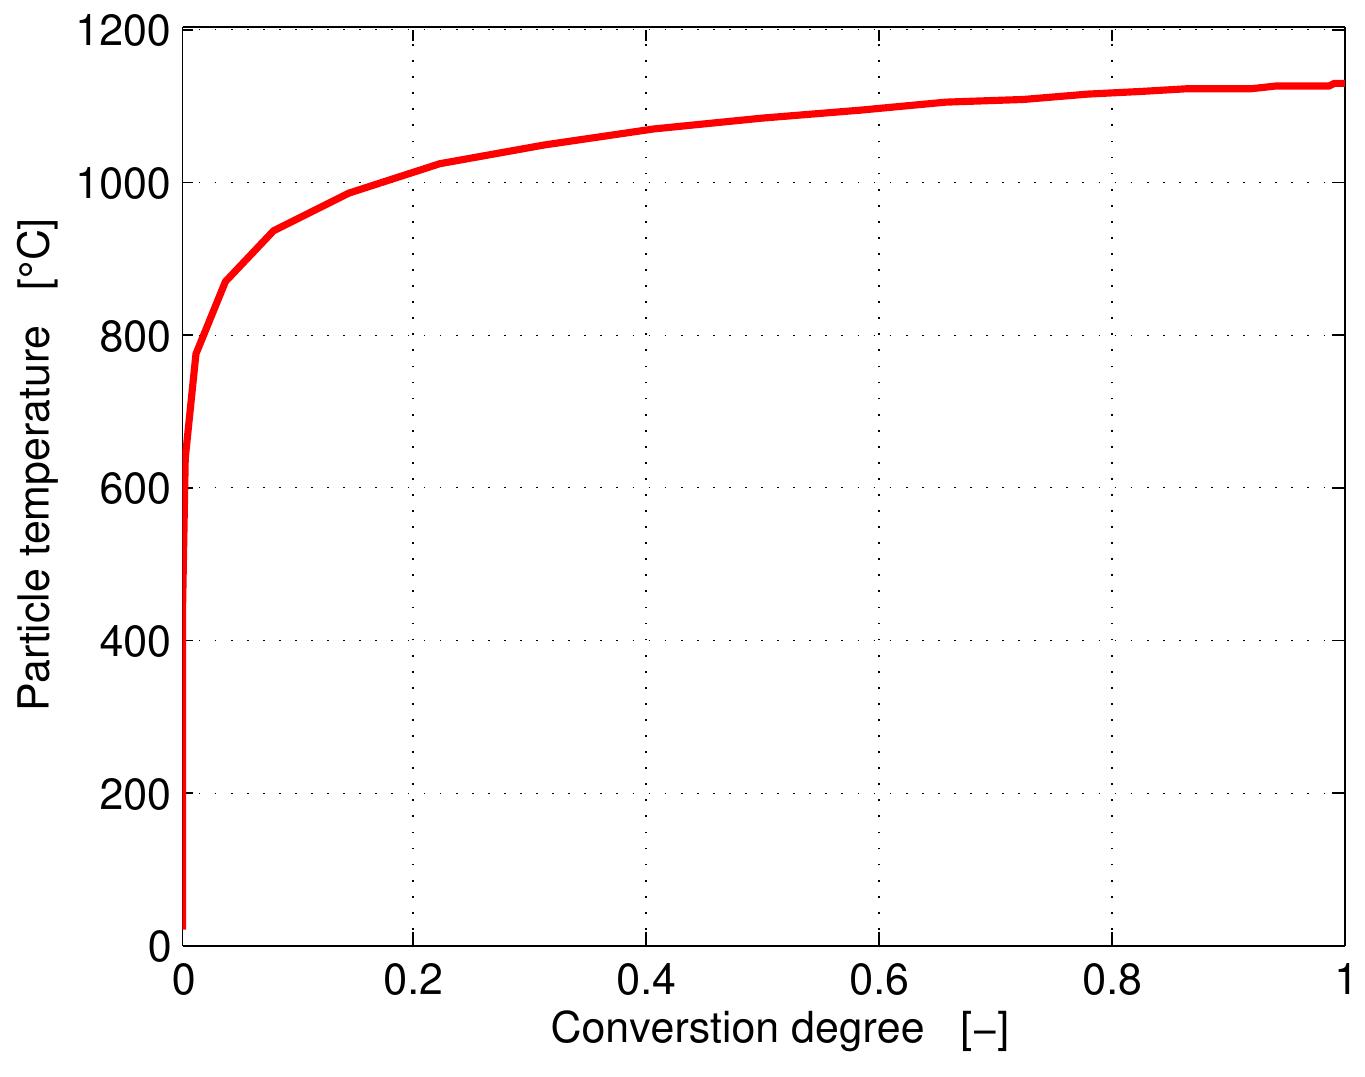
Figure 4.6: Particle temperature as a function of conversion
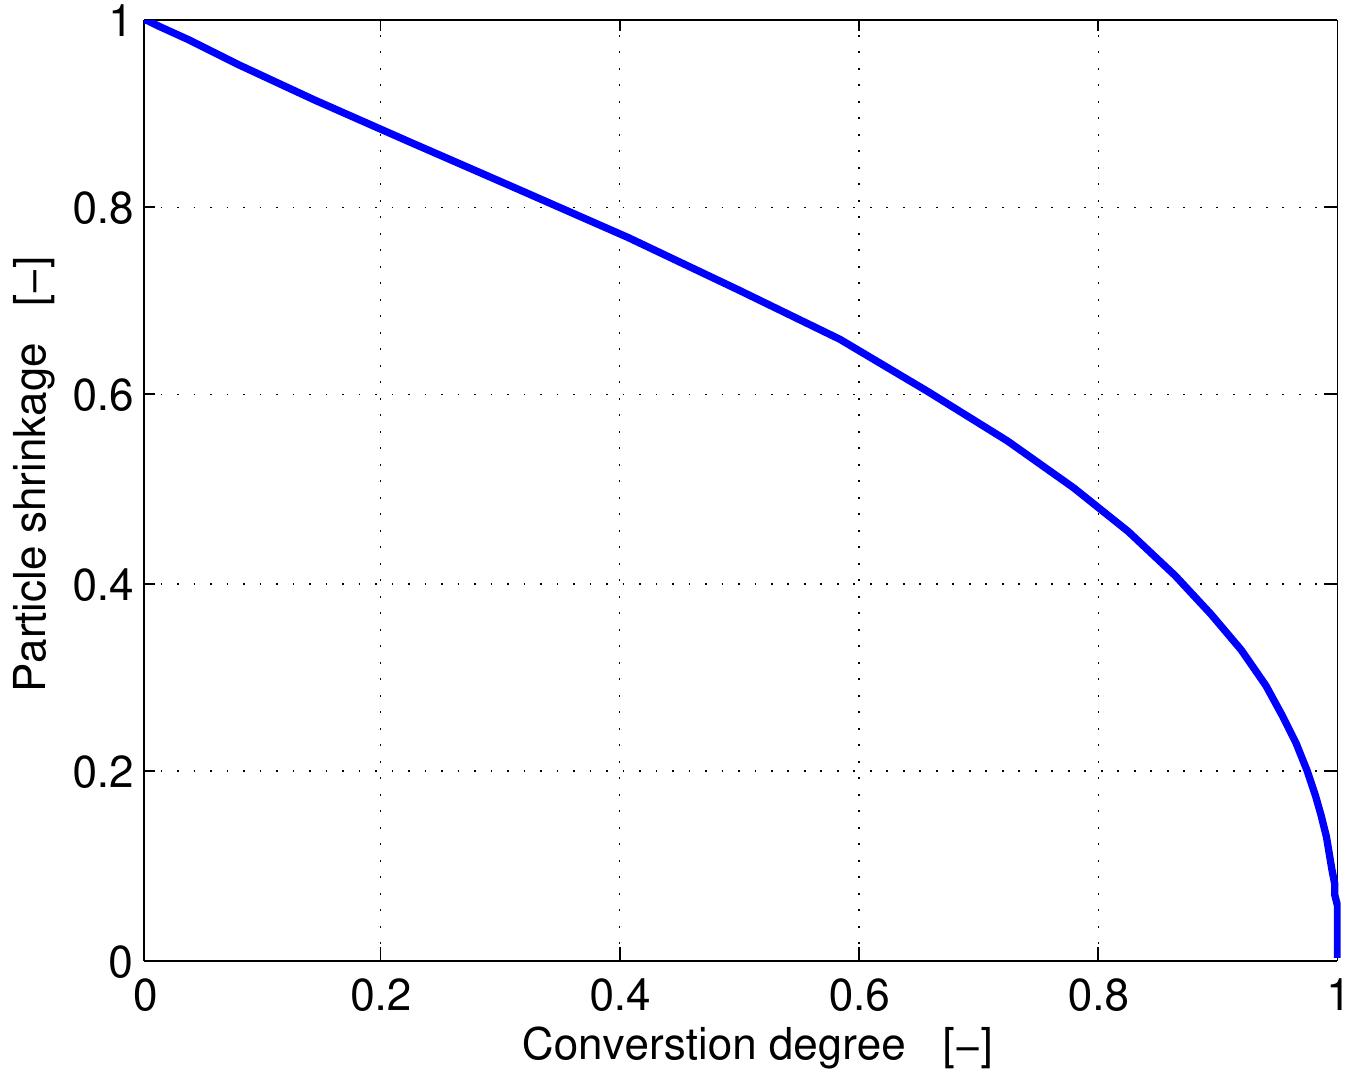
Figure 4.7: Particle shrinkage as a function of conversion
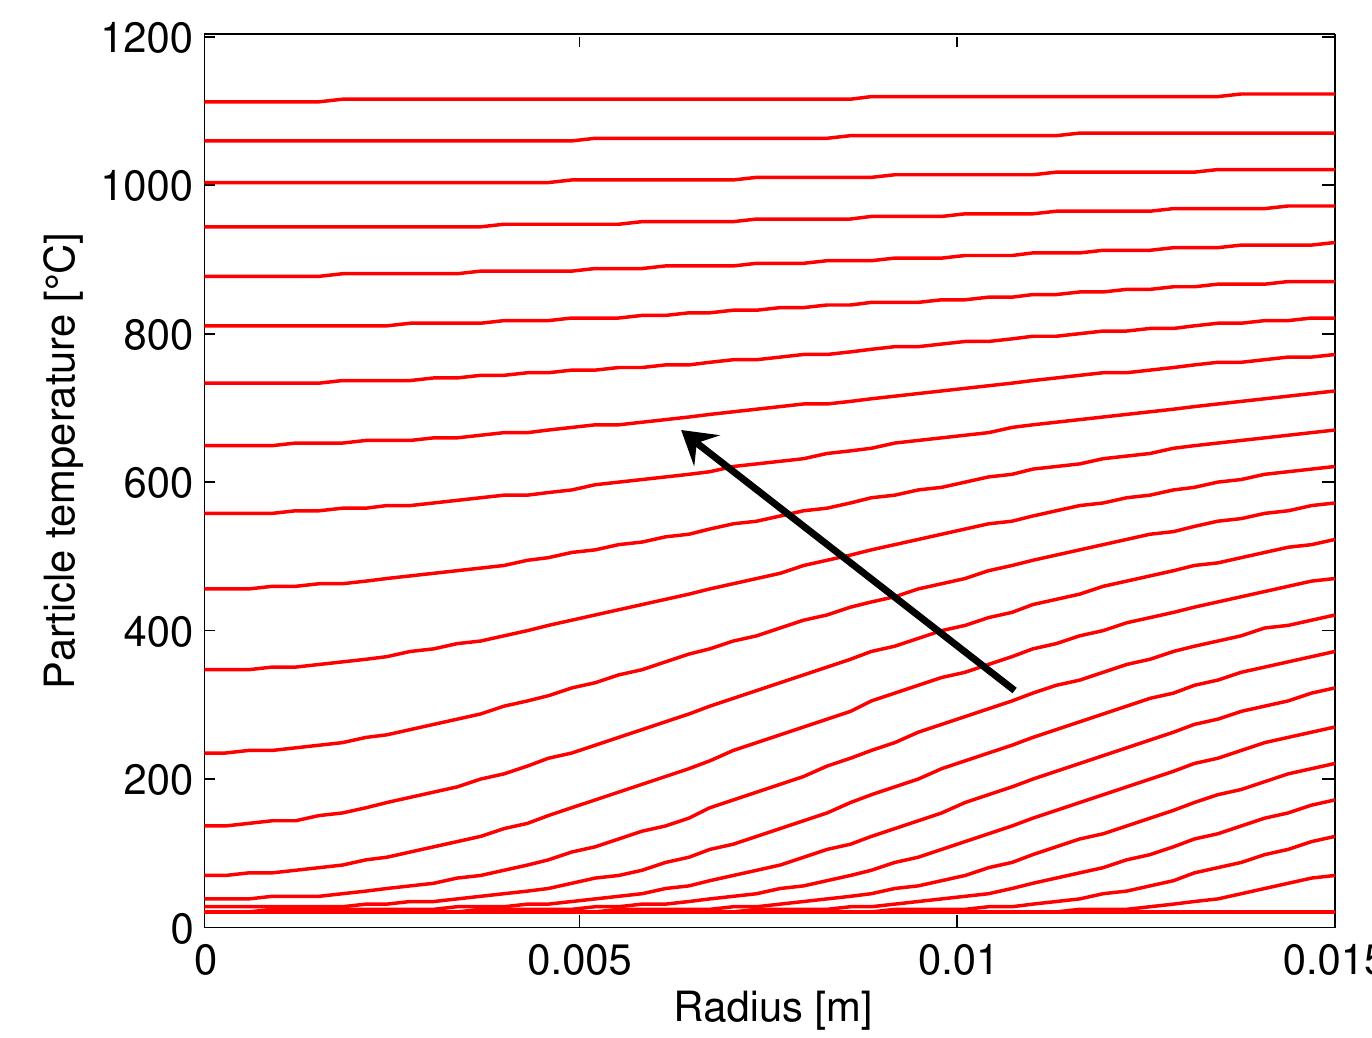
Figure 4.8: Temperature profiles along the radial distance inside the particle of a diameter of 0.03 m that, at the beginning, the temperature difference between the center and surface of the particle is constant and start changing with time. When preheating, the tem- perature difference increases until the ignition, after that the temperature difference is reduced to become approximately constant. During combustion, the result agree with the fact of the constant temperature along the radial distance inside the particle
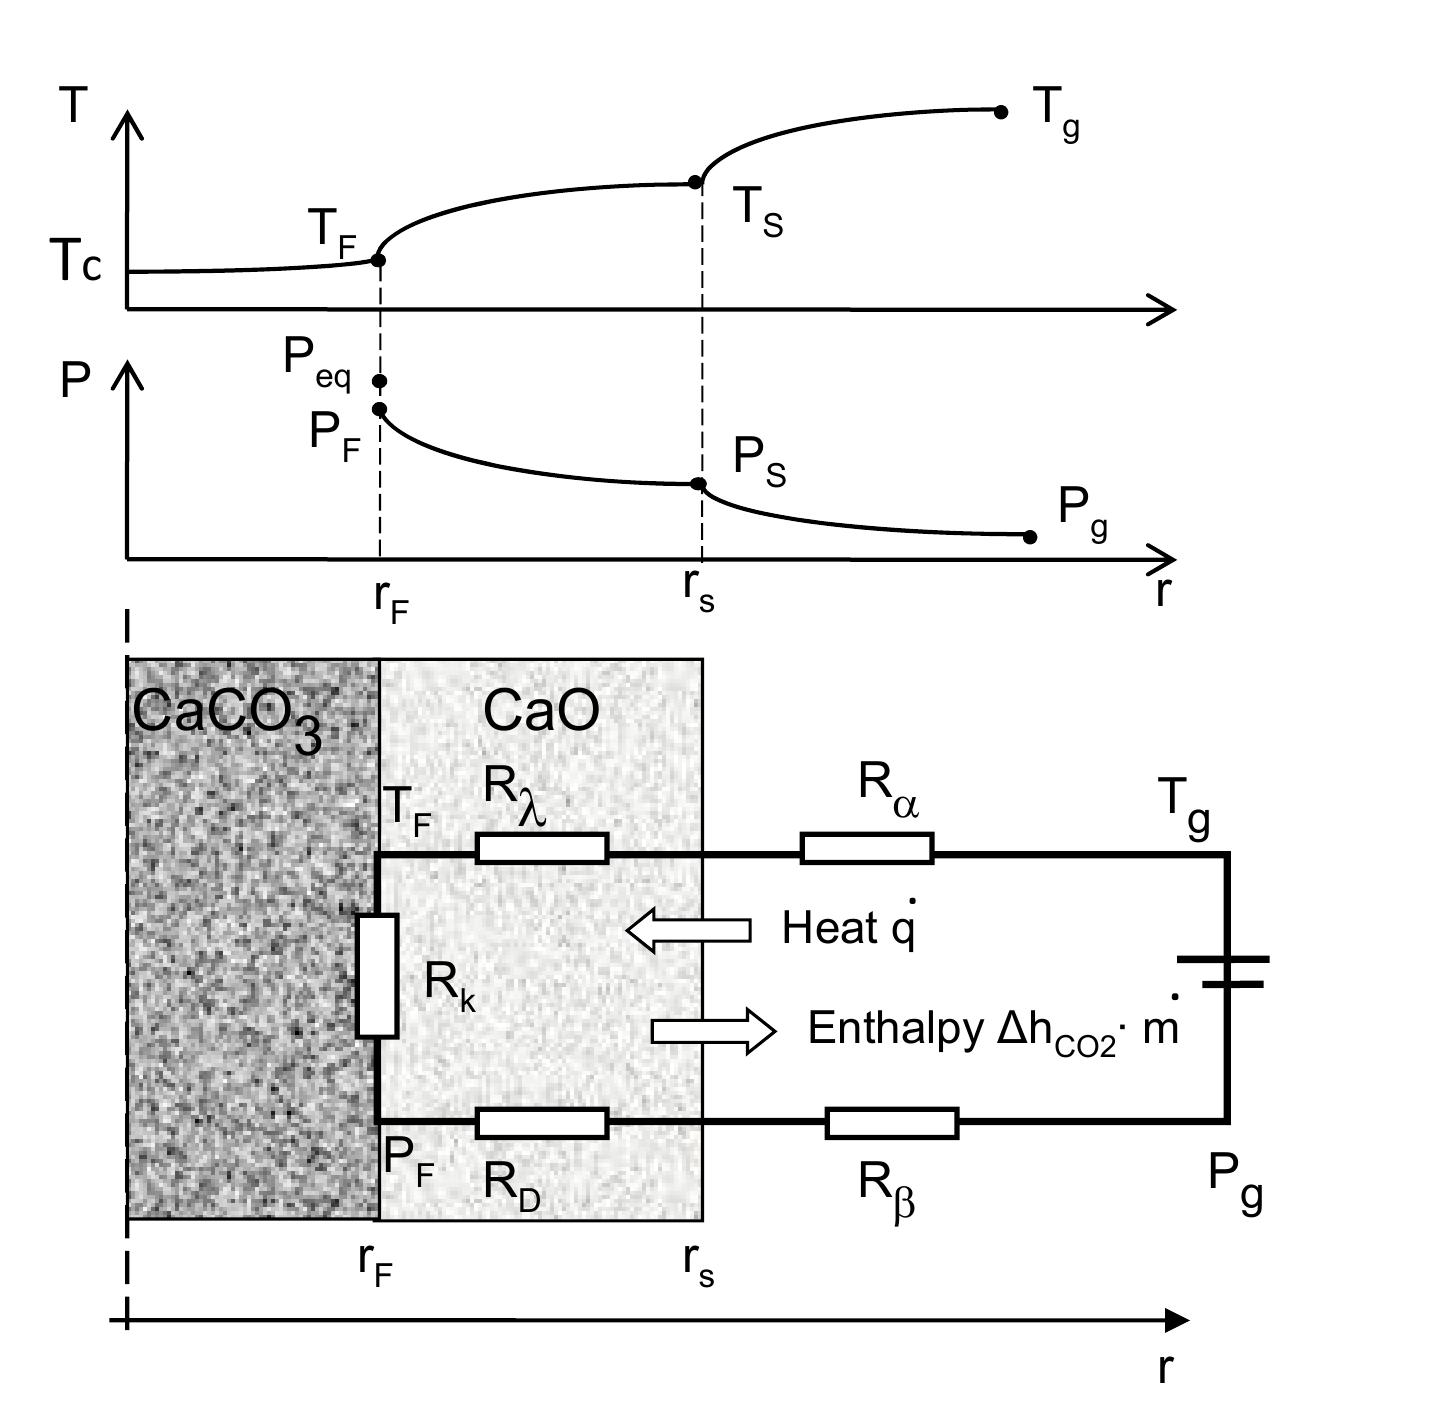
Figure 5.1: Mechanism of limestone decomposition.
![Figure 5.2: The mean values of the specific heat capacity of lime, limestone and air [68].](https://figures.academia-assets.com/82863391/figure_038.jpg) ](
](Figure 5.2: The mean values of the specific heat capacity of lime, limestone and air [68].
![Figure 5.3: Thermal conductivity of calcium oxide. in a range of 2.5788 to 1.743 W/m K and 0.63 to 0.84 W/m K for limestone and lime respectively by [69]. [63,58] have reported the values of thermal conductivity of lime in a range between 0.55 to 0.85 W/m K. In figure 5.3, some values of thermal conductivity of the lime (CaO) layer from the literature are derived, using special direct measurement methods.](https://figures.academia-assets.com/82863391/figure_039.jpg) ](
](Figure 5.3: Thermal conductivity of calcium oxide. in a range of 2.5788 to 1.743 W/m K and 0.63 to 0.84 W/m K for limestone and lime respectively by [69]. [63,58] have reported the values of thermal conductivity of lime in a range between 0.55 to 0.85 W/m K. In figure 5.3, some values of thermal conductivity of the lime (CaO) layer from the literature are derived, using special direct measurement methods.
![The CO, equilibrium pressure has been measured and some values of Py and AH; which were obtained from the literature, have been listed here. The reaction enthalpy AHr of CaCOz3 is 167 kJ/mole relative to 900C and Py is 4*10" bar according to [70]. AHr of CaCOsz is 163.6 kJ/mole and Pp is 1.886 * 10" bar [71]. [63,64] measured the CO, equilibrium pressure for different types of limestone and reported AHR of CaCOsz is 168 kJ/mole and Py is 2.15 * 10’ bar. Some searchers calculated the CO; equilibrium pressure related to gas temperature where the decomposition temperature depends on the CO; partial pressure in gas and consequently on gas temperature. The values obtained from equilibrium pressure measurements by other various researchers have been shown in figure 5.4. Figure 5.4: Equilibrium pressure of limestone decomposition.](https://figures.academia-assets.com/82863391/figure_040.jpg) ](
](The CO, equilibrium pressure has been measured and some values of Py and AH; which were obtained from the literature, have been listed here. The reaction enthalpy AHr of CaCOz3 is 167 kJ/mole relative to 900C and Py is 4*10" bar according to [70]. AHr of CaCOsz is 163.6 kJ/mole and Pp is 1.886 * 10" bar [71]. [63,64] measured the CO, equilibrium pressure for different types of limestone and reported AHR of CaCOsz is 168 kJ/mole and Py is 2.15 * 10’ bar. Some searchers calculated the CO; equilibrium pressure related to gas temperature where the decomposition temperature depends on the CO; partial pressure in gas and consequently on gas temperature. The values obtained from equilibrium pressure measurements by other various researchers have been shown in figure 5.4. Figure 5.4: Equilibrium pressure of limestone decomposition.
![Figure 5.5: Reaction coefficient of limestone decomposition. The reaction kinetics of limestone decomposition with different particle sizes of lime- stone, starting from micrometer to centimeter, have been studied by many researchers. The studies of reaction kinetics of different limestones show a large variation due to their differences in crystalline structure and nature of impurities. The values of the Arrhenius parameters, | reported under varying EF =110 to 1600 kJ/mol and A = 104 to 10° 1/S have been experimental conditions [72]. The values obtained from re- action coefficient measurements by various researchers are summarized in figure 5.5.](https://figures.academia-assets.com/82863391/figure_041.jpg) ](
](Figure 5.5: Reaction coefficient of limestone decomposition. The reaction kinetics of limestone decomposition with different particle sizes of lime- stone, starting from micrometer to centimeter, have been studied by many researchers. The studies of reaction kinetics of different limestones show a large variation due to their differences in crystalline structure and nature of impurities. The values of the Arrhenius parameters, | reported under varying EF =110 to 1600 kJ/mol and A = 104 to 10° 1/S have been experimental conditions [72]. The values obtained from re- action coefficient measurements by various researchers are summarized in figure 5.5.
![Figure 5.6: Effective pore diffusion coefficient of limestone decomposition [70]](https://figures.academia-assets.com/82863391/figure_042.jpg) ](
](Figure 5.6: Effective pore diffusion coefficient of limestone decomposition [70]
![Figure 5.7: Shrinking core model of limestone decomposition Due to low internal porosity of limestone, we have chosen to use the shrinking core model in order to describe the reactive particle [28,58]. The model is illustrated in figure 5.7. The calcination reaction is assumed to initially take place at the outer surface of the particle where the heat is transferred from the surrounding gas to the surface of the limestone particle by convection and radiation. As the reaction proceeds, the exterior surface of the particle is covered by the porous lime layer, while the unreacted core remains in the interior region of the particle. The carbon dioxide produced from the reaction is drained out by diffusion. For a mathematical description of the calcination process, 1-D shrinking core model can be used based on the following assumptions:](https://figures.academia-assets.com/82863391/figure_043.jpg) ](
](Figure 5.7: Shrinking core model of limestone decomposition Due to low internal porosity of limestone, we have chosen to use the shrinking core model in order to describe the reactive particle [28,58]. The model is illustrated in figure 5.7. The calcination reaction is assumed to initially take place at the outer surface of the particle where the heat is transferred from the surrounding gas to the surface of the limestone particle by convection and radiation. As the reaction proceeds, the exterior surface of the particle is covered by the porous lime layer, while the unreacted core remains in the interior region of the particle. The carbon dioxide produced from the reaction is drained out by diffusion. For a mathematical description of the calcination process, 1-D shrinking core model can be used based on the following assumptions:
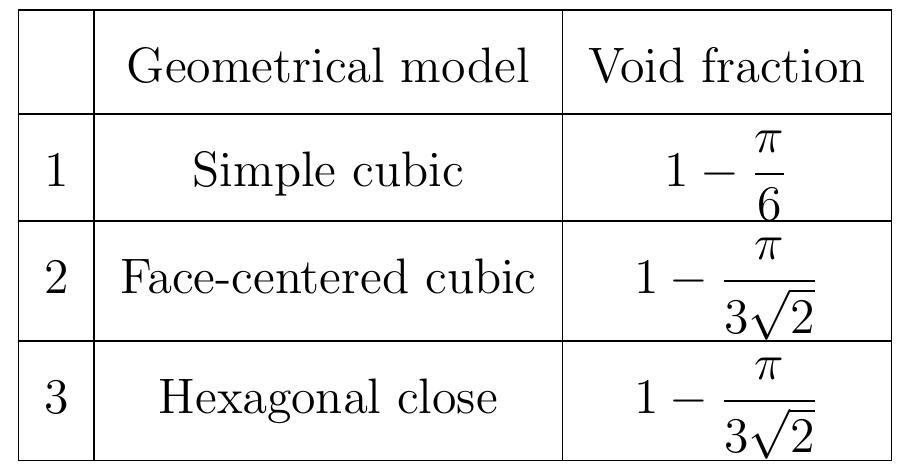
Table 6.1: void fraction of geometrical models For a size distribution in a particle bed, figure 6.1 shows the influence of particle size distribution for bi-dispersed, random packing of spheres.
![Figure 6.1: Bed porosity of bi-dispersed packing of spheres [78].](https://figures.academia-assets.com/82863391/figure_045.jpg) ](
](Figure 6.1: Bed porosity of bi-dispersed packing of spheres [78].
![Table 6.2: Material properties of gases in To = 273K [70]. The properties of gas mixtures can be calculated with the following formulas:](https://figures.academia-assets.com/82863391/table_011.jpg) ](
](Table 6.2: Material properties of gases in To = 273K [70]. The properties of gas mixtures can be calculated with the following formulas:
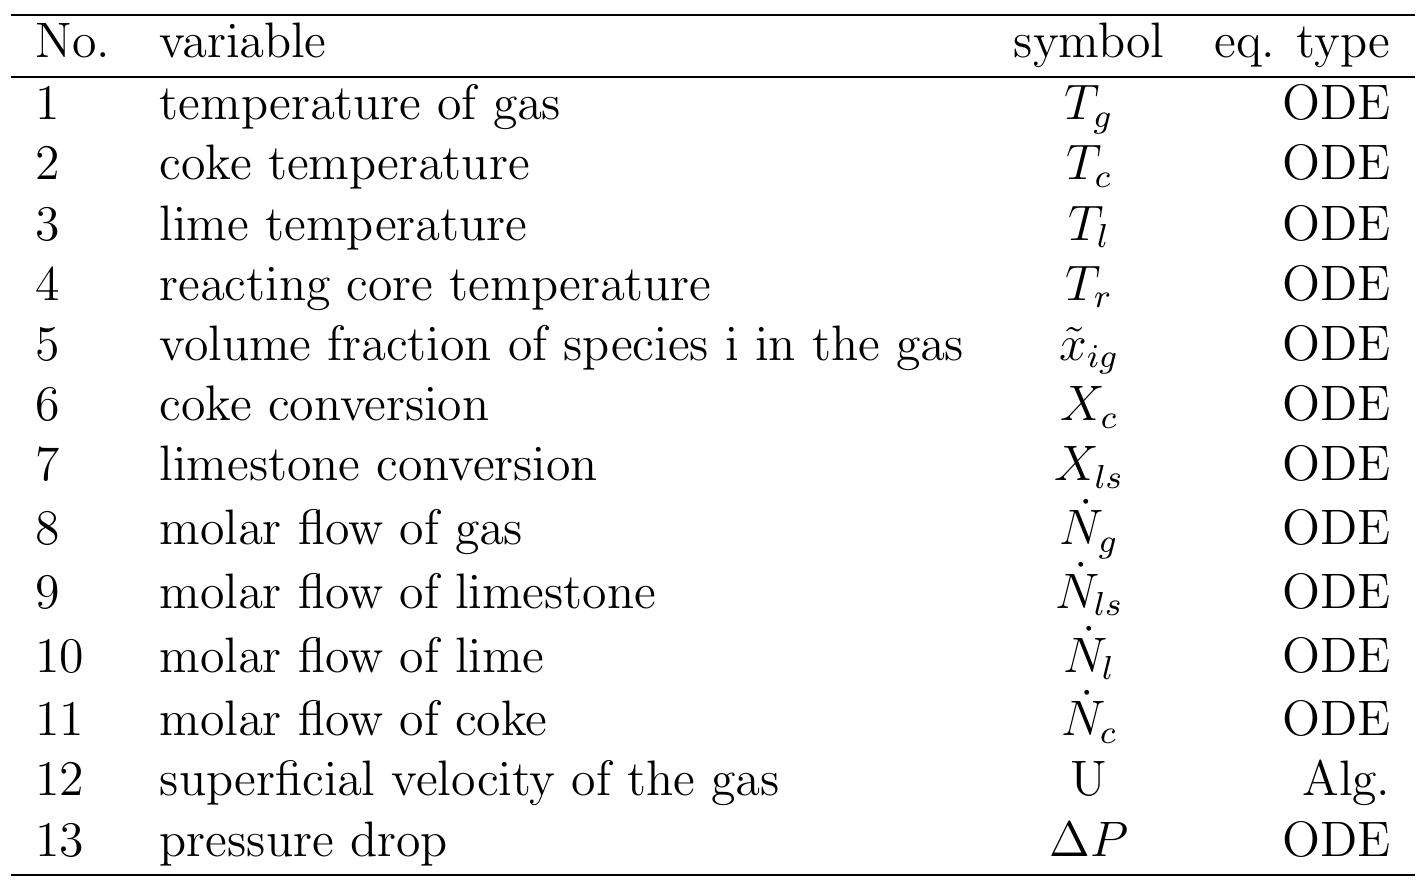
Table 6.3: Summary of important variables computed by the model .4 Results of the model and discussion .4.1 Geometrical and operating parameters Results of the model and discussion
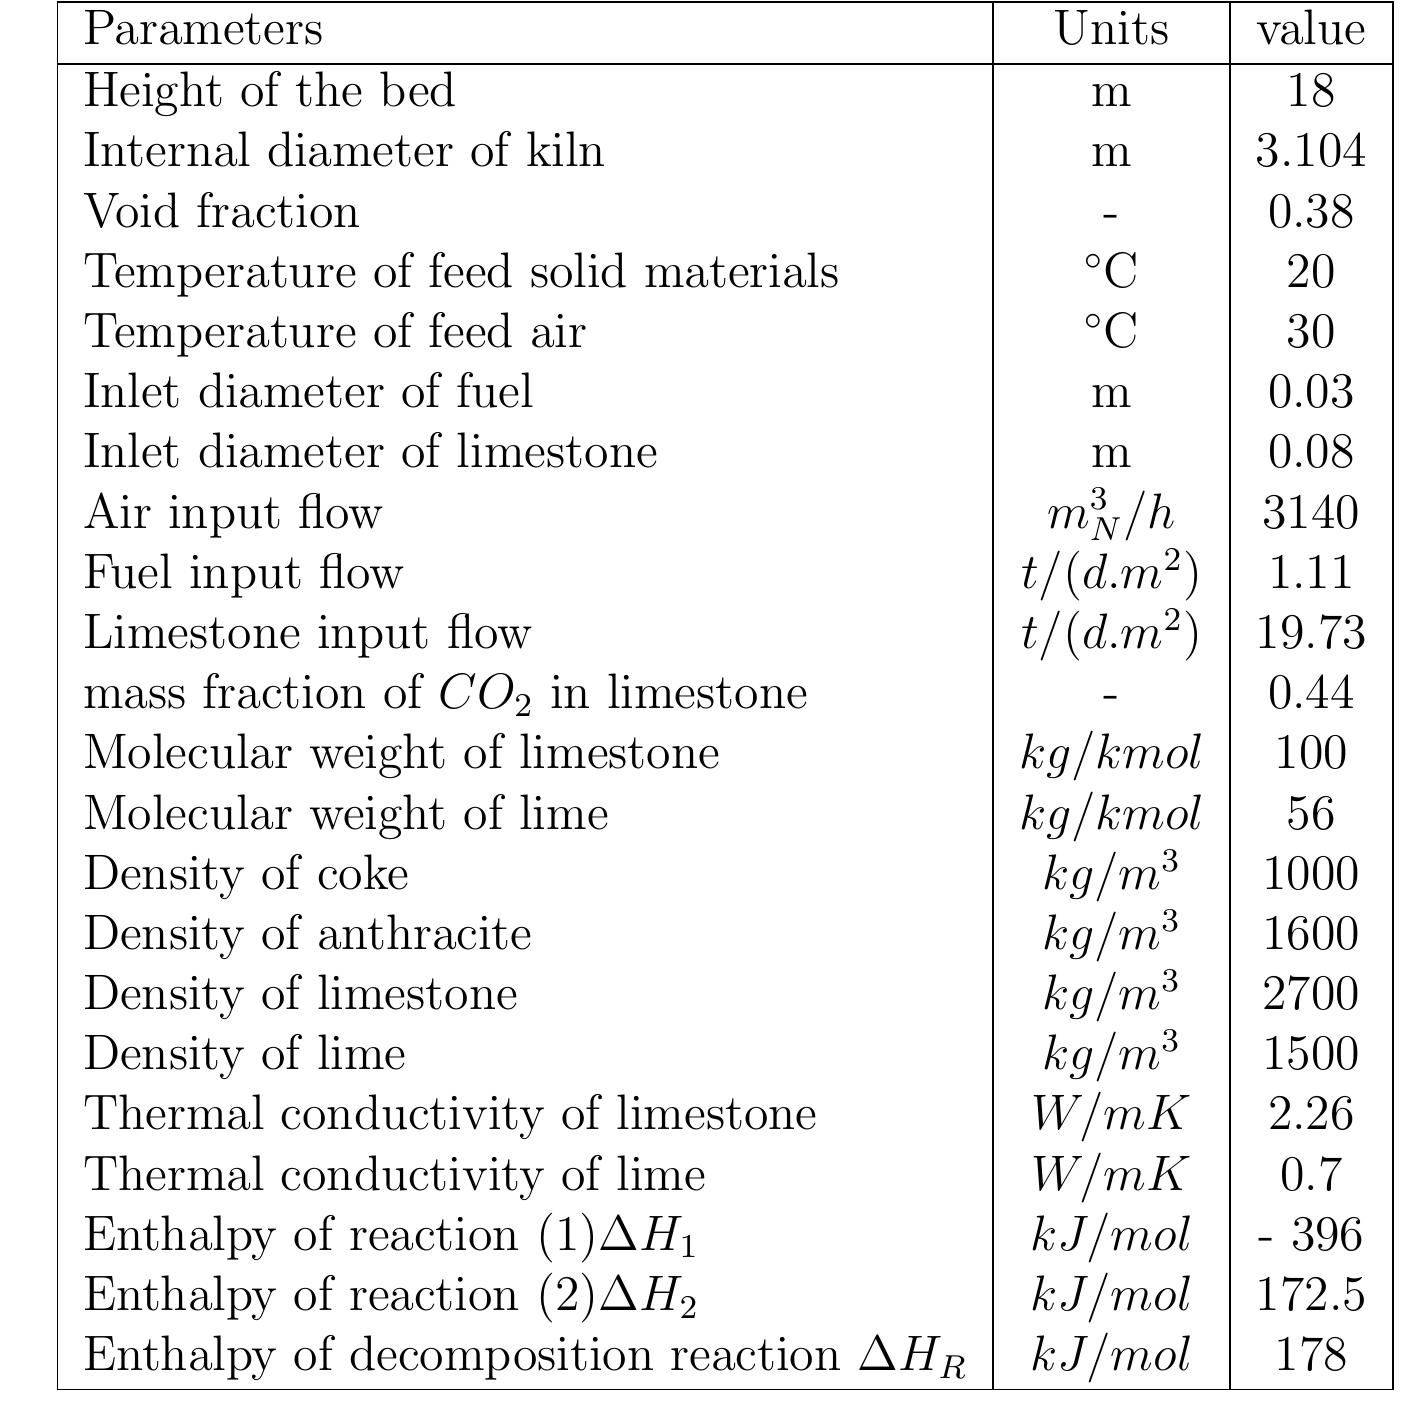
Table 6.4: Input data for the model 6.3). In calcination zone, the coke combustion rate increases and the temperatures of the gas phase and solid phase rise faster to maximum temperatures of 1300, 1200 and 1100 °C for coke, gas and lime respectively at 11 m. At the beginning of the calcination zone, the limestone temperature and the lime temperature are the same but the lime temperature increases faster with the increase of limestone calcination when the heat is transferred to the limestone surface by convection. The temperature of limestone begins to decrease before it leaves the calcination zone, which is partly due to the consumption of energy by the decomposition reaction. At the length ap- proximately of 12 m, the calcination of limestone is stopped and lime starts in cooling by the air entering the kiln from the bottom where the lime gives away the heat to the countercurrent flowing air. Due to the excess air number of 1.14 used in the model, the lime exit with low temperature about 33 °C and the flue gas exits with a high temperature of about 150 °C.
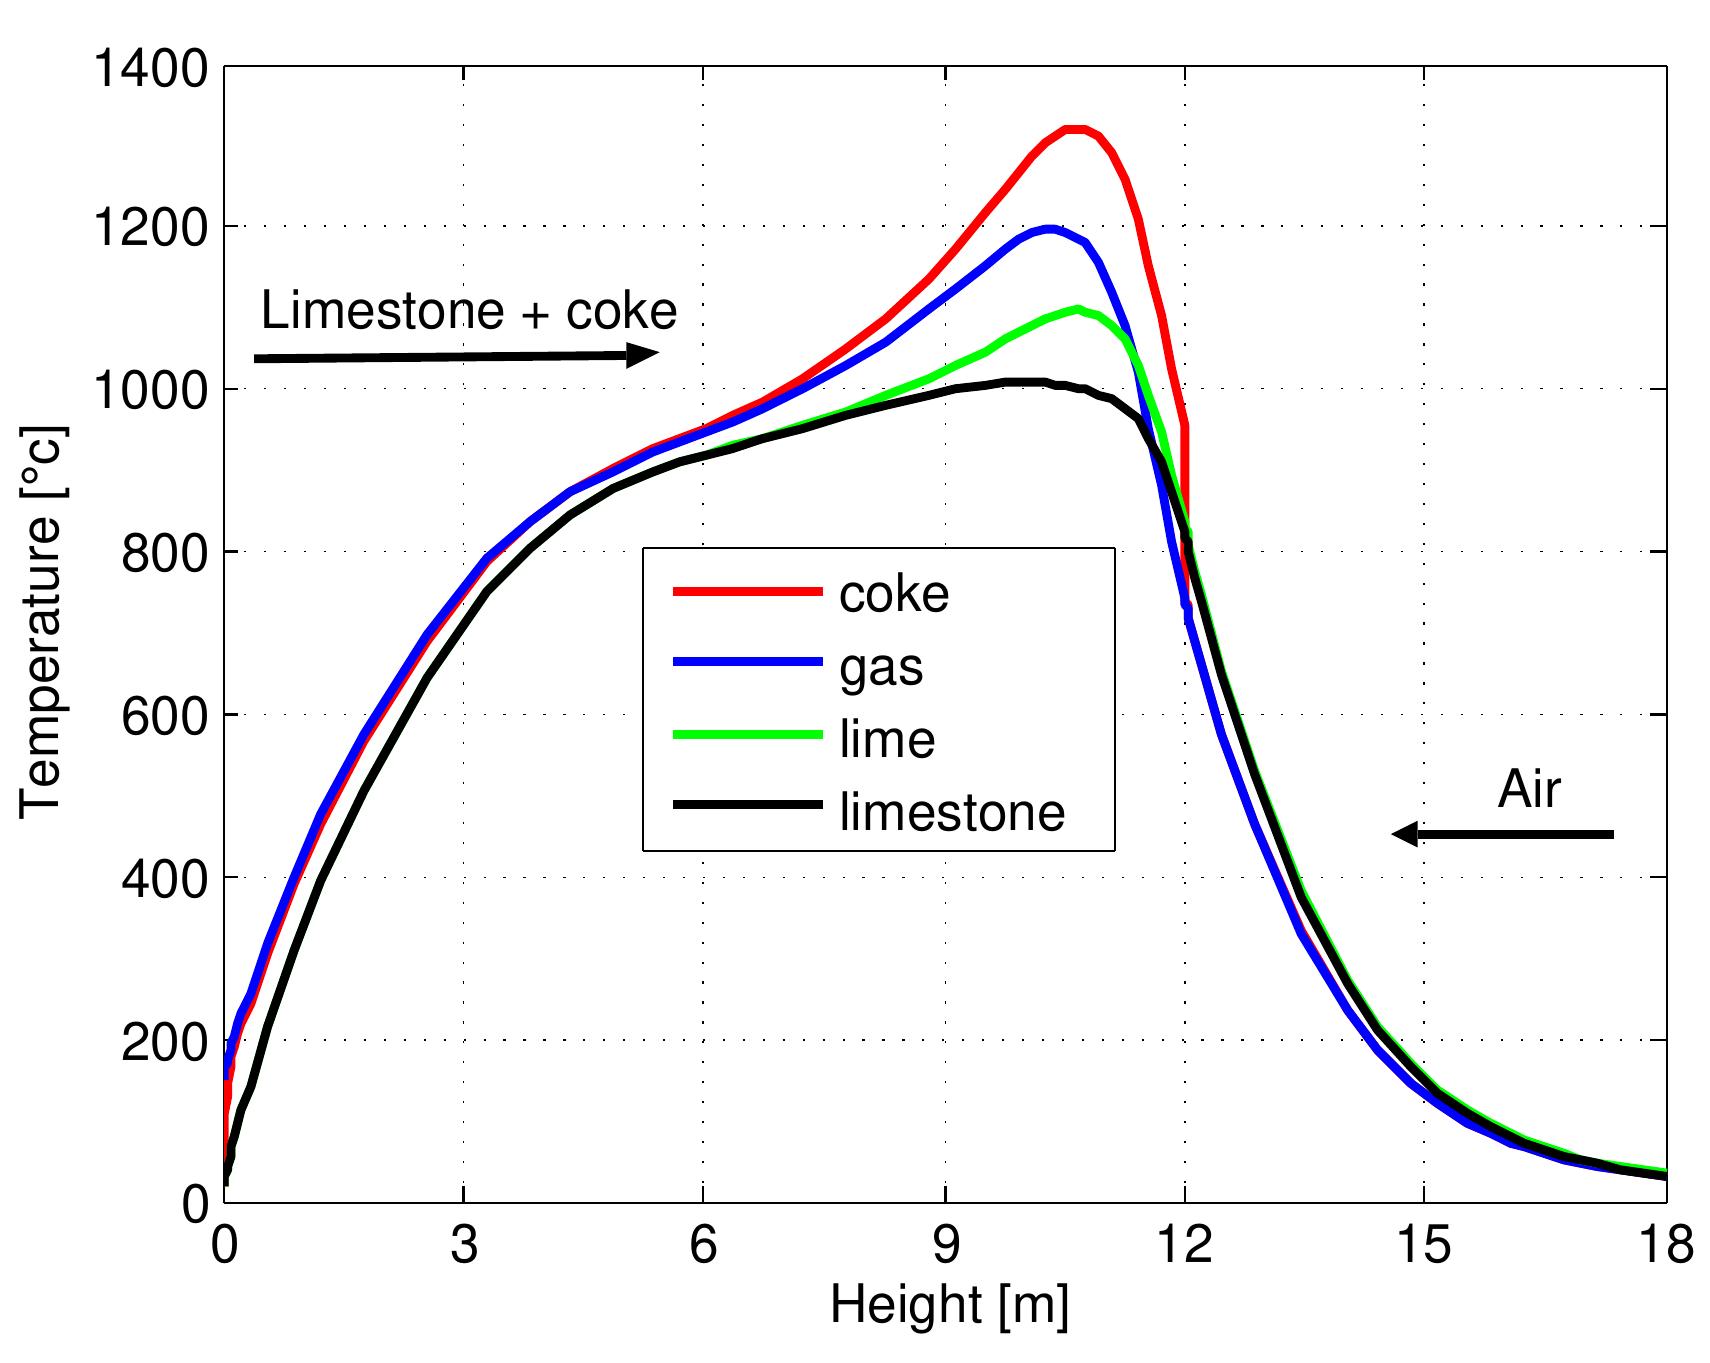
Figure 6.2: Temperature profiles along the kiln.
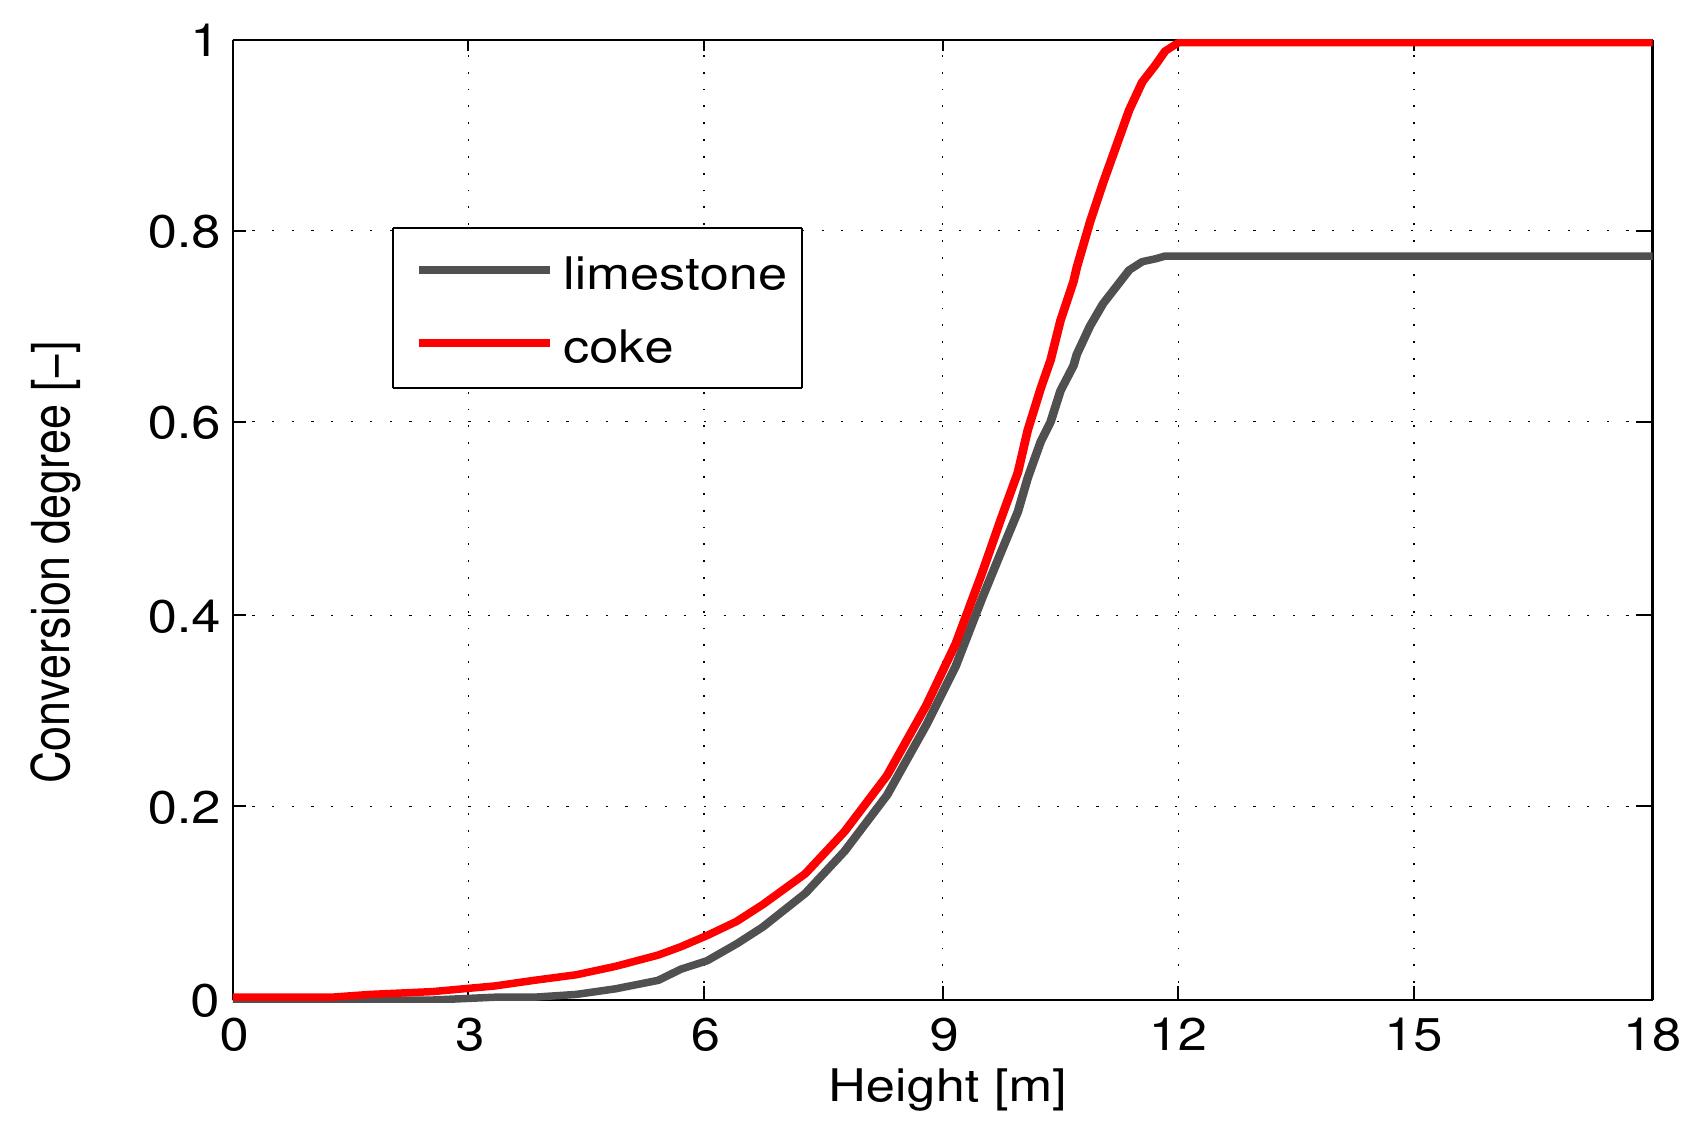
Figure 6.3: Profiles of conversion degree along the kiln.
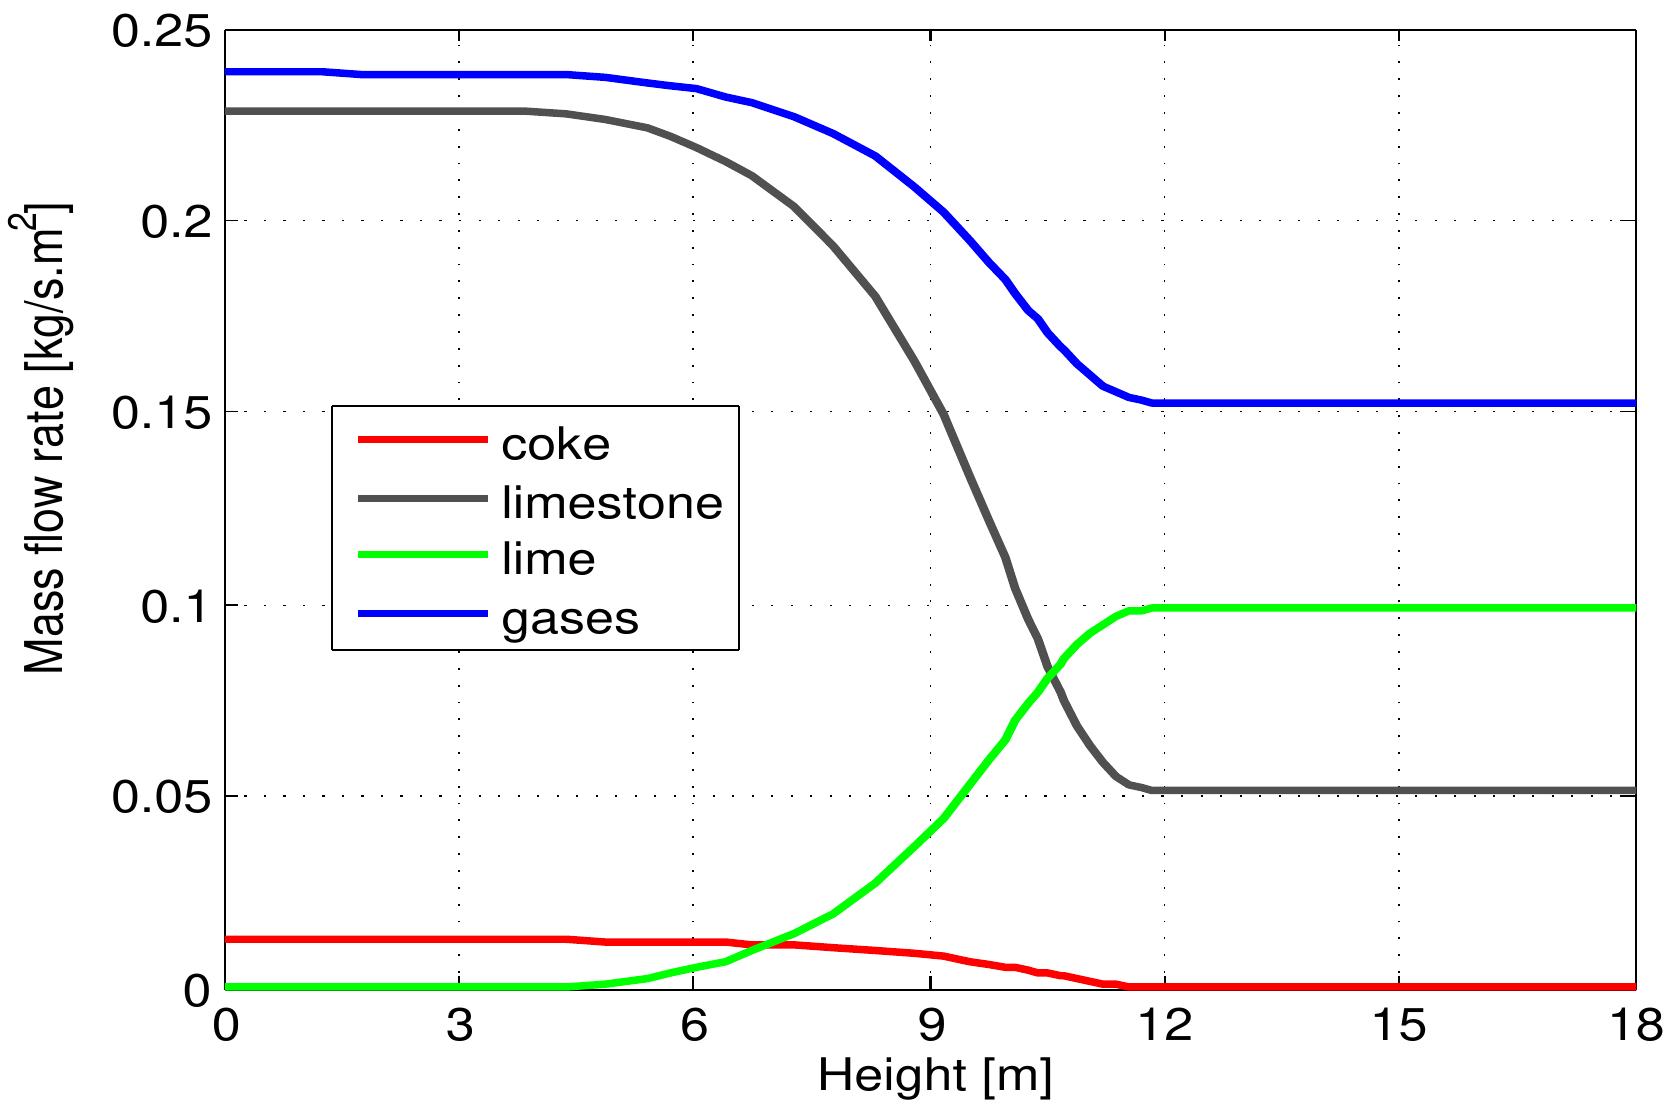
Figure 6.4: Profiles of mass flows along the kiln.
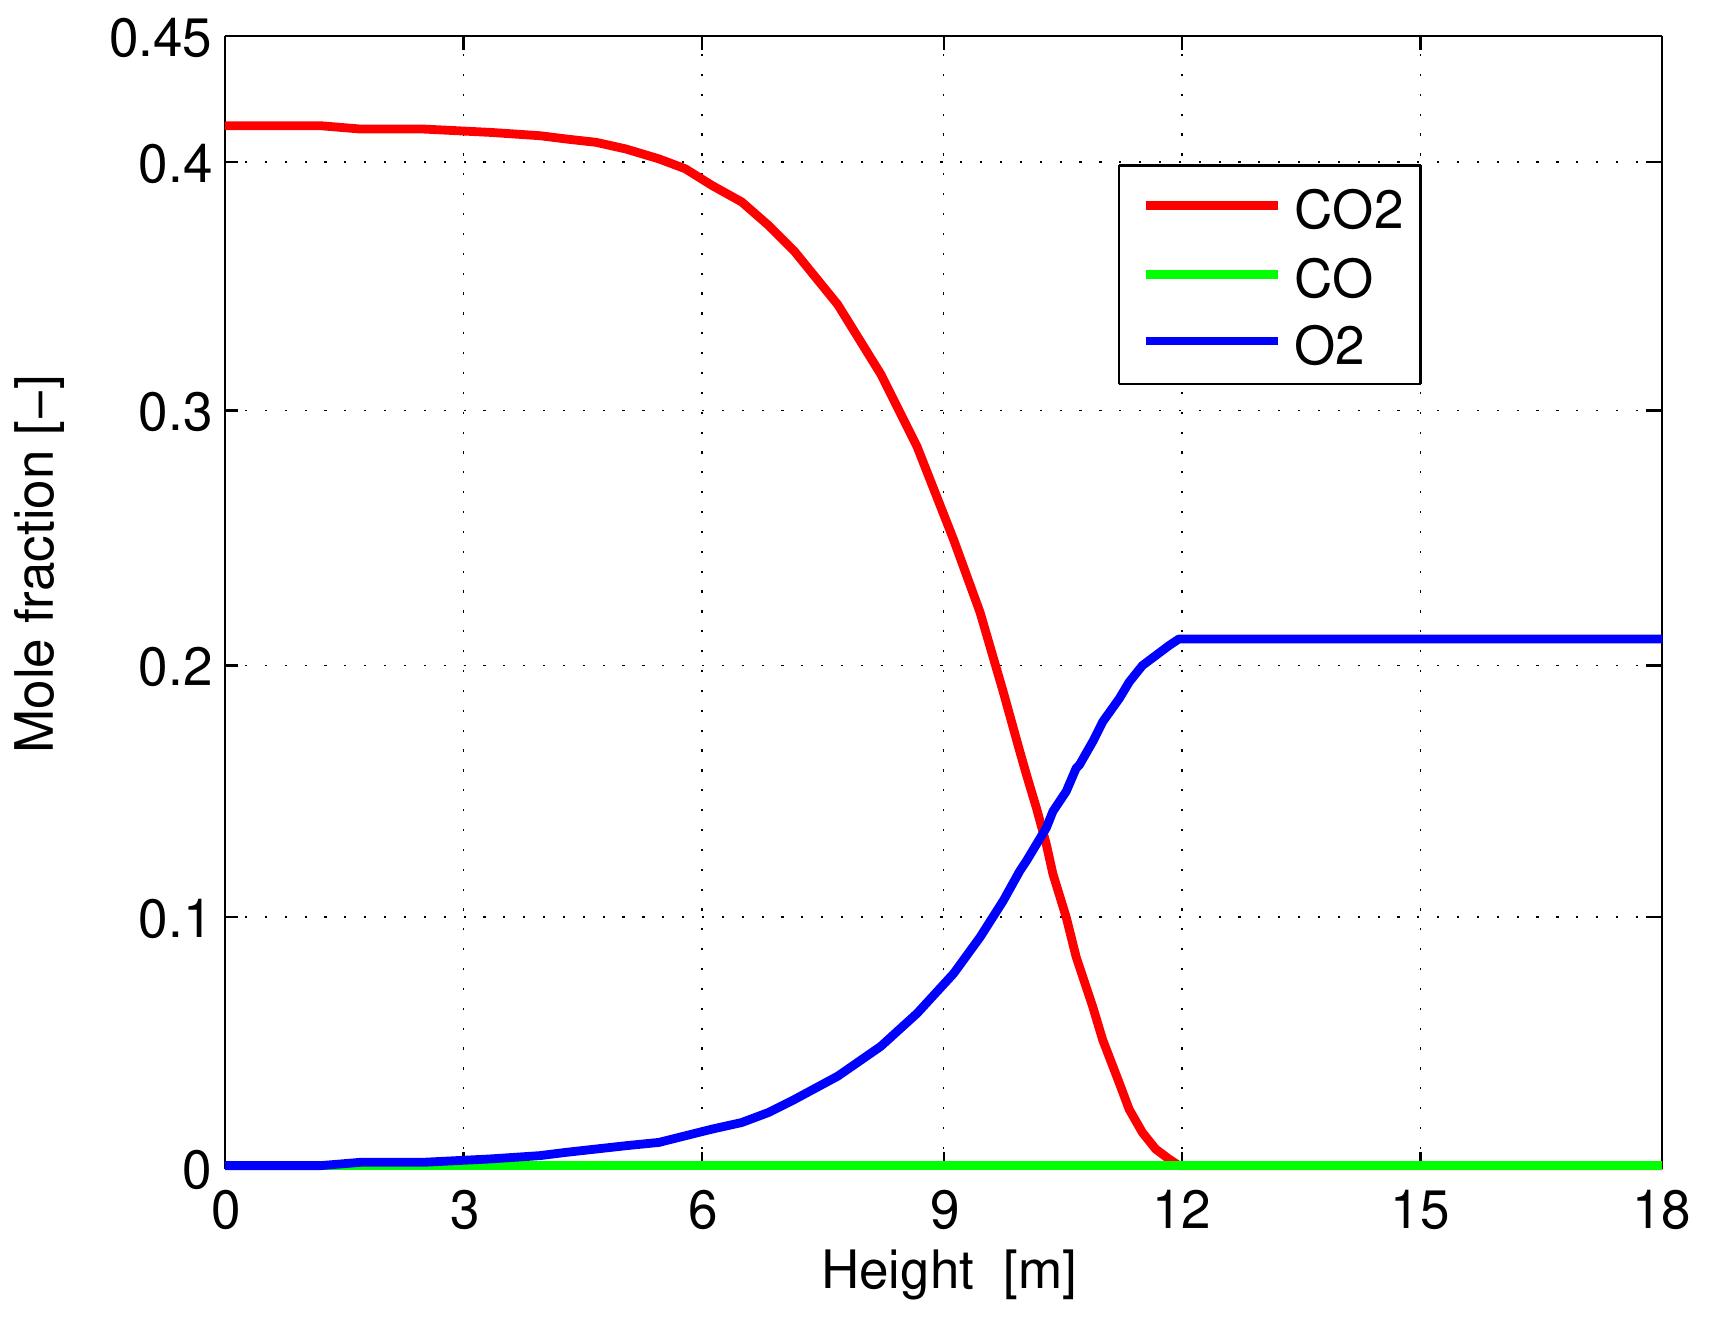
Figure 6.5: Profiles of volumetric concentration of the gas along the kiln. than the theoretical. consumption by the combustion reaction. Its reaction with coke forms the net prod- uct CO, because CO is rapidly oxidized in the gas phase when oxygen is present. Consequently, the concentration of CO 2 increases sharply due to CO, production from limestone calcination and coke combustion while the mole fraction of CO stays constant where the oxygen is present because the actual air excess number is higher than the theoretical. A strong change in gas velocity profile over the height of the kiln is shown in Figure 6.6. The gas velocity profile is strongly influenced by the gas temperature profile because the density of gas depends on the gas temperature which experiences large changes over the kiln height and also because of the supply of C'O2 gases which are released from the limestone calcination in the calcination zone. It can be seen that the maximum value of gas velocity of 2.3 m/s is encountered with the maximum gas temperature. When increasing the gas velocity, there is an increase of heat and mass transfer between solid and gas phases inside the kiln.
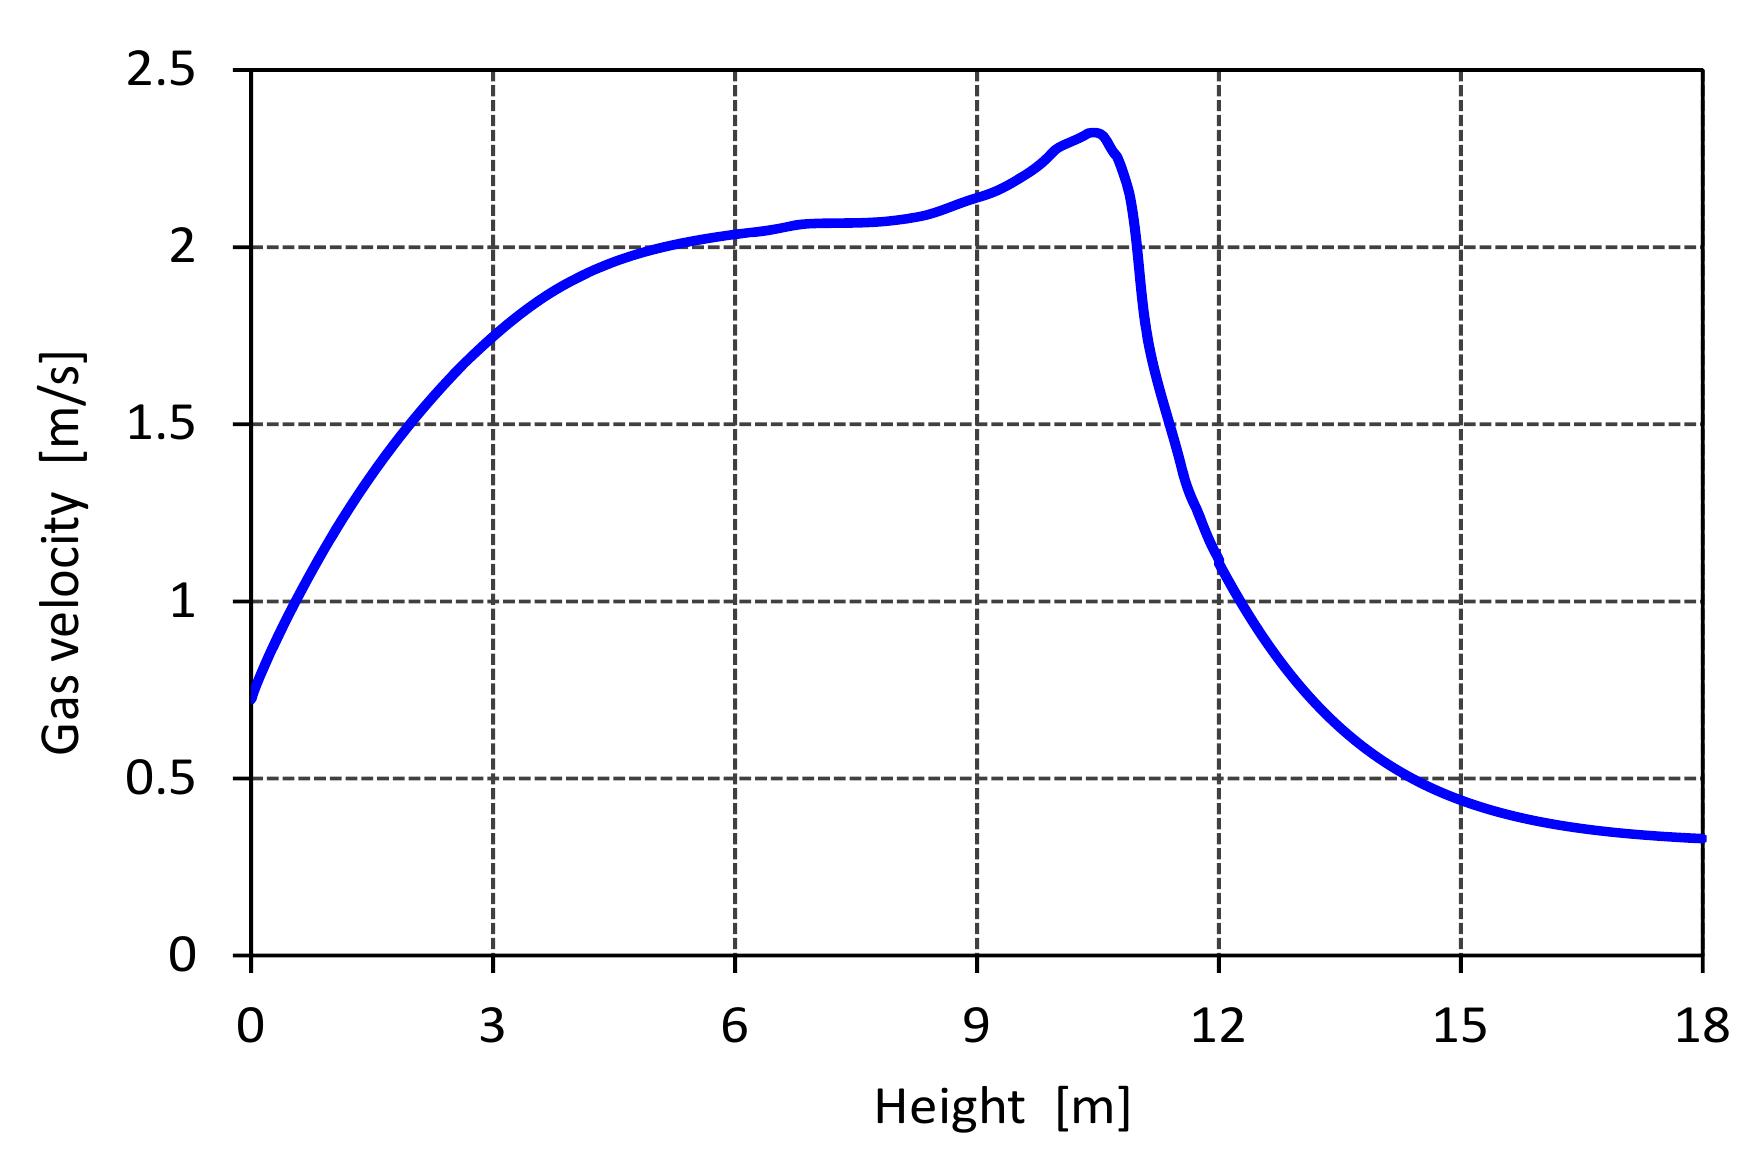
Figure 6.6: Profile of gas velocity a long the kiln. Figure 6.7 shows the profile of pressure drop along the kiln. The pressure drop de- pends on the gas velocity, void fraction and the properties of gases according to Ergun’s law. In the cooling zone, the pressure drop increases slightly when increas- ing the air velocity. After that, it increases sharply due to the large increase in gas velocity in the calcination zone.
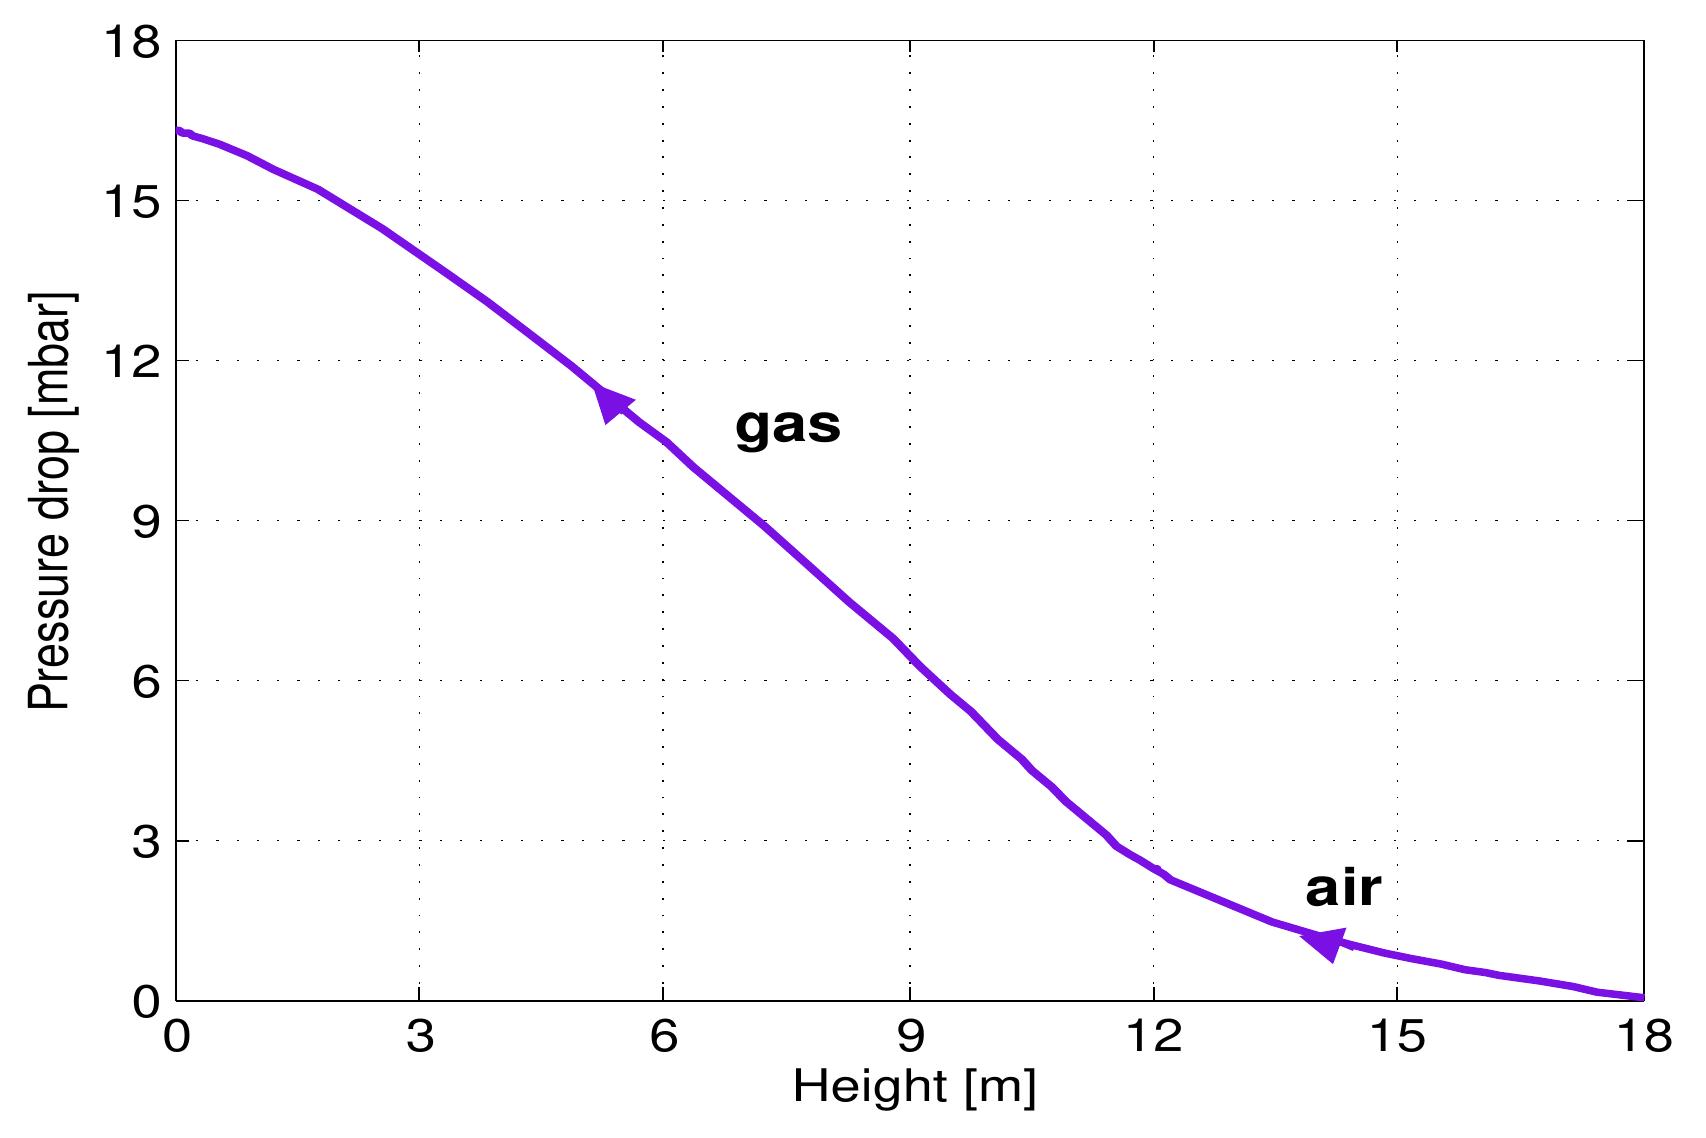
Figure 6.7: Profile of pressure drop of the gas along the kiln.
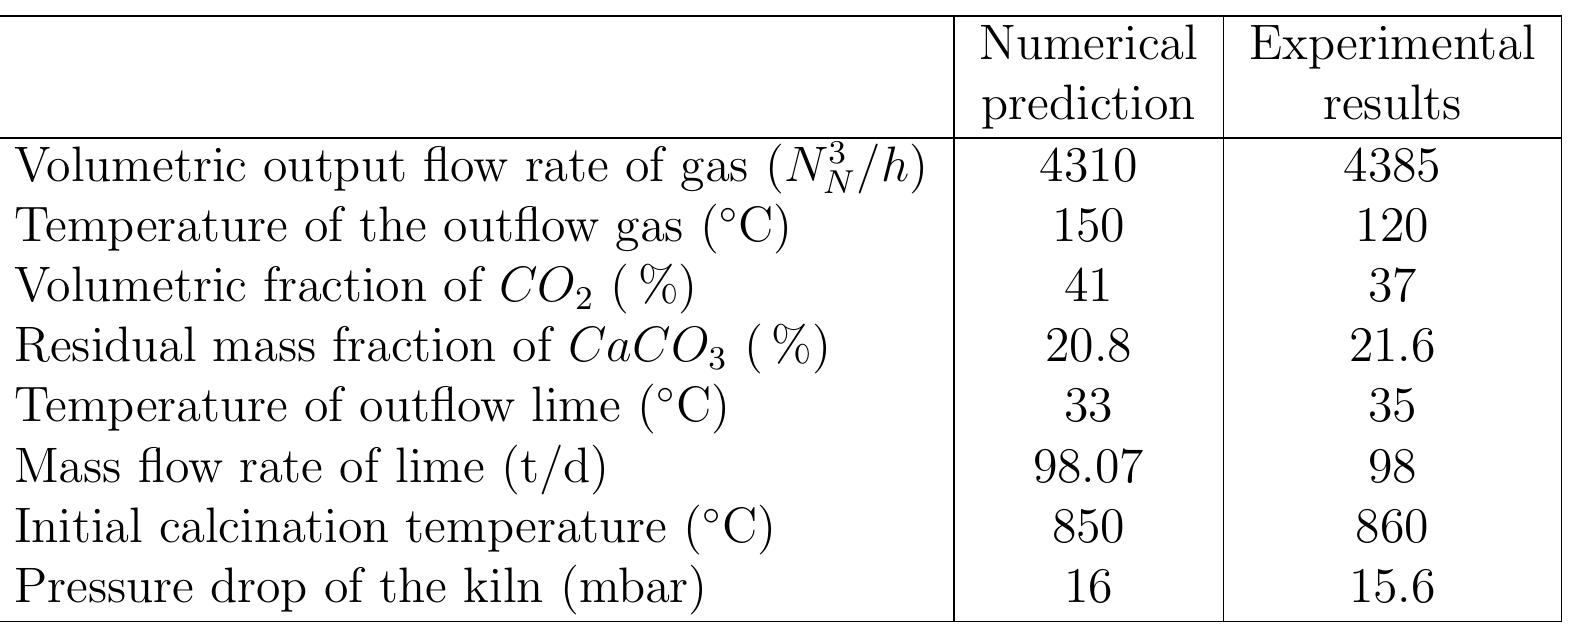
Table 6.5: Comparison between predicted and measured results
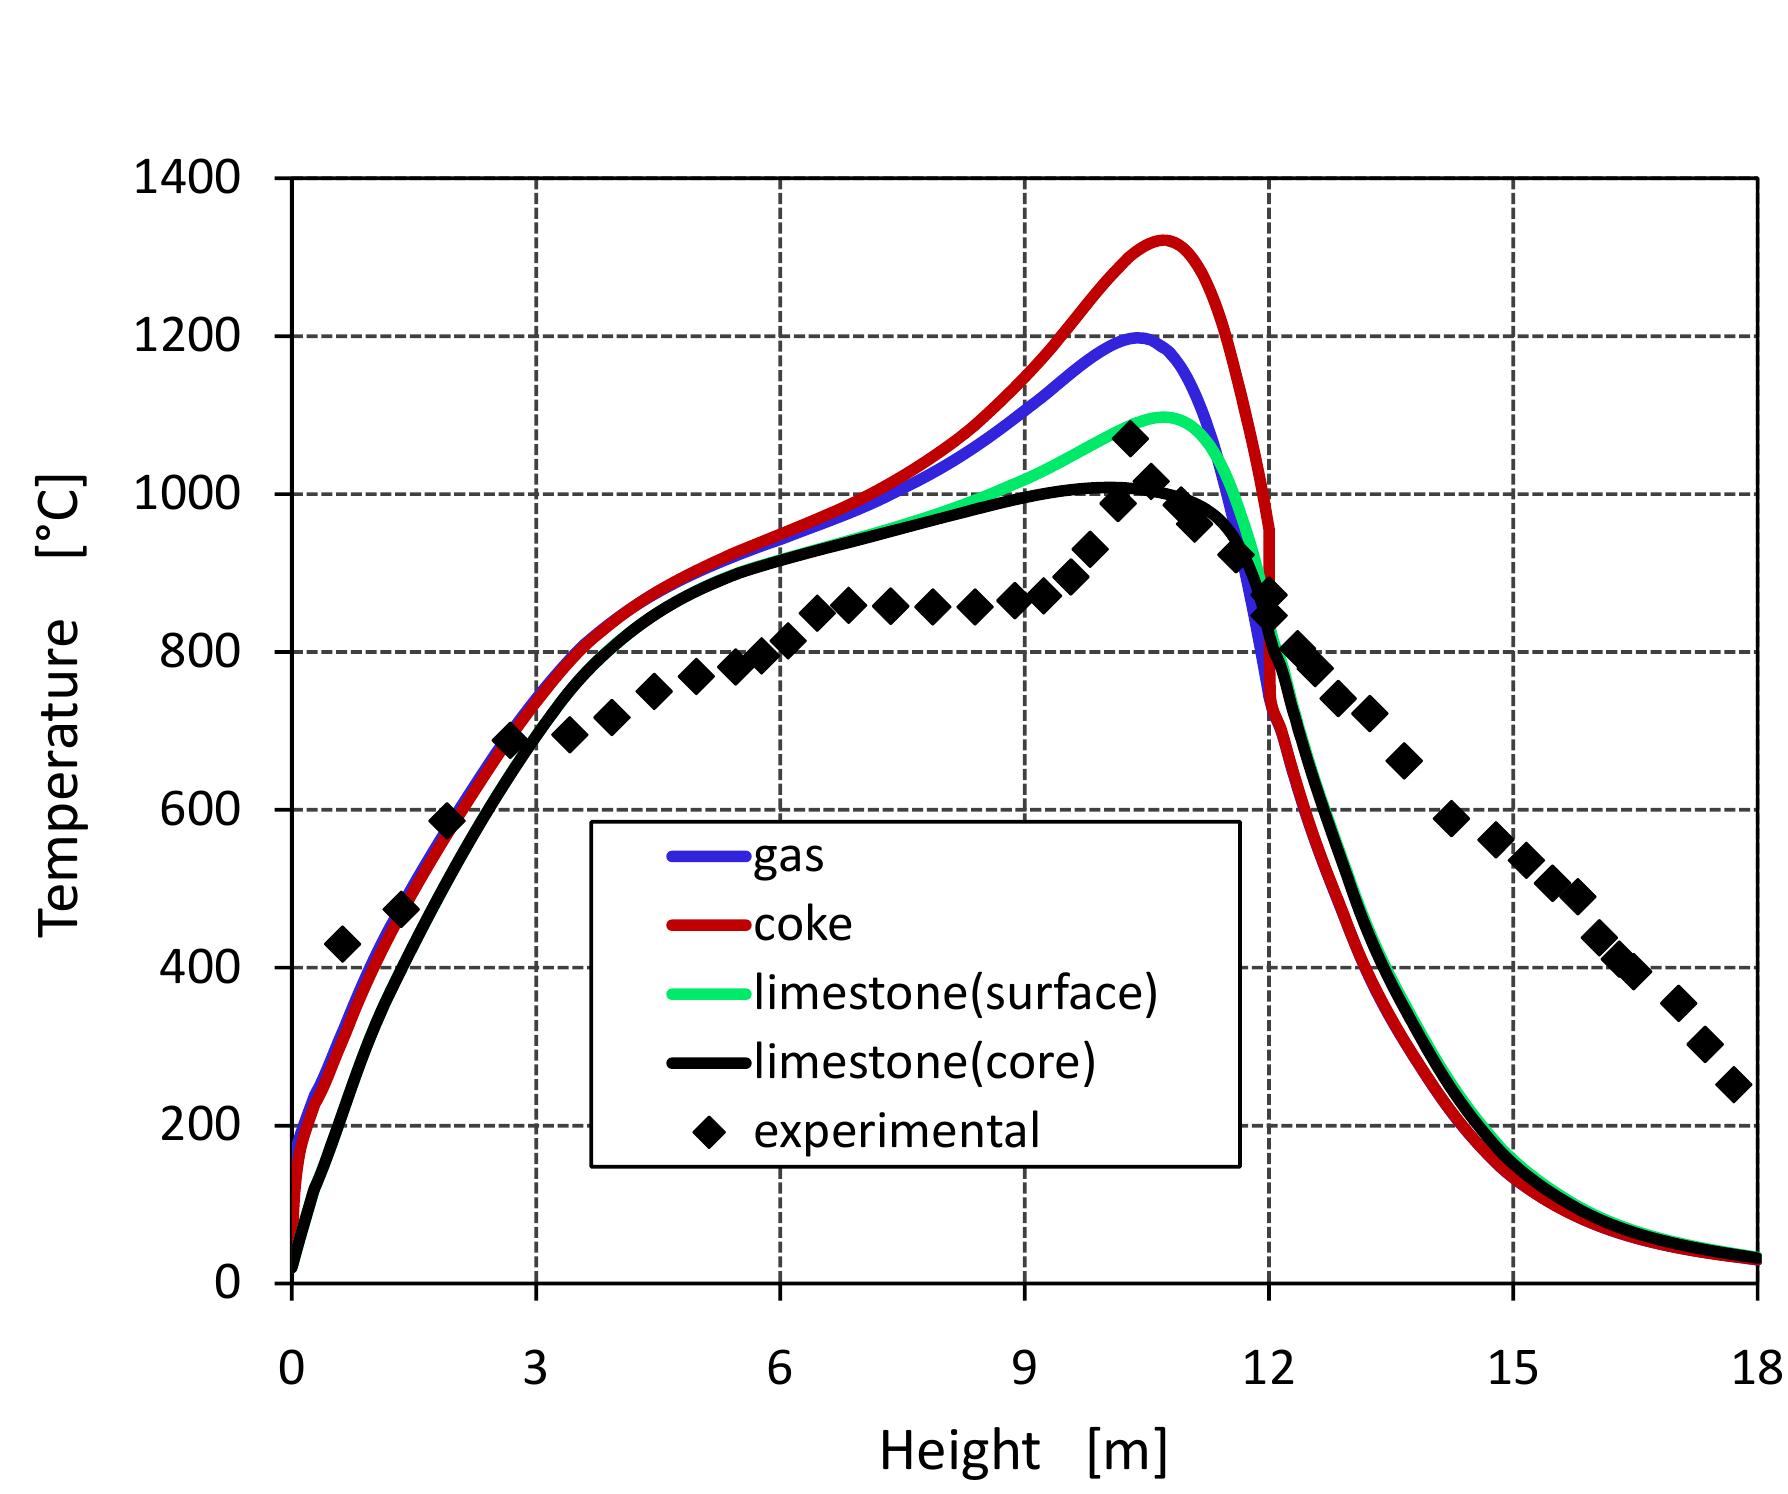
Figure 6.8: Temperature Profiles predicted and measured.
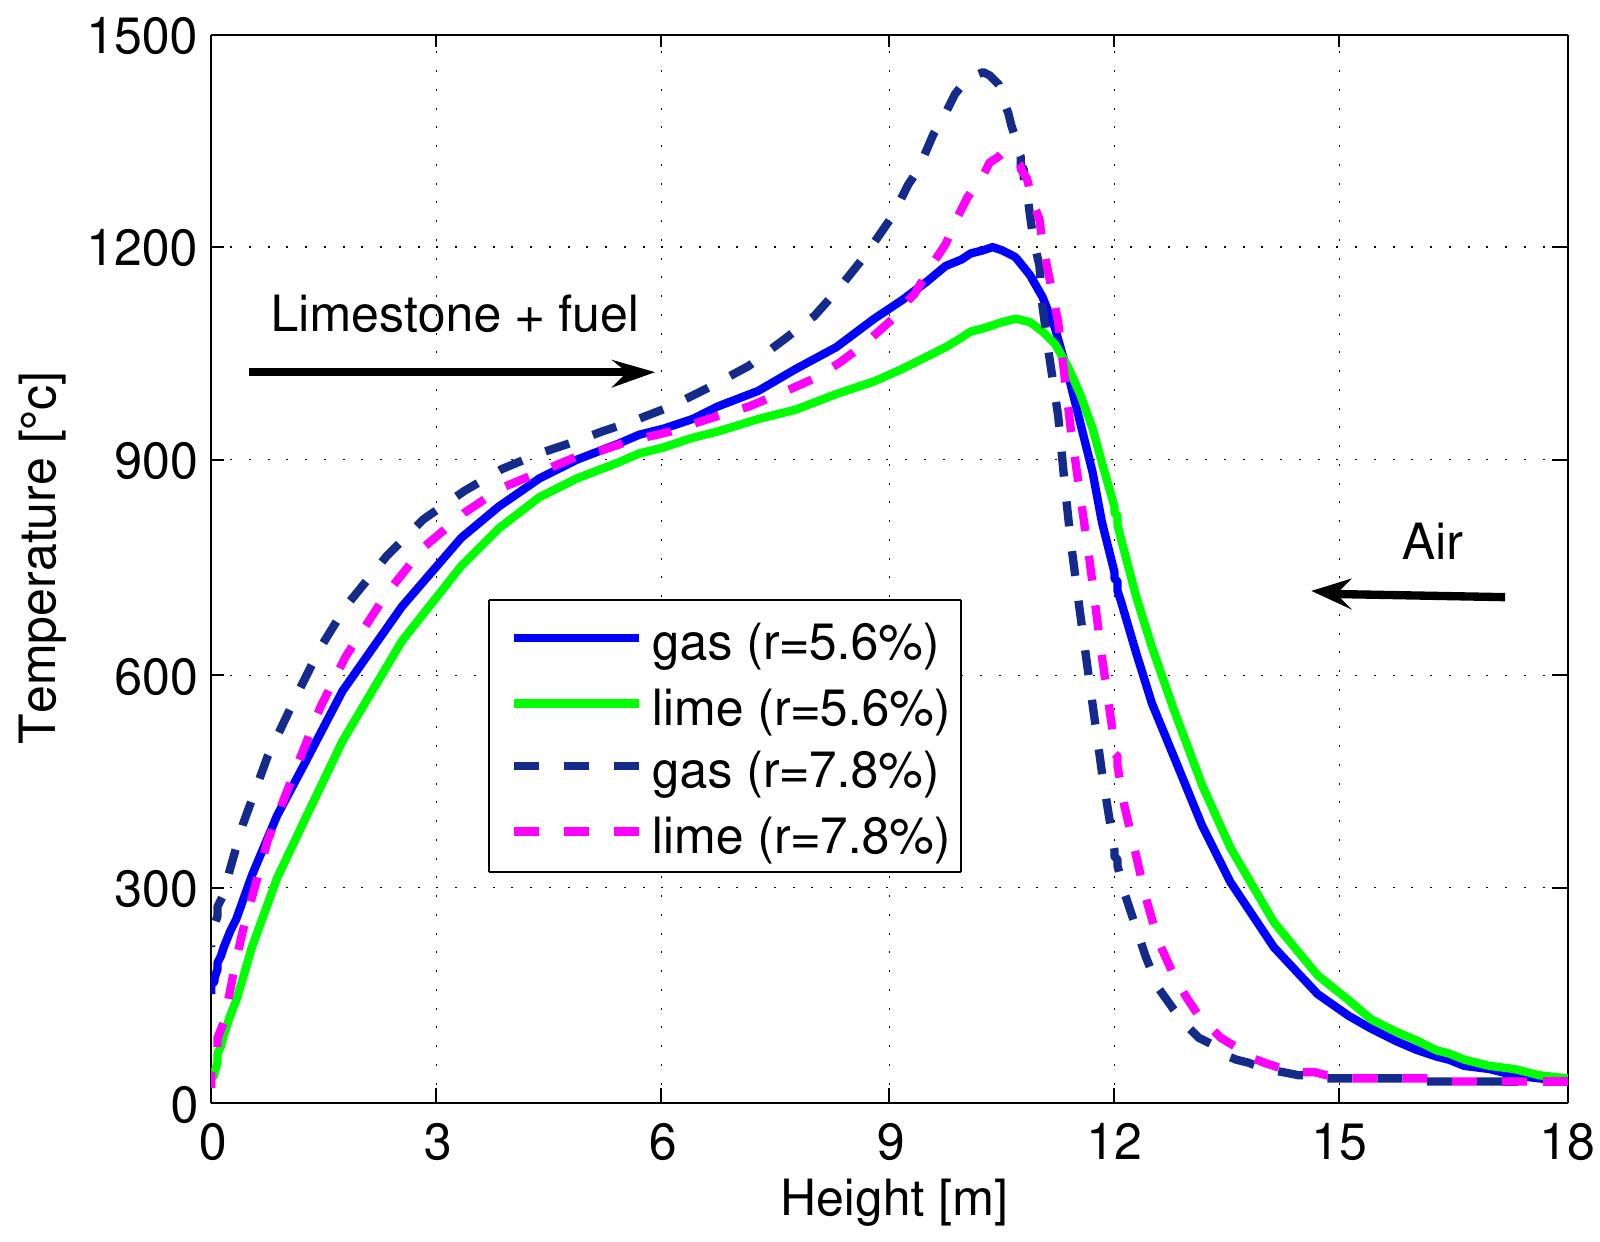
Figure 7.1: Temperature profiles in a mixed feed lime kiln at two fuel ratios and data from table 6.4. ratio. The temperature of lime leaving the kiln from the bottom (z=H) is slightly lower in the case of a high fuel ratio. Due to the decrease in the length of the pre heating zone, the temperature of gases leaving the kiln is higher, although the hea transfer coefficient between the gas and the solid increases because the air exces: number is constant. It is difficult to show all the results various of fuel ratios of the kiln performance, therefore, the results that various fuel ratios effects have on th maximum temperatures of individual streams, the outlet temperatures, the conver: sion of limestone and the content of CO, in flue gas have been shown.
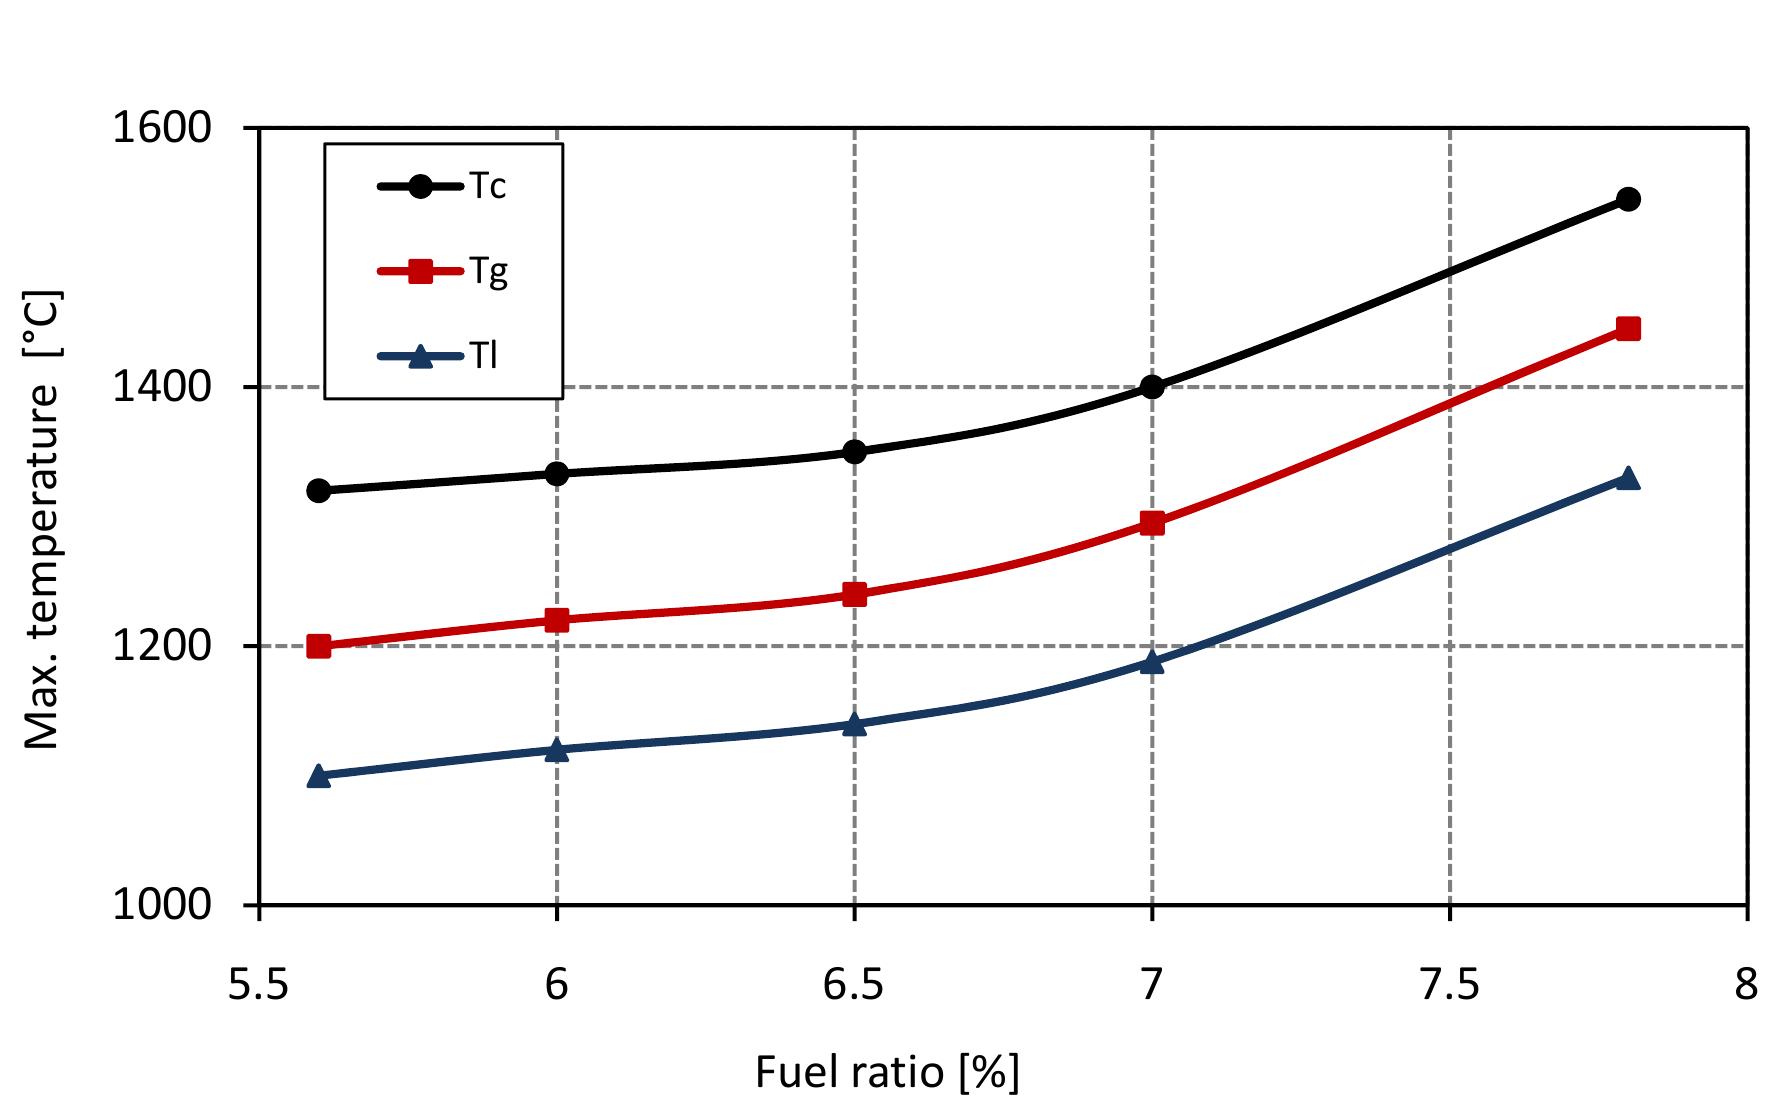
Figure 7.2: Max. temperatures in mixed feed lime kiln at various fuel ratio and data from table 6.4.
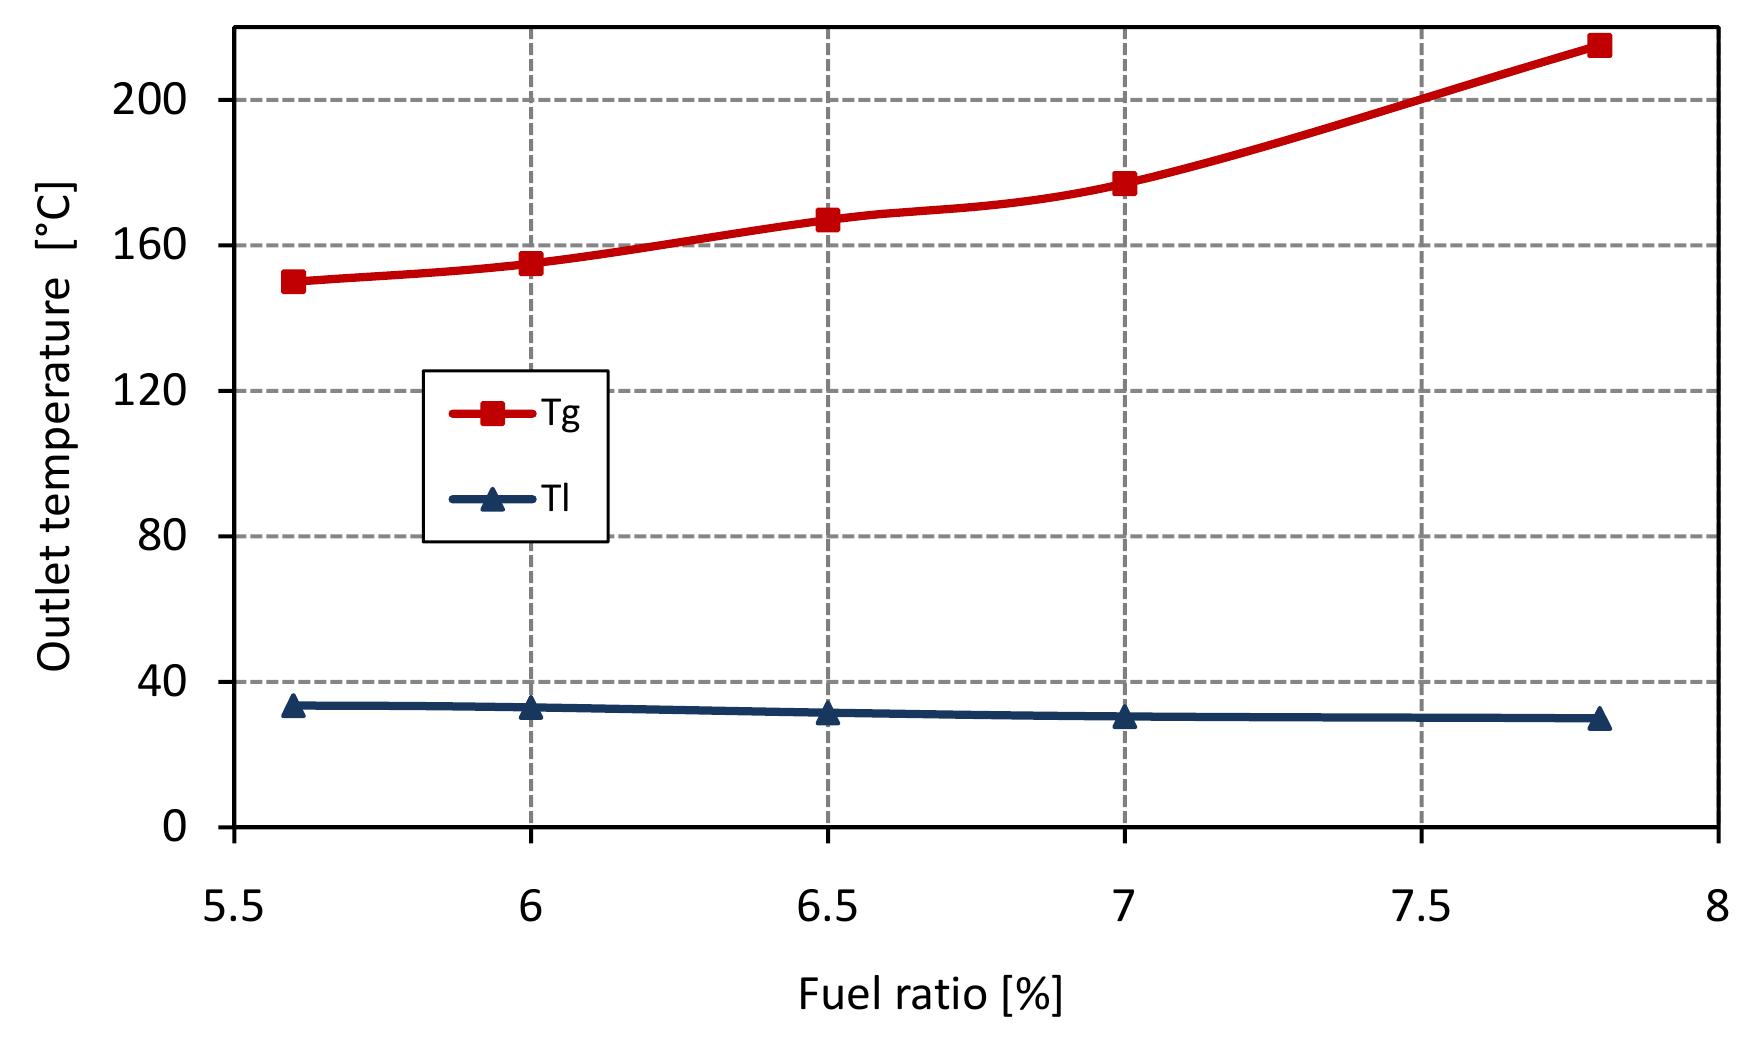
Figure 7.3: Outlet temperatures in mixed feed lime kiln at various fuel ratio and data from table 6.4.
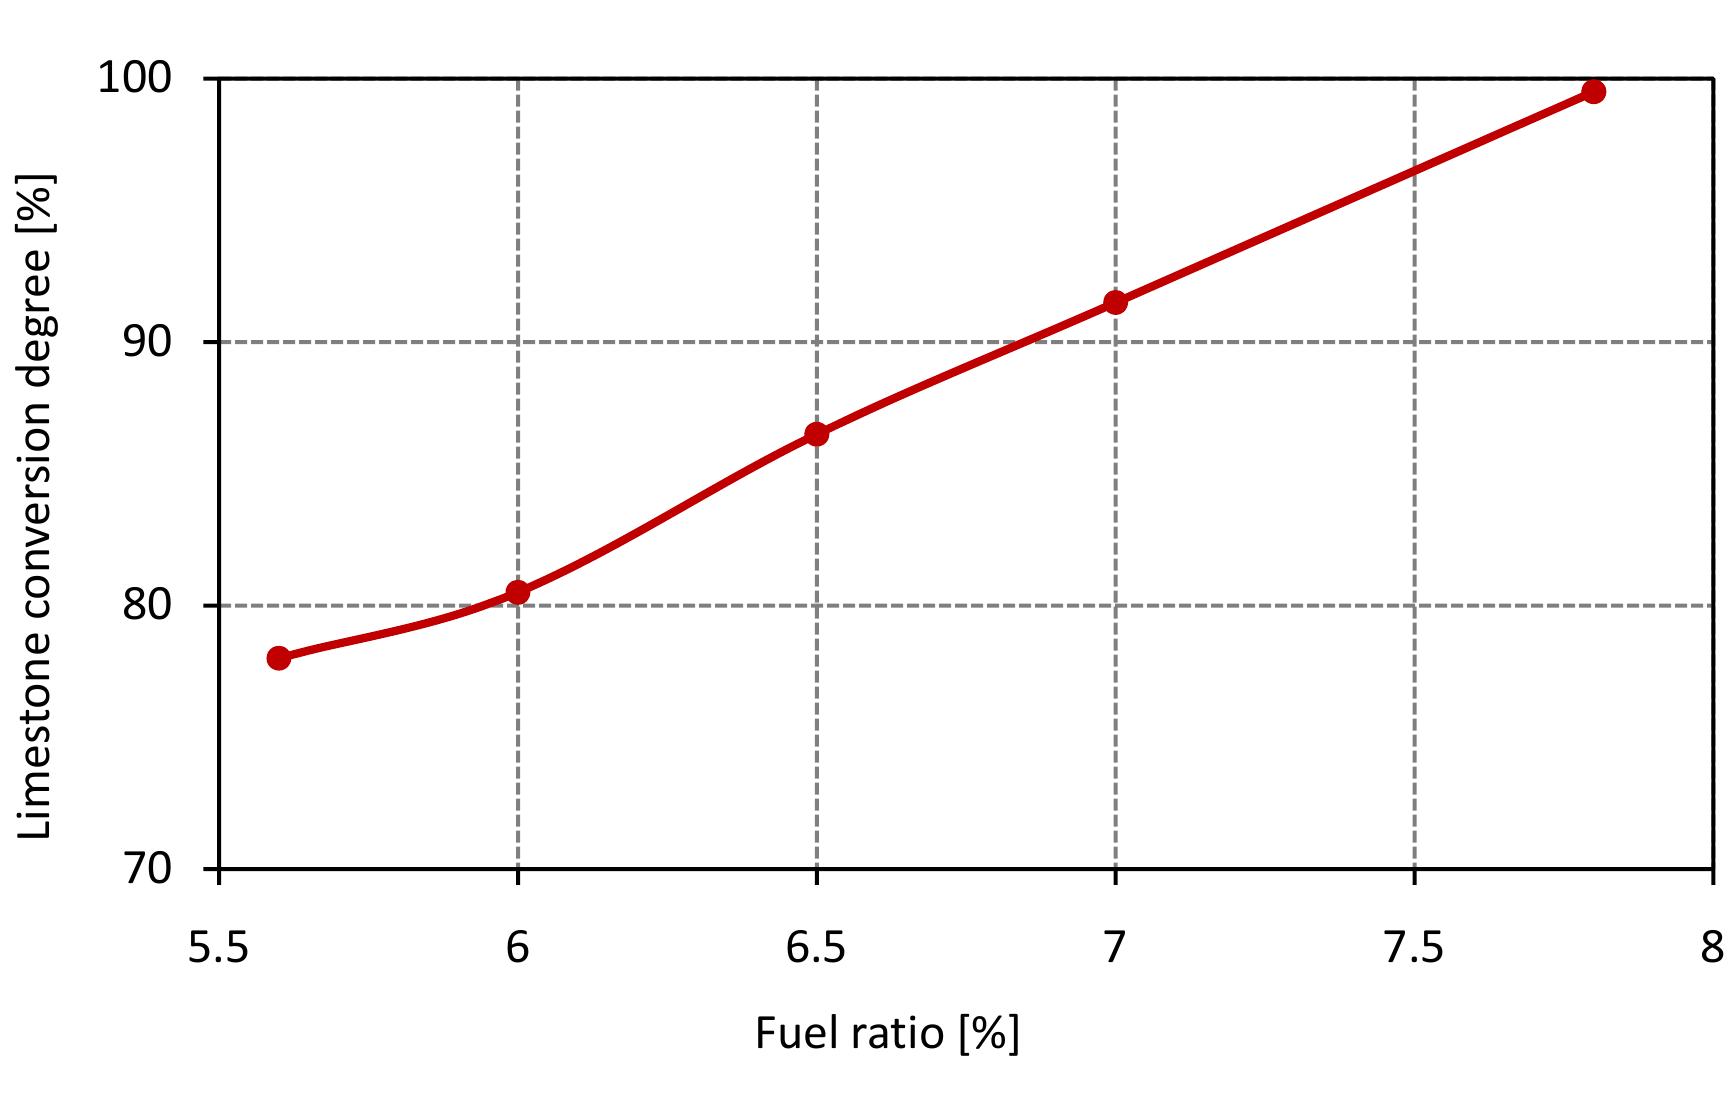
Figure 7.4: Conversion degree of limestone for various fuel ratio and data from table 6.4.
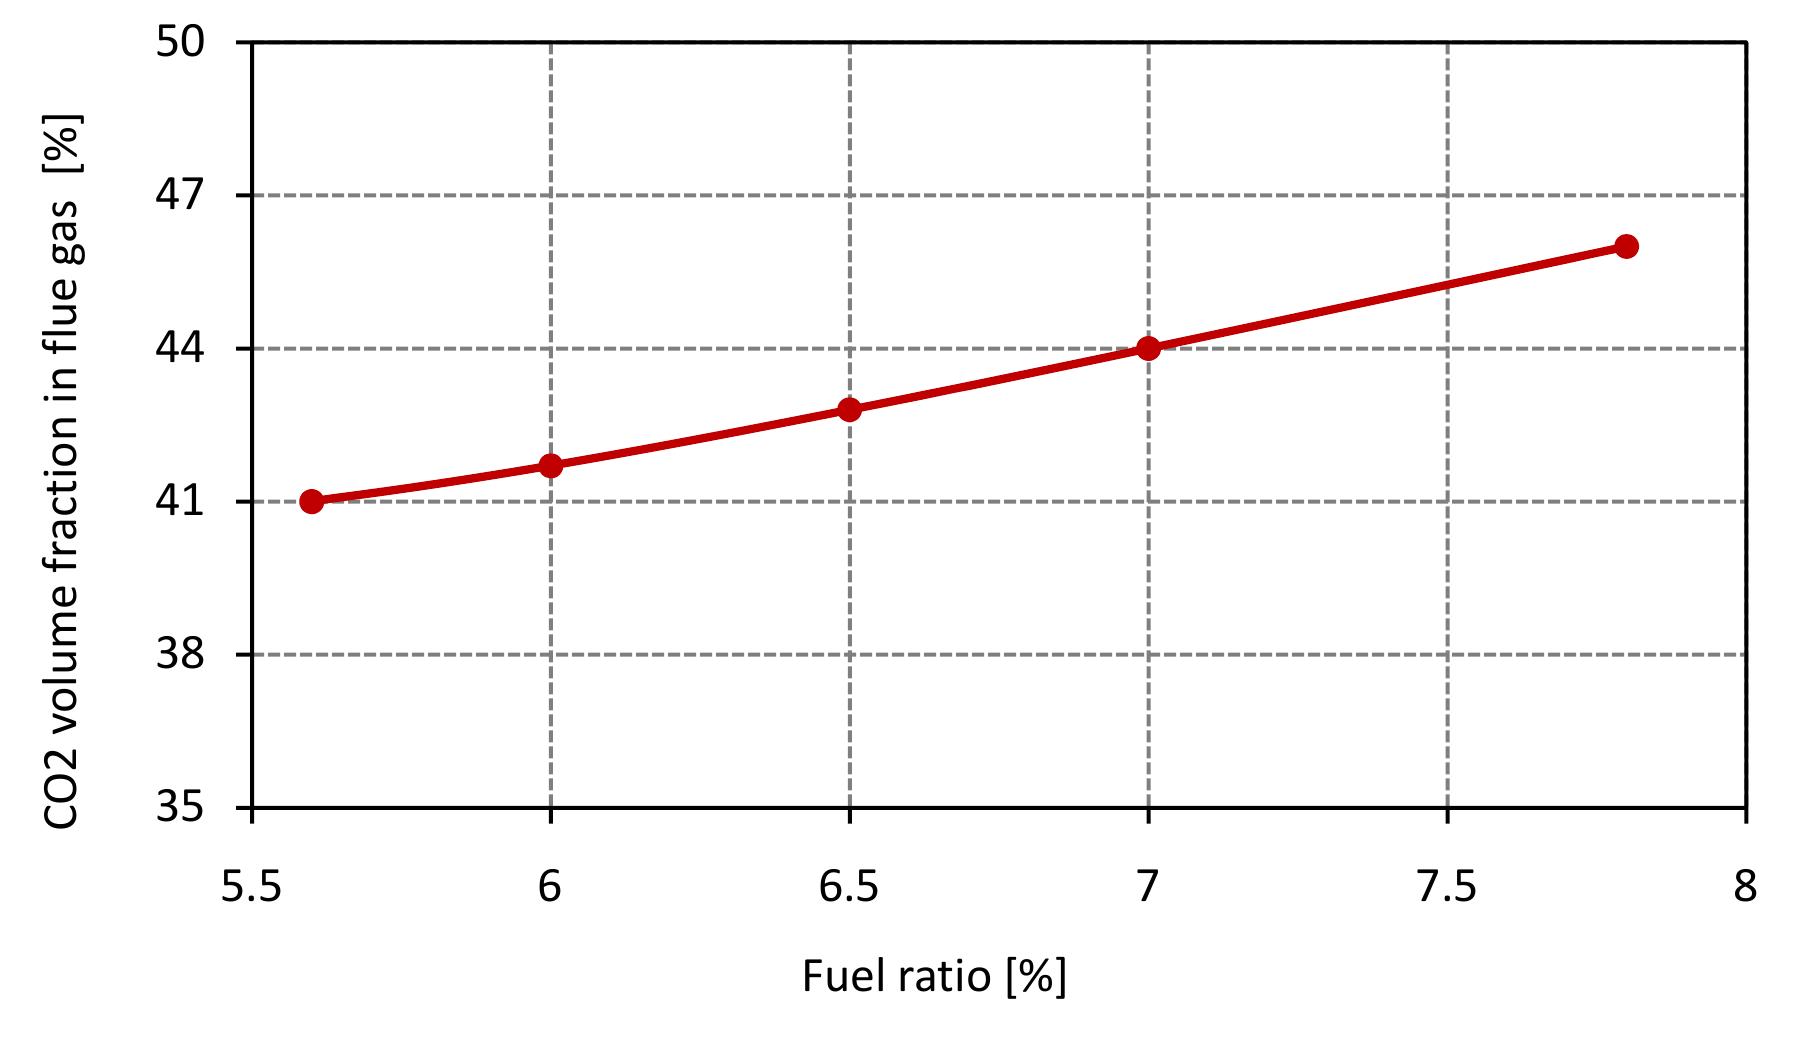
Figure 7.5: Volume fraction of C’O2 in flue gas for various fuel ratio and data from table 6.4.
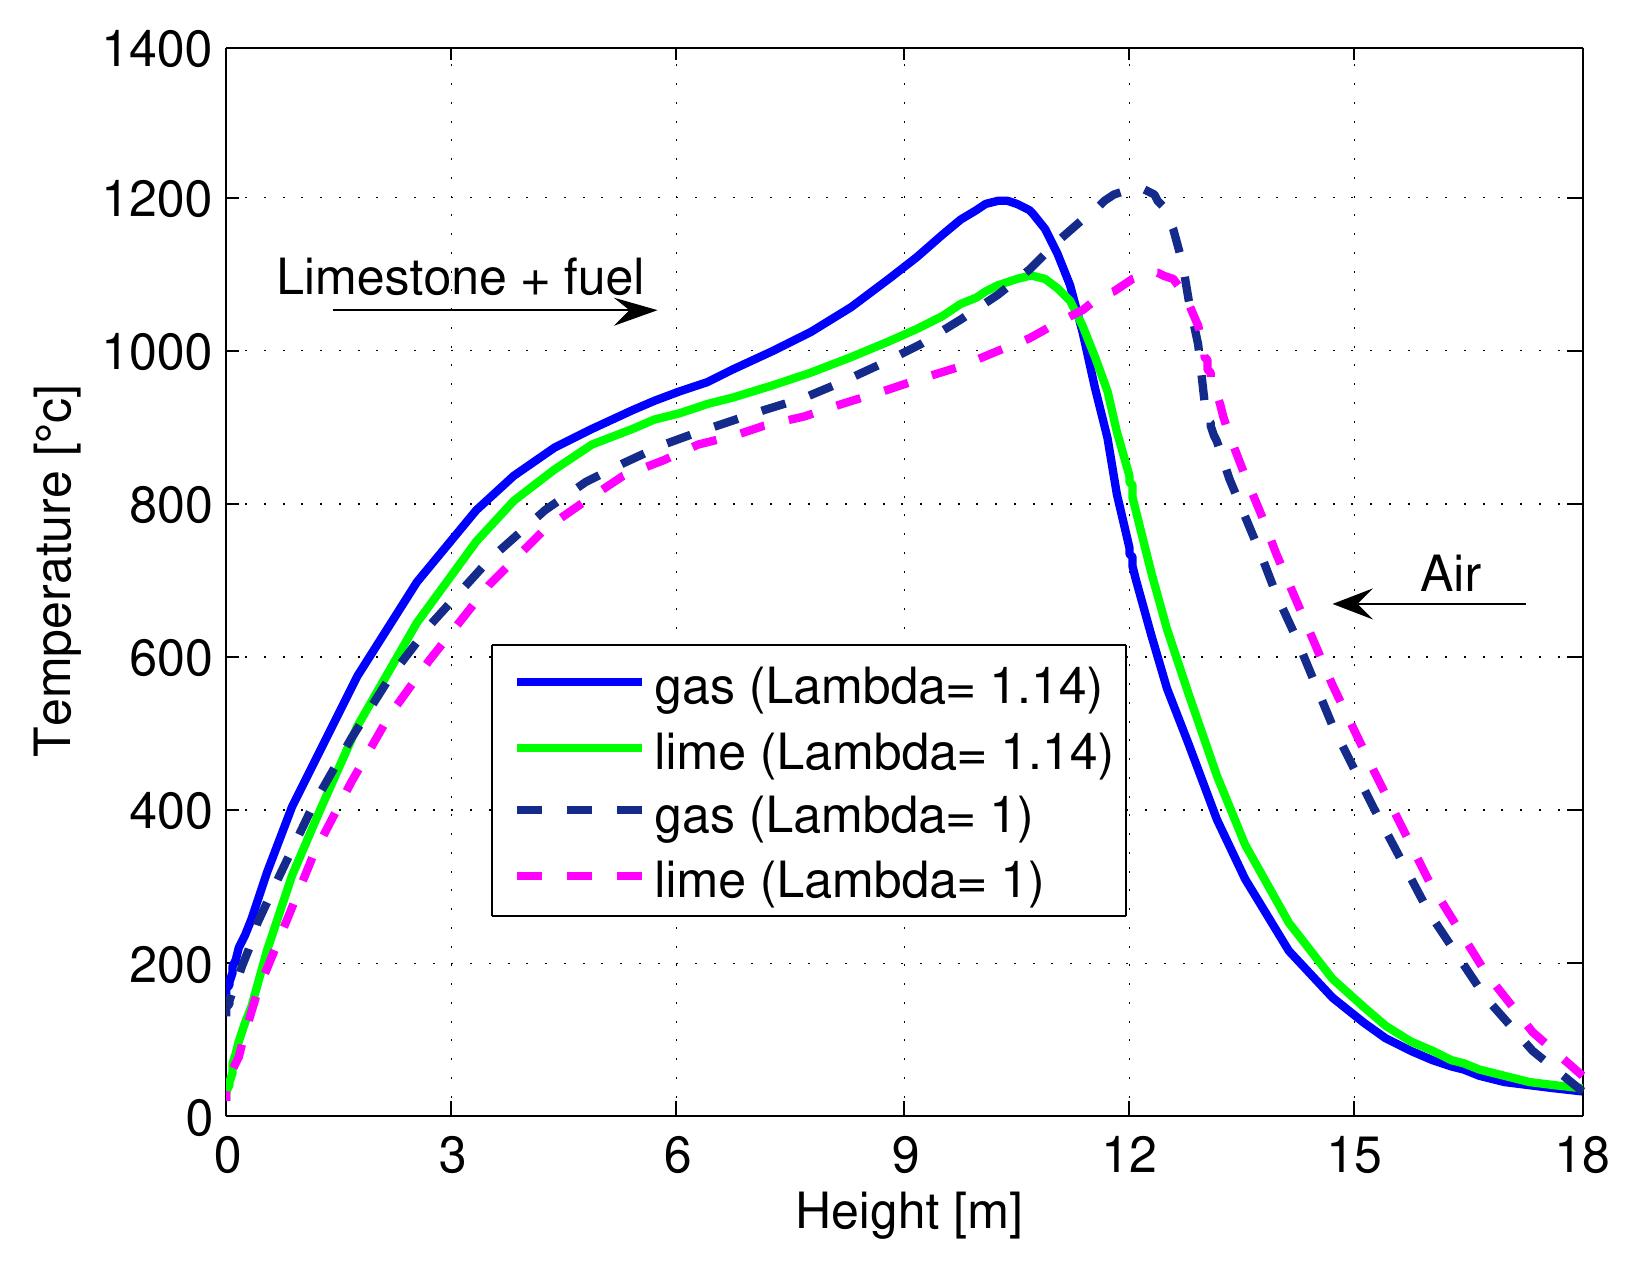
Figure 7.6: Temperature profiles in mixed feed lime kiln at two air excess ratio and data from table 6.4.
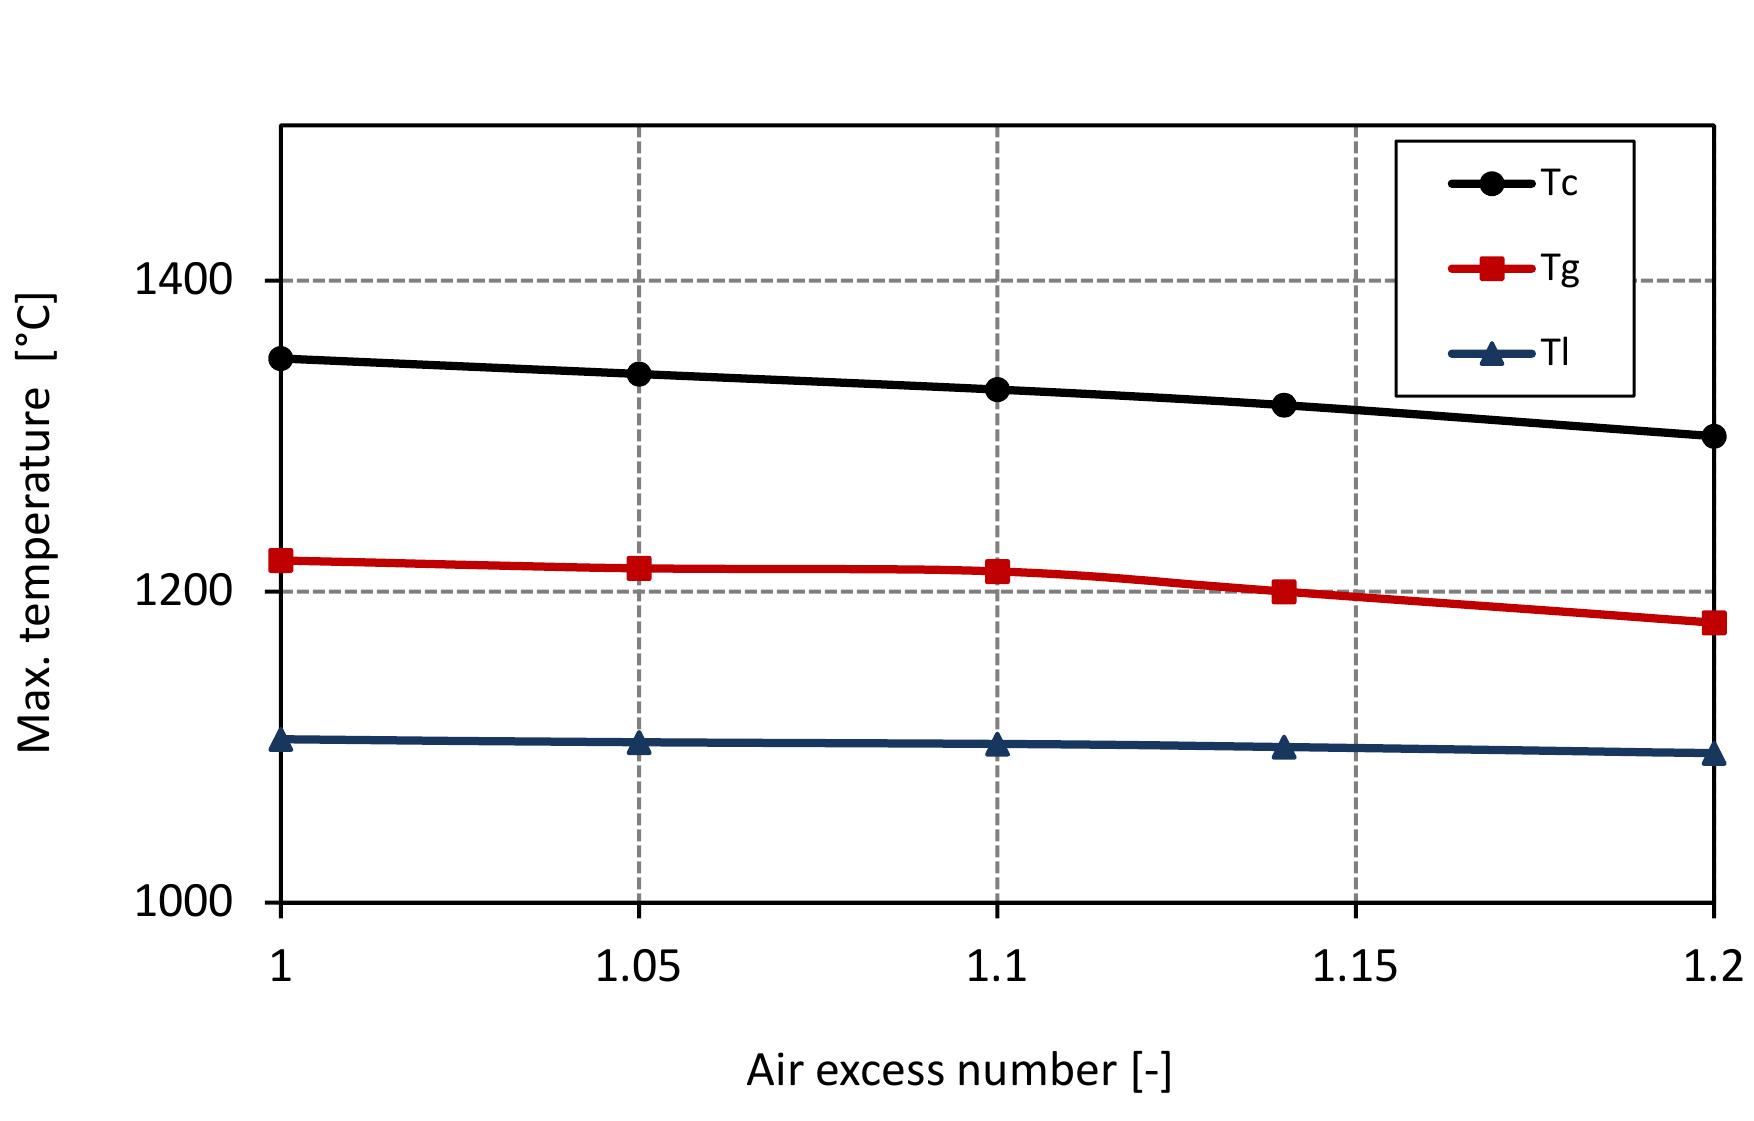
Figure 7.7: Max. temperatures in mixed feed lime kiln at various air excess ratios and data from table 6.4.
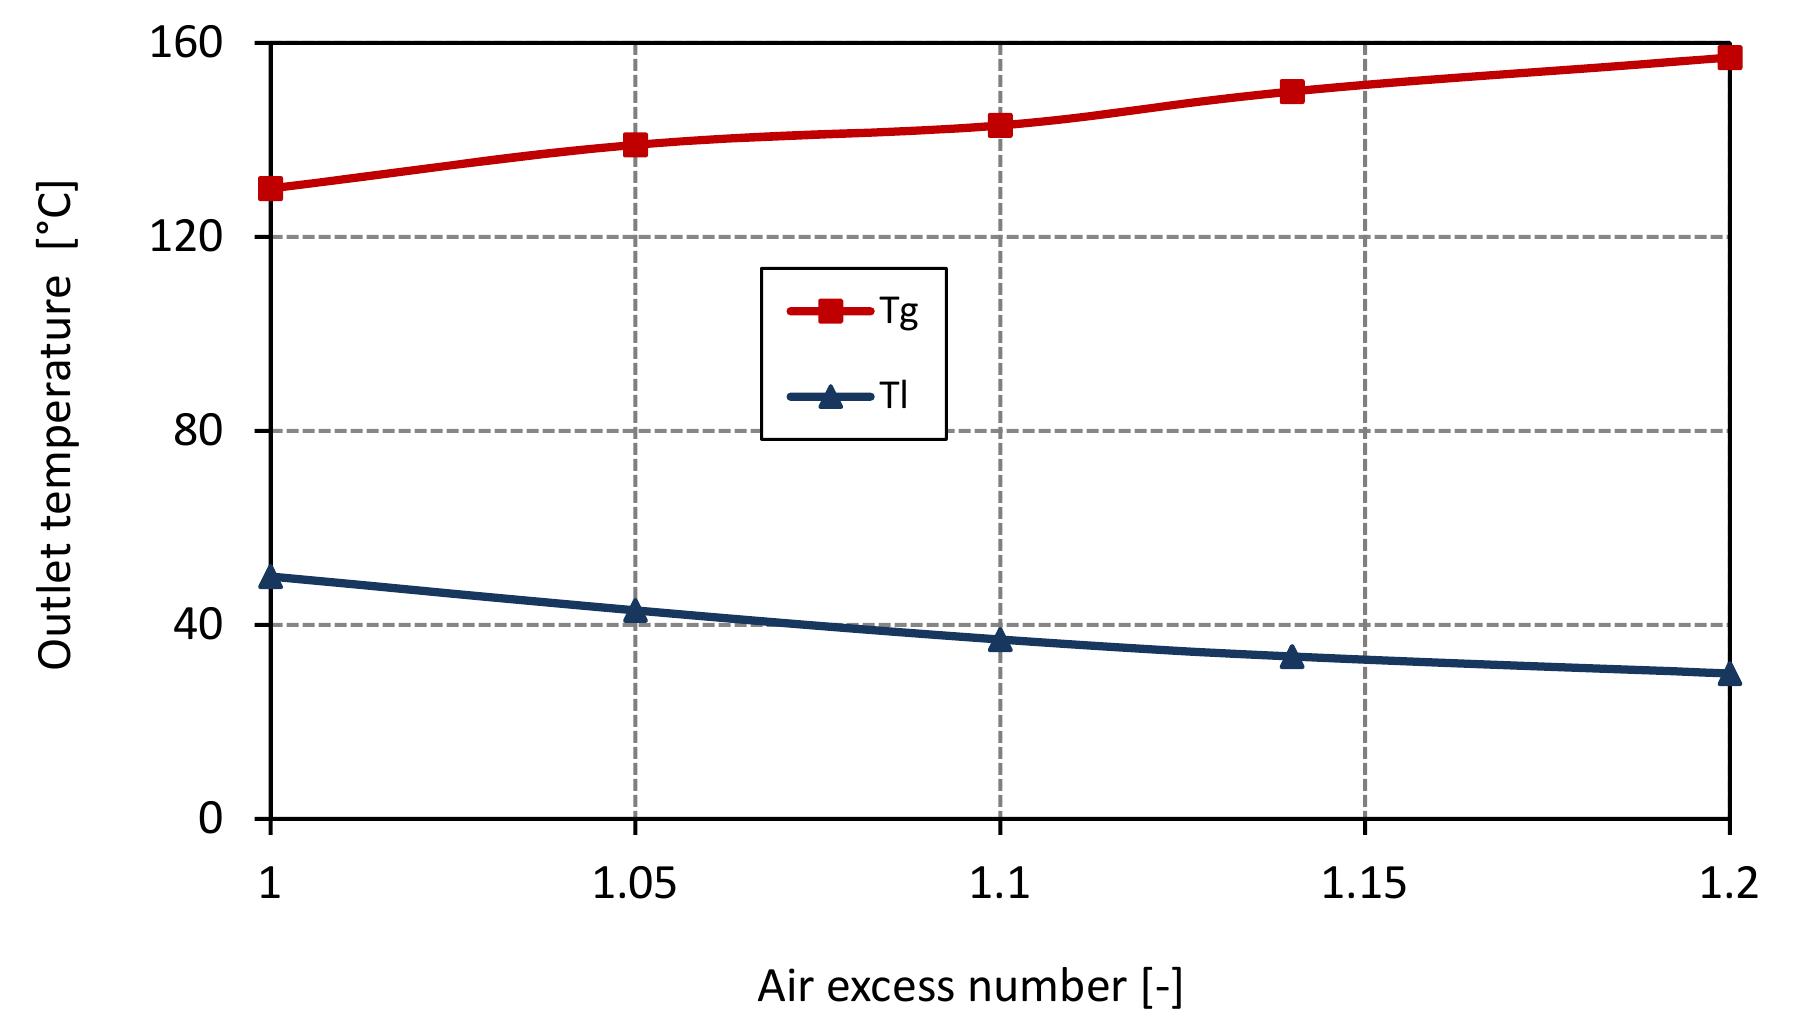
Figure 7.8: Outlet temperatures in mixed feed lime kiln at various air excess ratio and data from table 6.4.
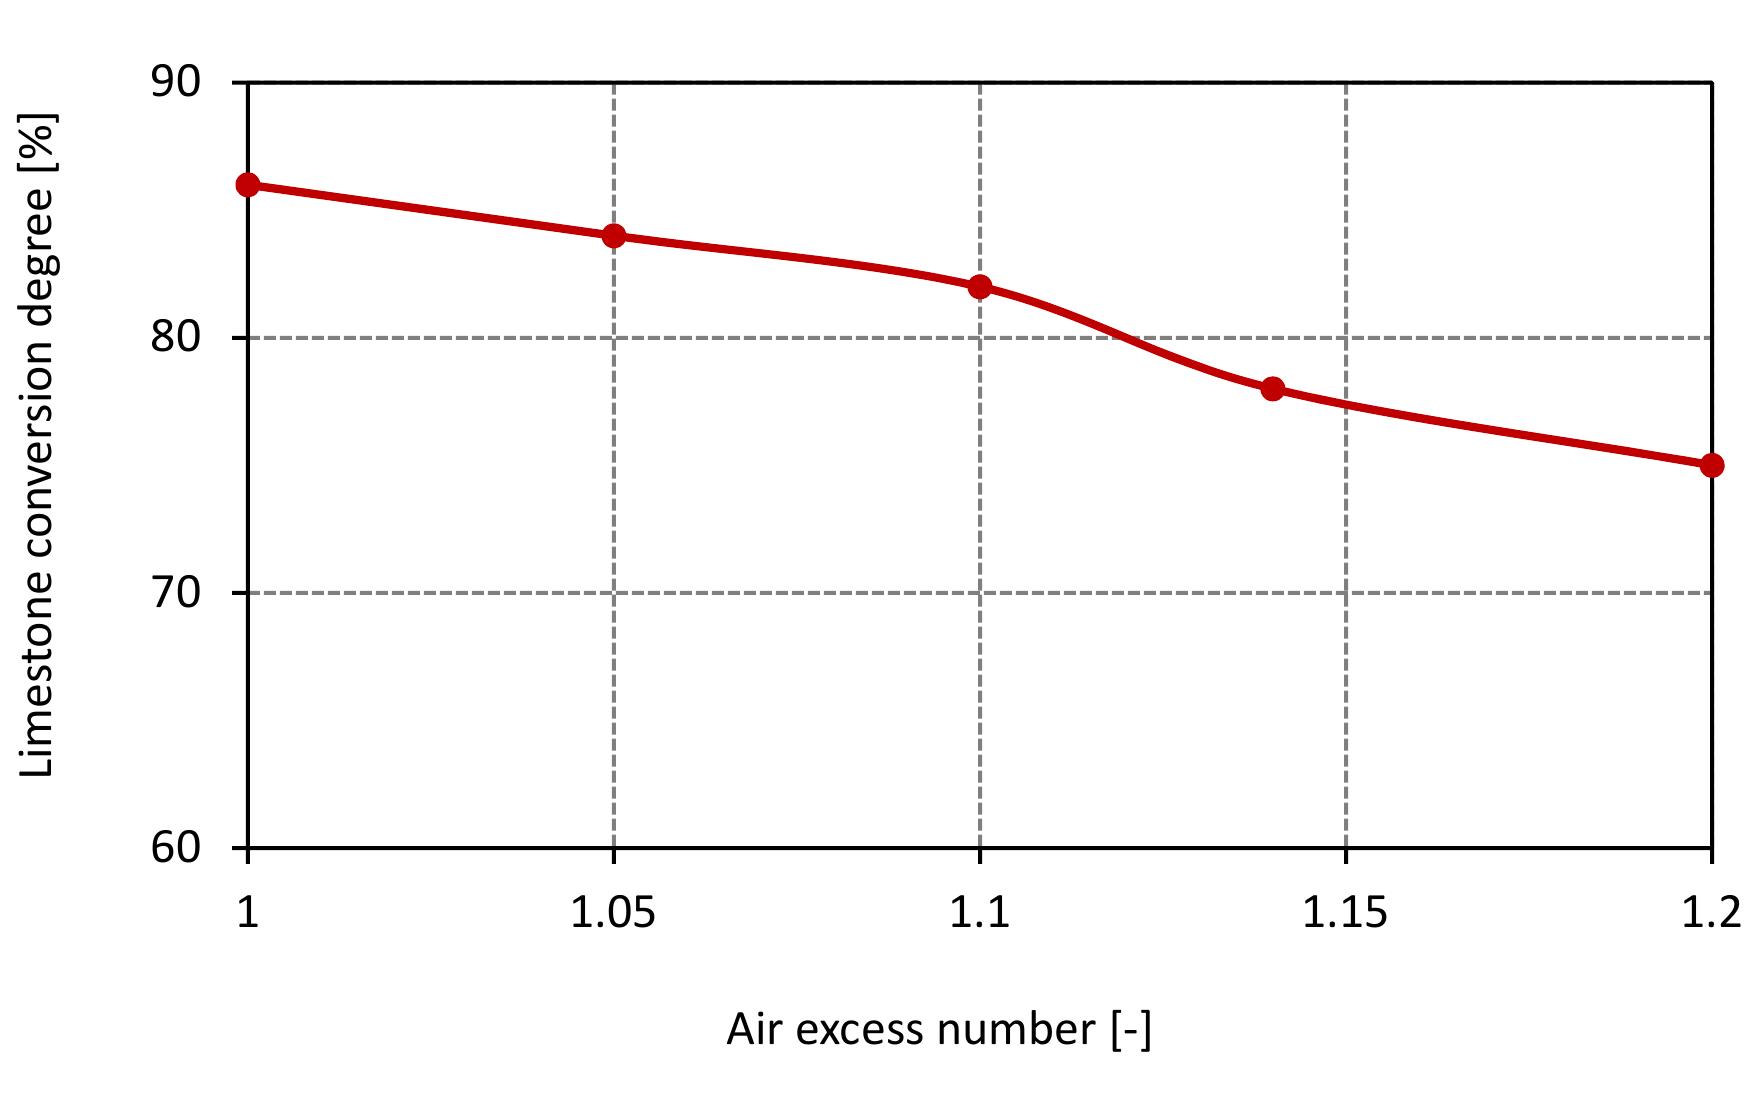
Figure 7.9: Conversion degree of limestone for various air excess ratio and data from table 6.4.
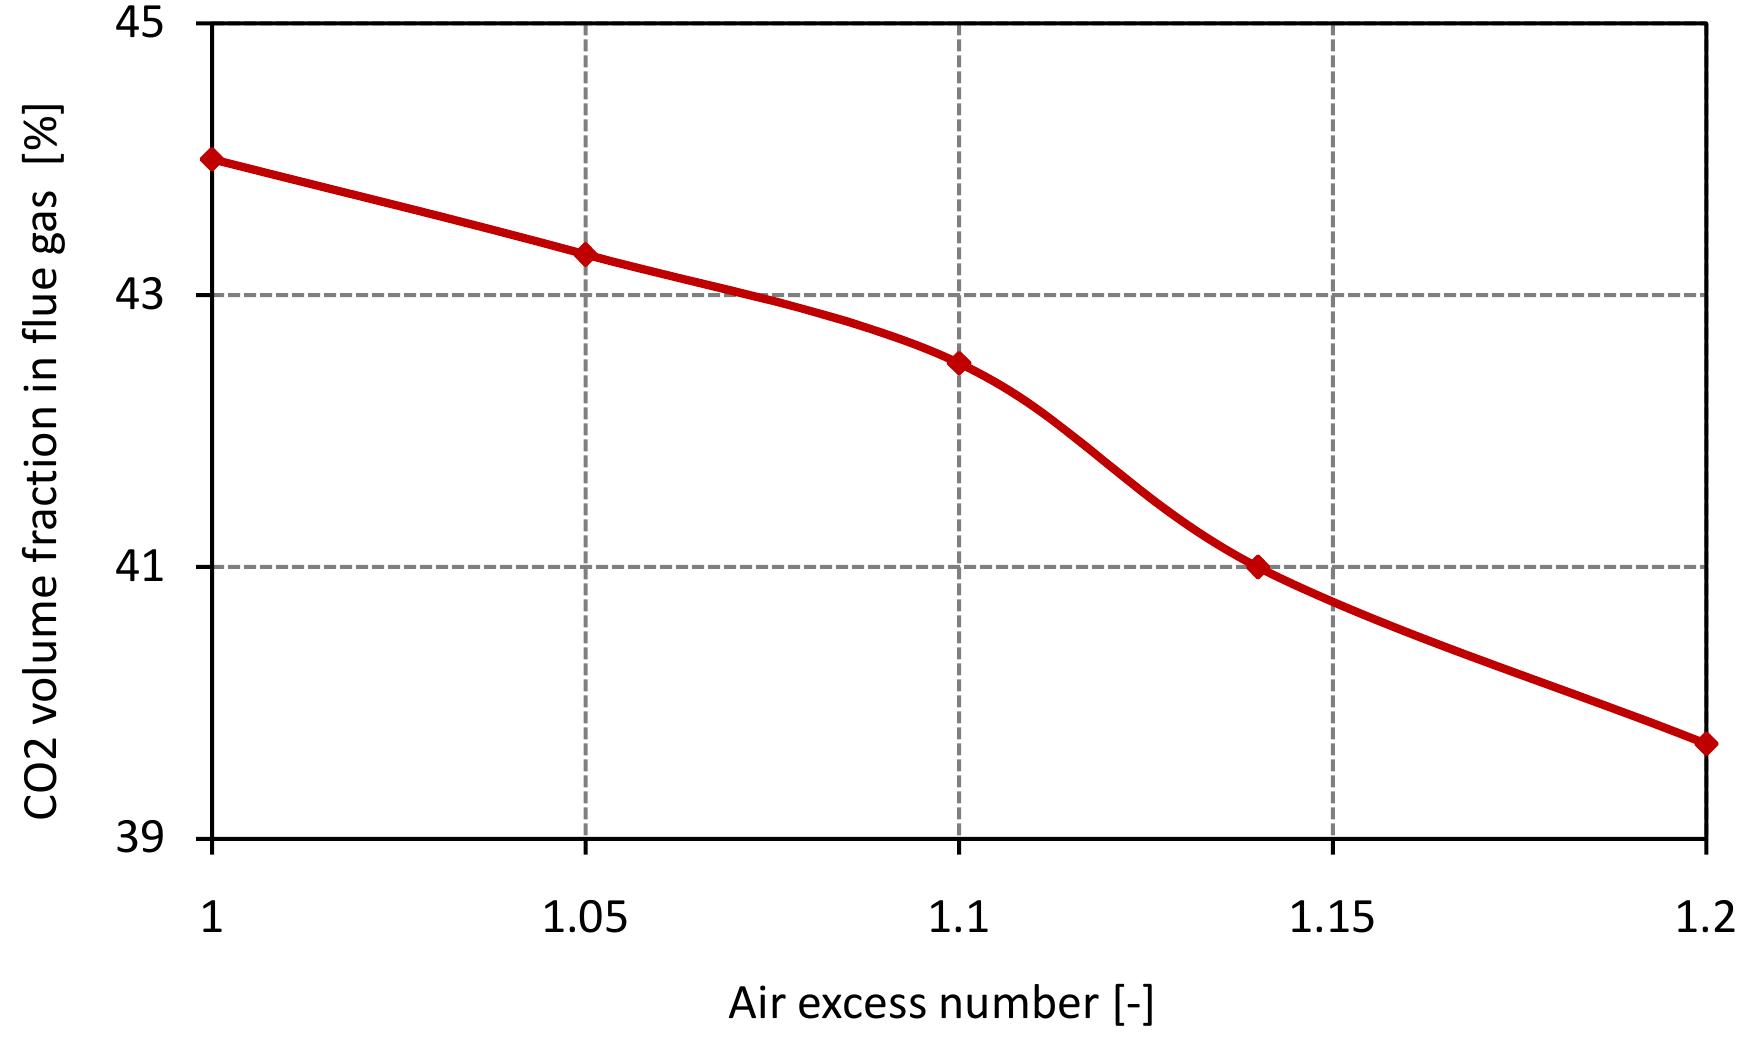
Figure 7.10: Volume fraction of CO2 in flue gas for various air excess ratio and data from table 6.4.
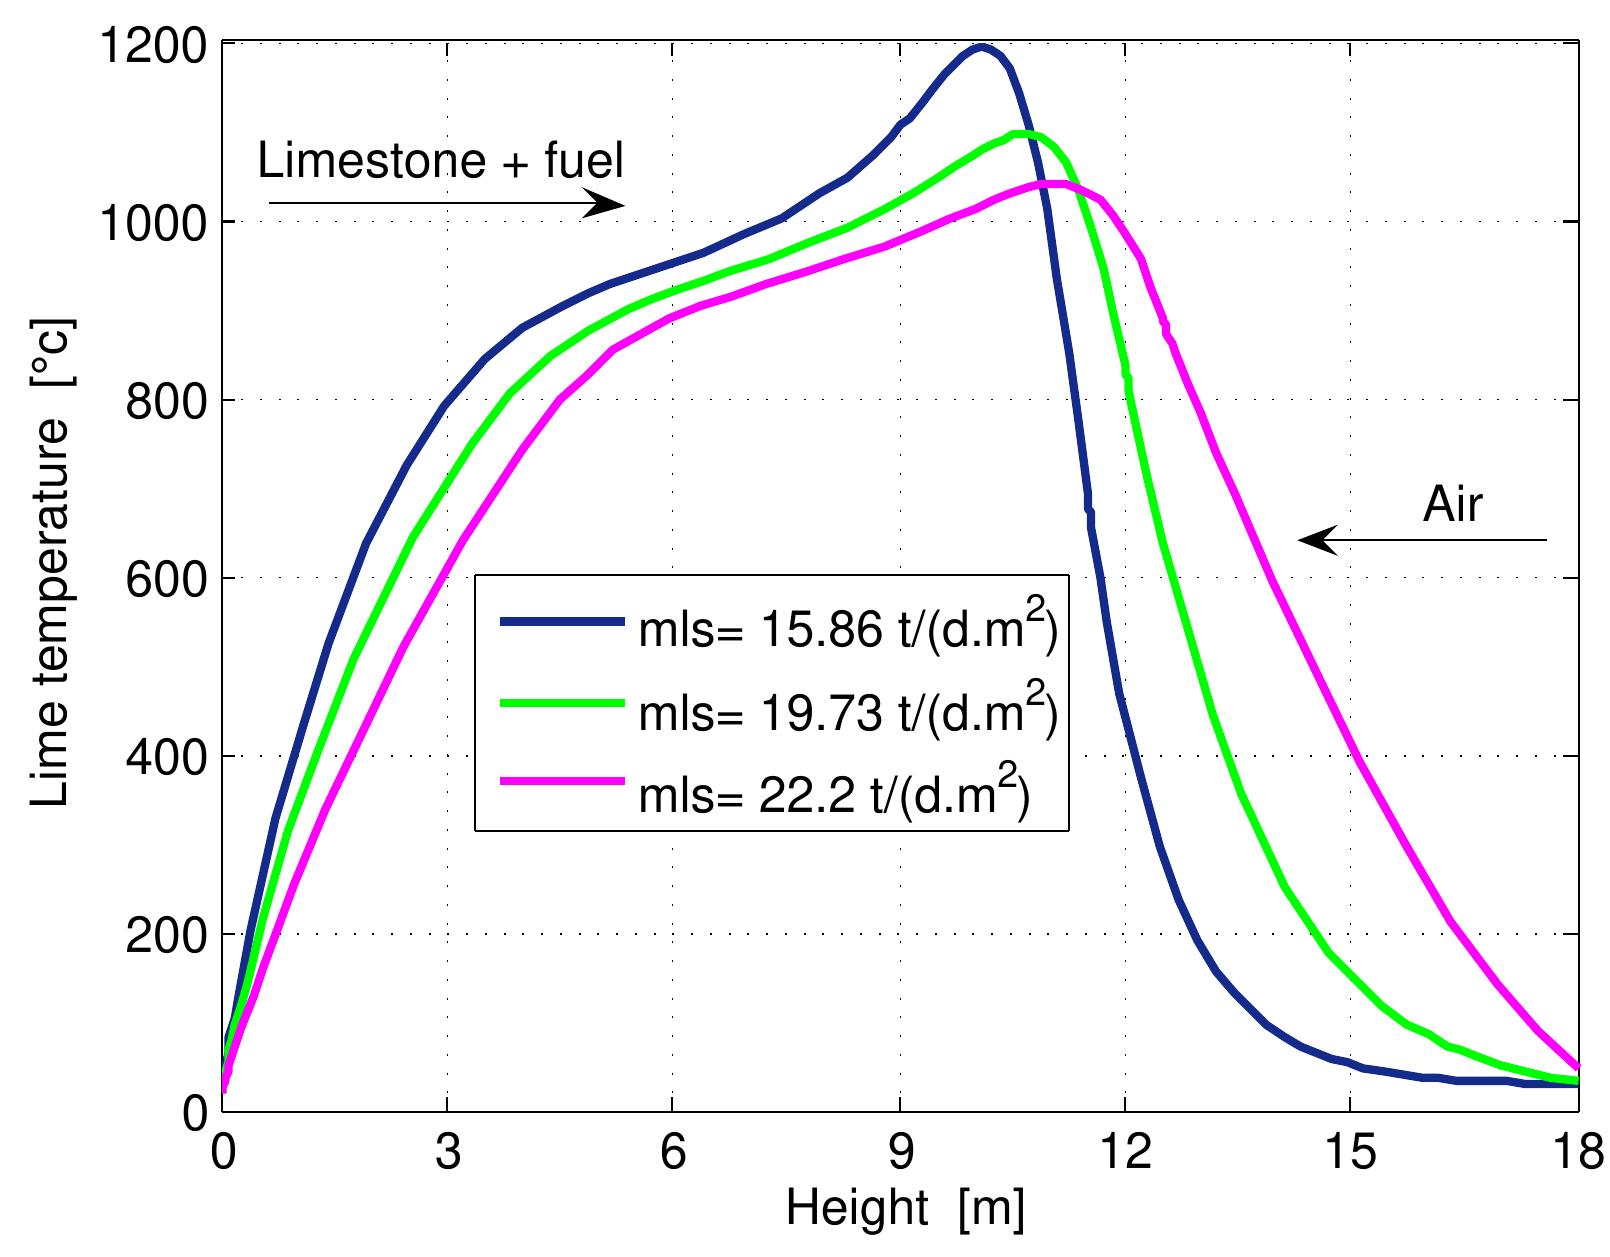
Figure 7.11: Temperature profiles in mixed feed lime kiln at various lime throughput and data from table 6.4. Une as t imestone rate because the increase of lime throughput requires be generated to decompose the limestone. The rate of fuel and air su eed lime kiln. Another way is an increase of limestone rate. The influence of lim throughput on the mixed feed lime kiln operation is investigated here by changin the limestone rate while keeping the other input data the same in ta Figure 7.11 shows the temperature profiles of lime at three different values of lim throughput. The plot shows that the lime temperature decreases wit ble 6.4. h an increase c more energy t pply is constan he input is kept constant. The increase of limestone rate affects the length c zones along the whole kiln. With the increase of lime throughput, the discharge lim tem with lime discharge. perature increases because an amount of heat, which isn’t transferred to air ou
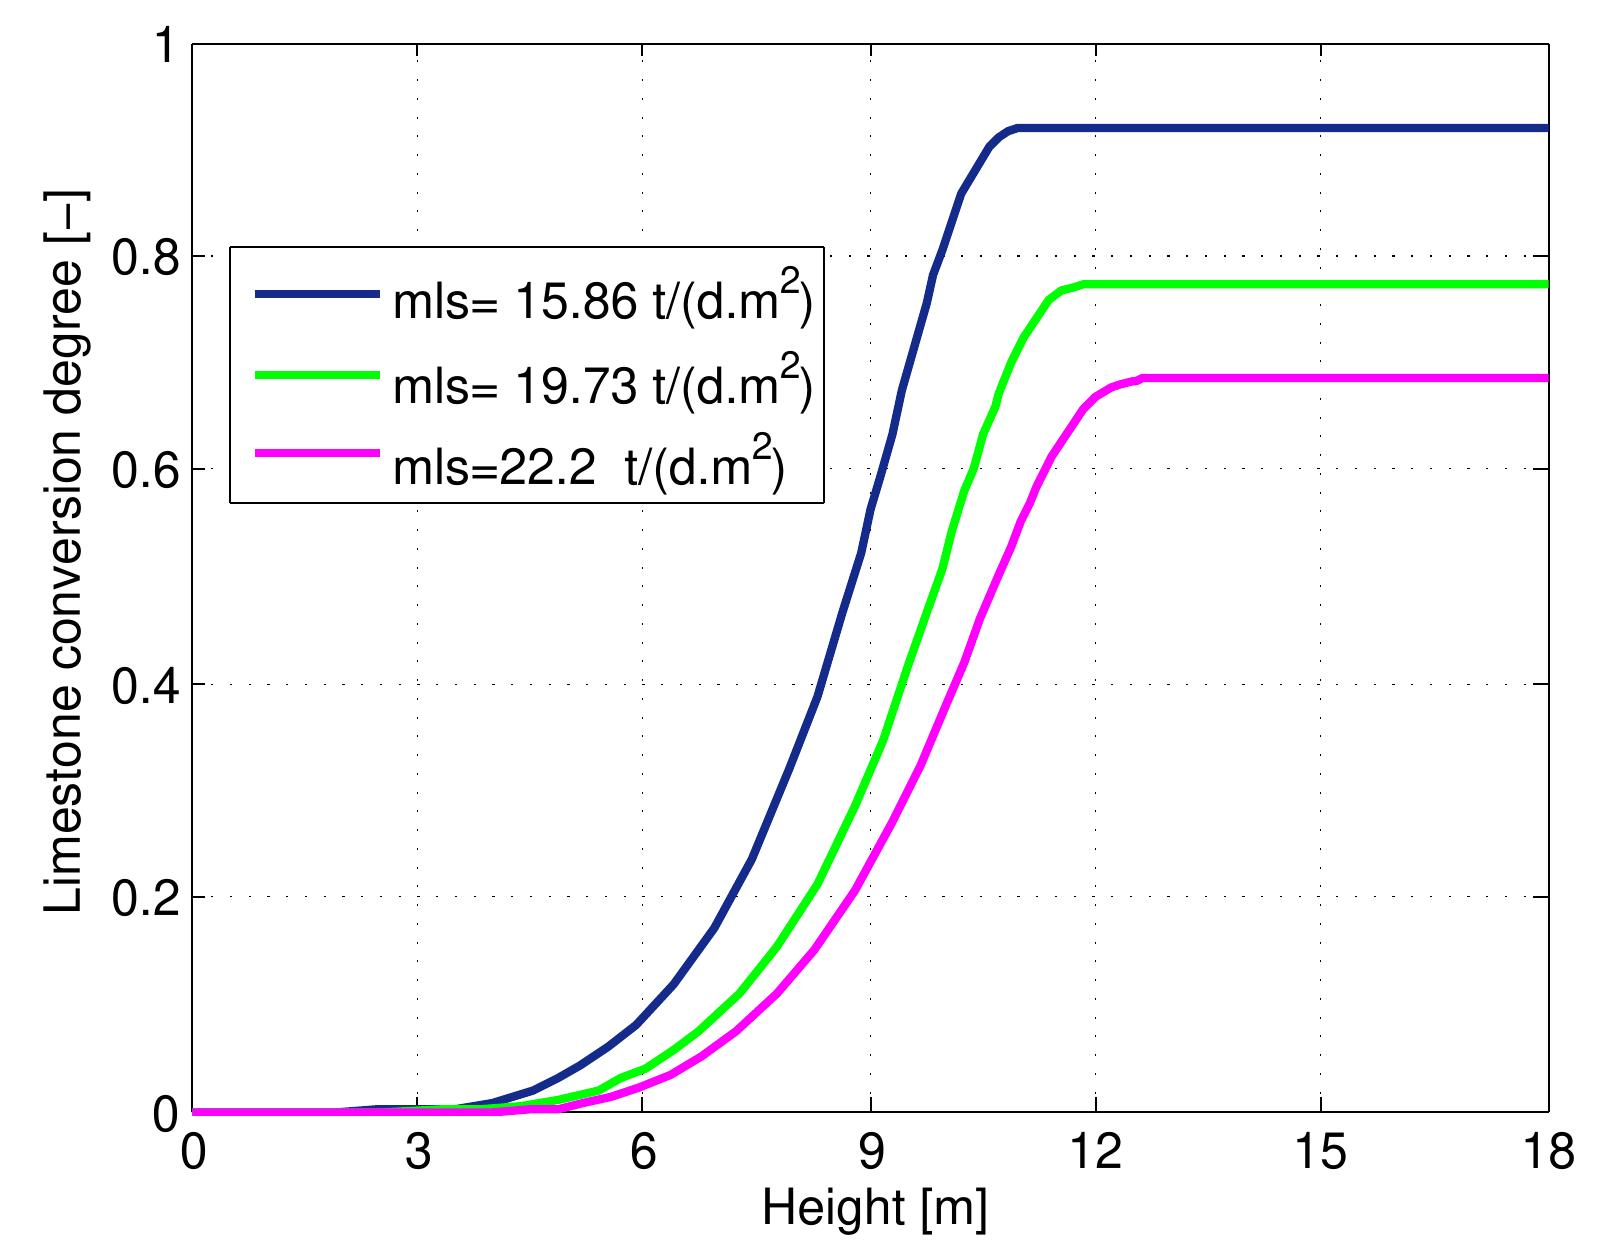
Figure 7.12: Conversion degree of limestone for various lime throughput and data from table 6.4.
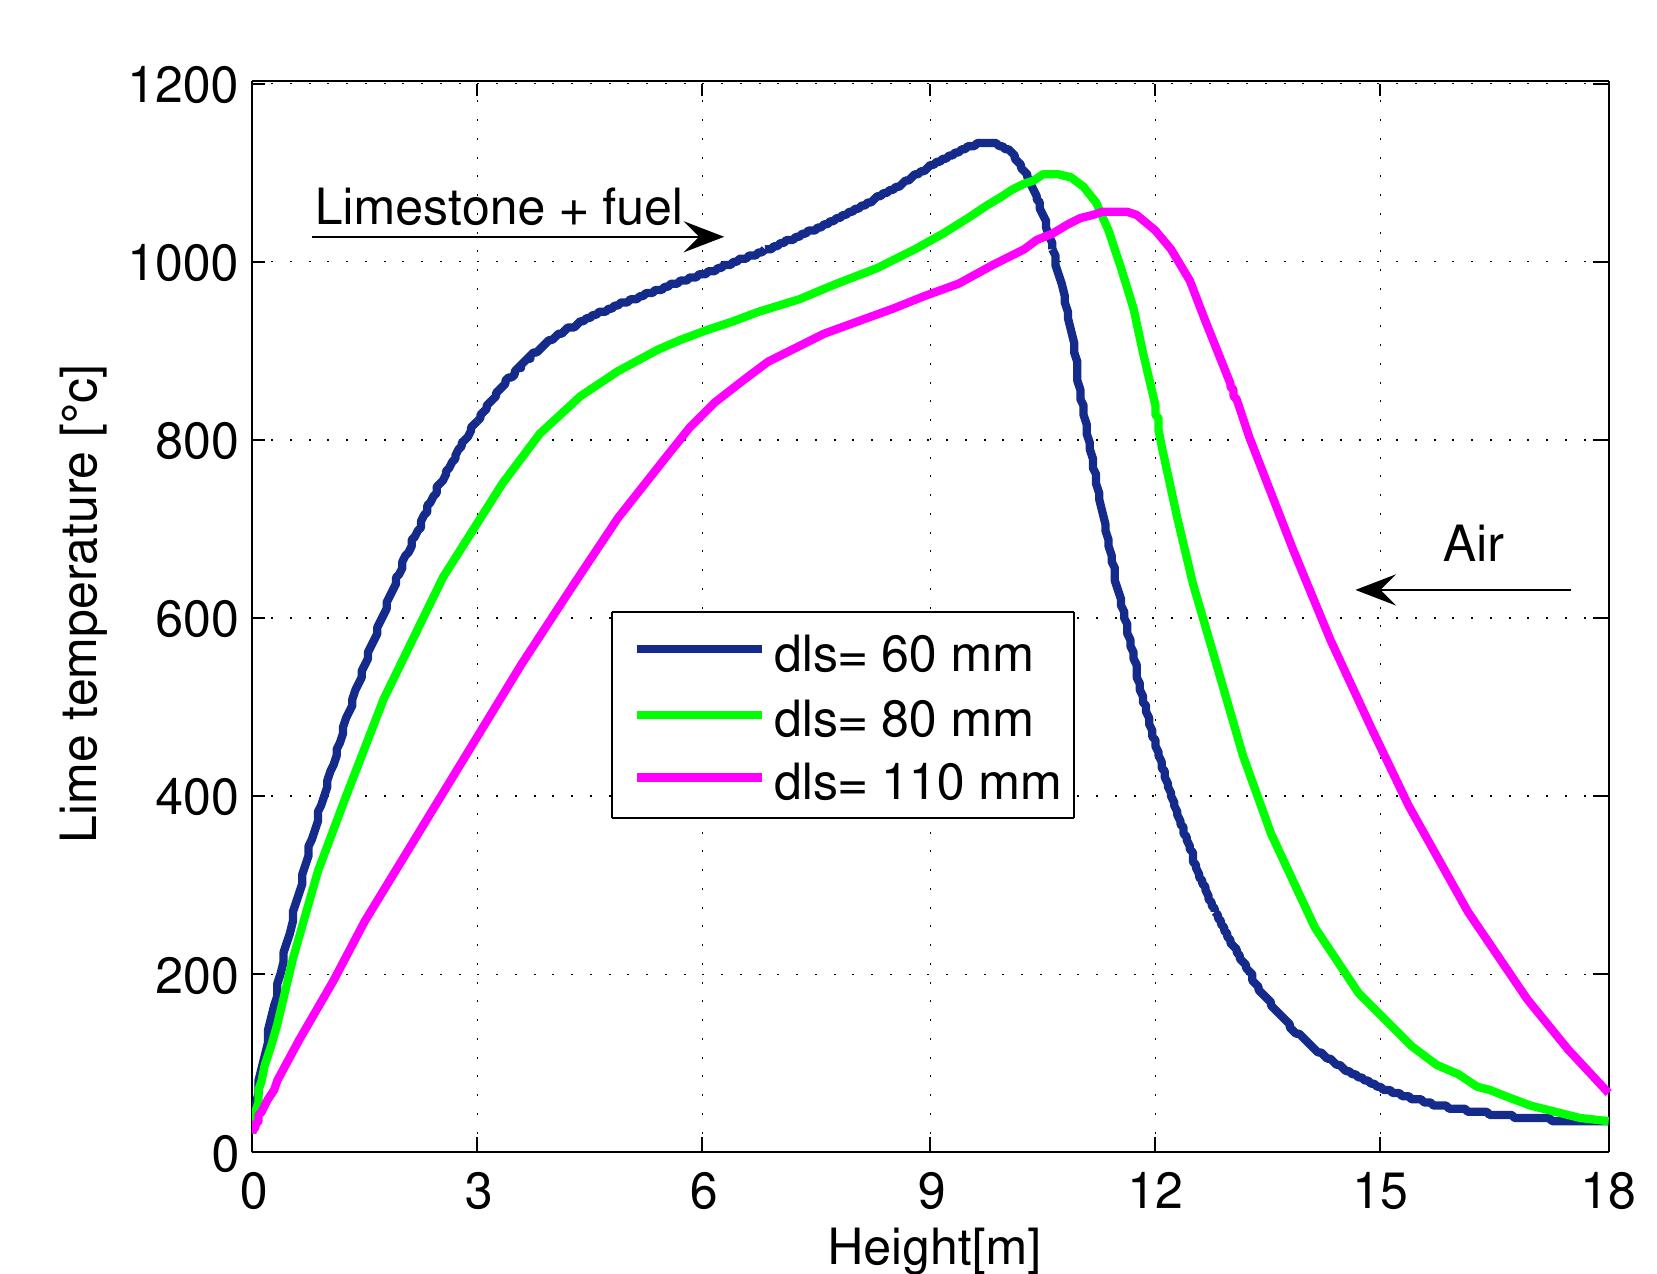
Figure 7.13: Temperature profiles in mixed feed lime kiln at different limestone di- ameter and data from table 6.4.
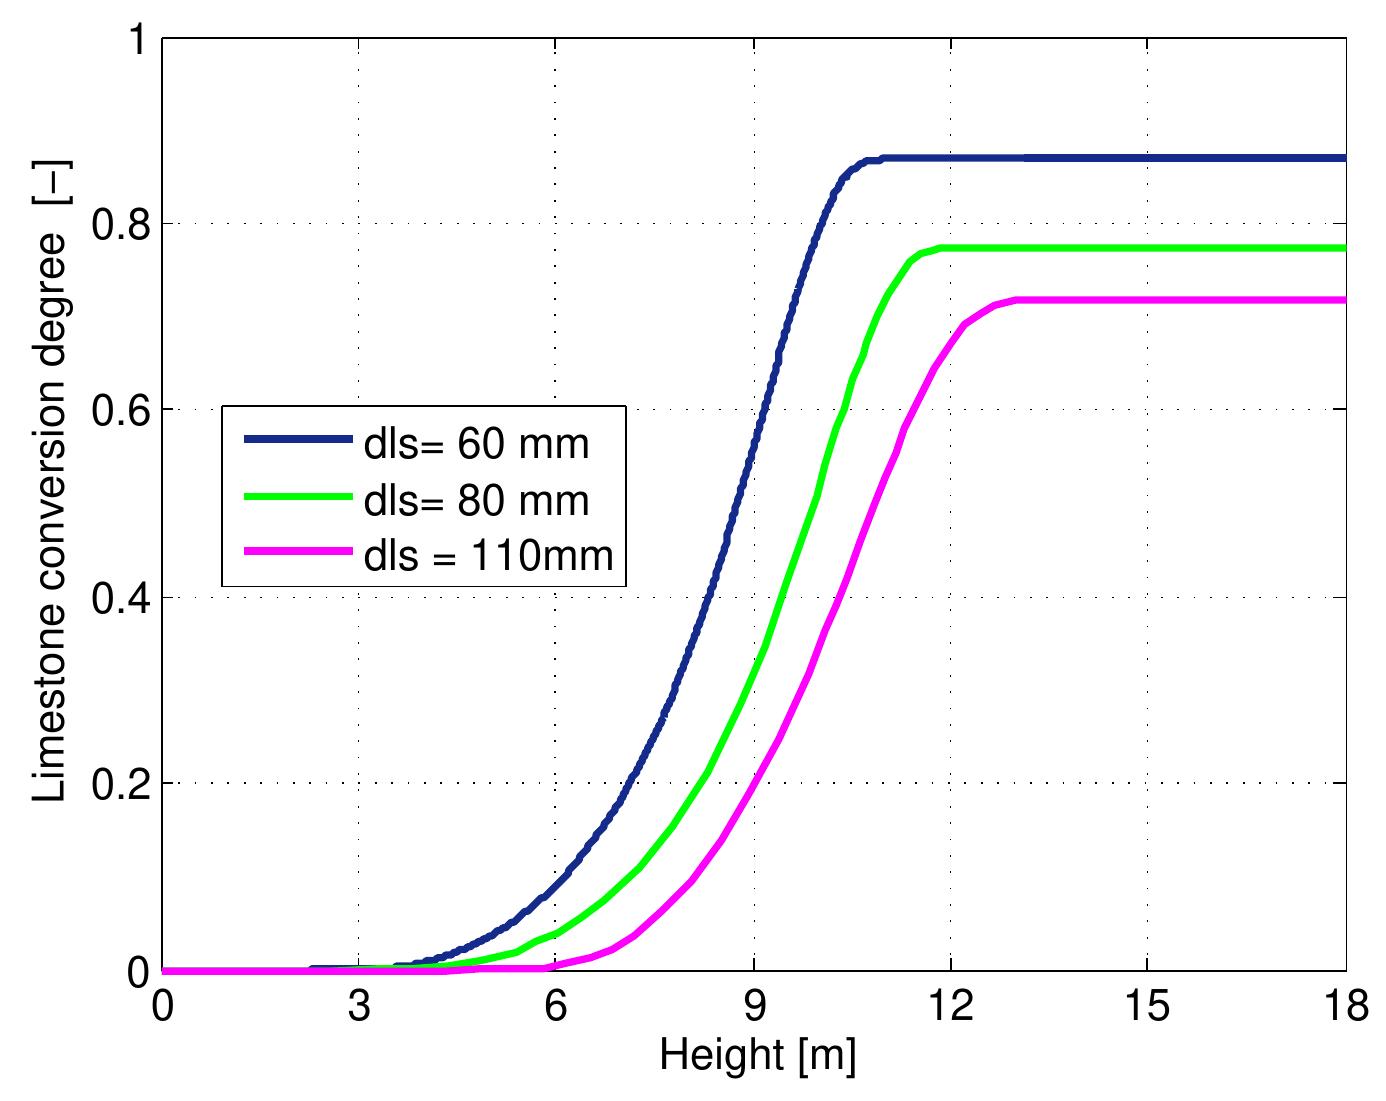
Figure 7.14: Conversion degree of limestone for various limestone diameters and data from table 6.4.
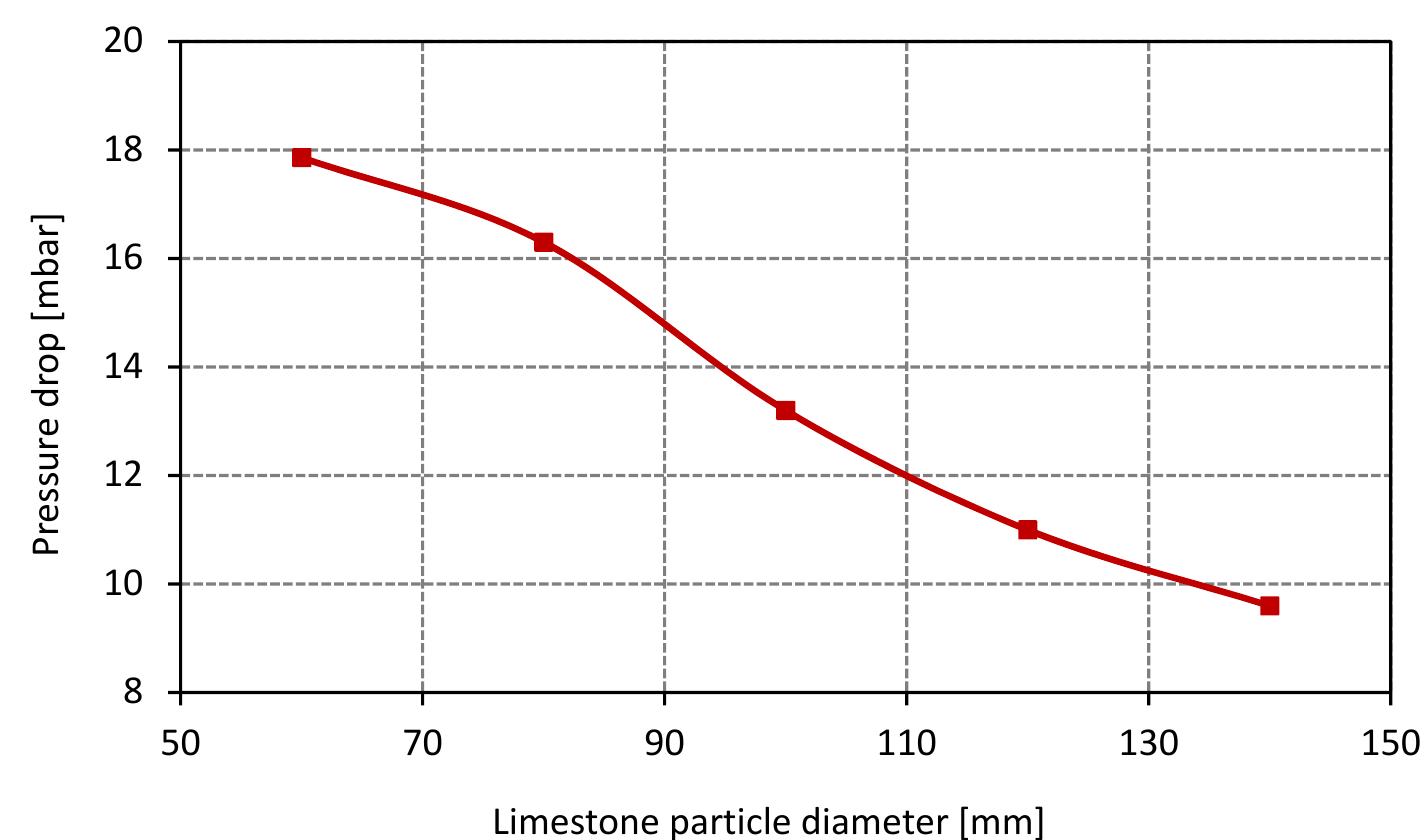
Figure 7.15: Pressure drop at different values of limestone diameter and data from table 6.4.
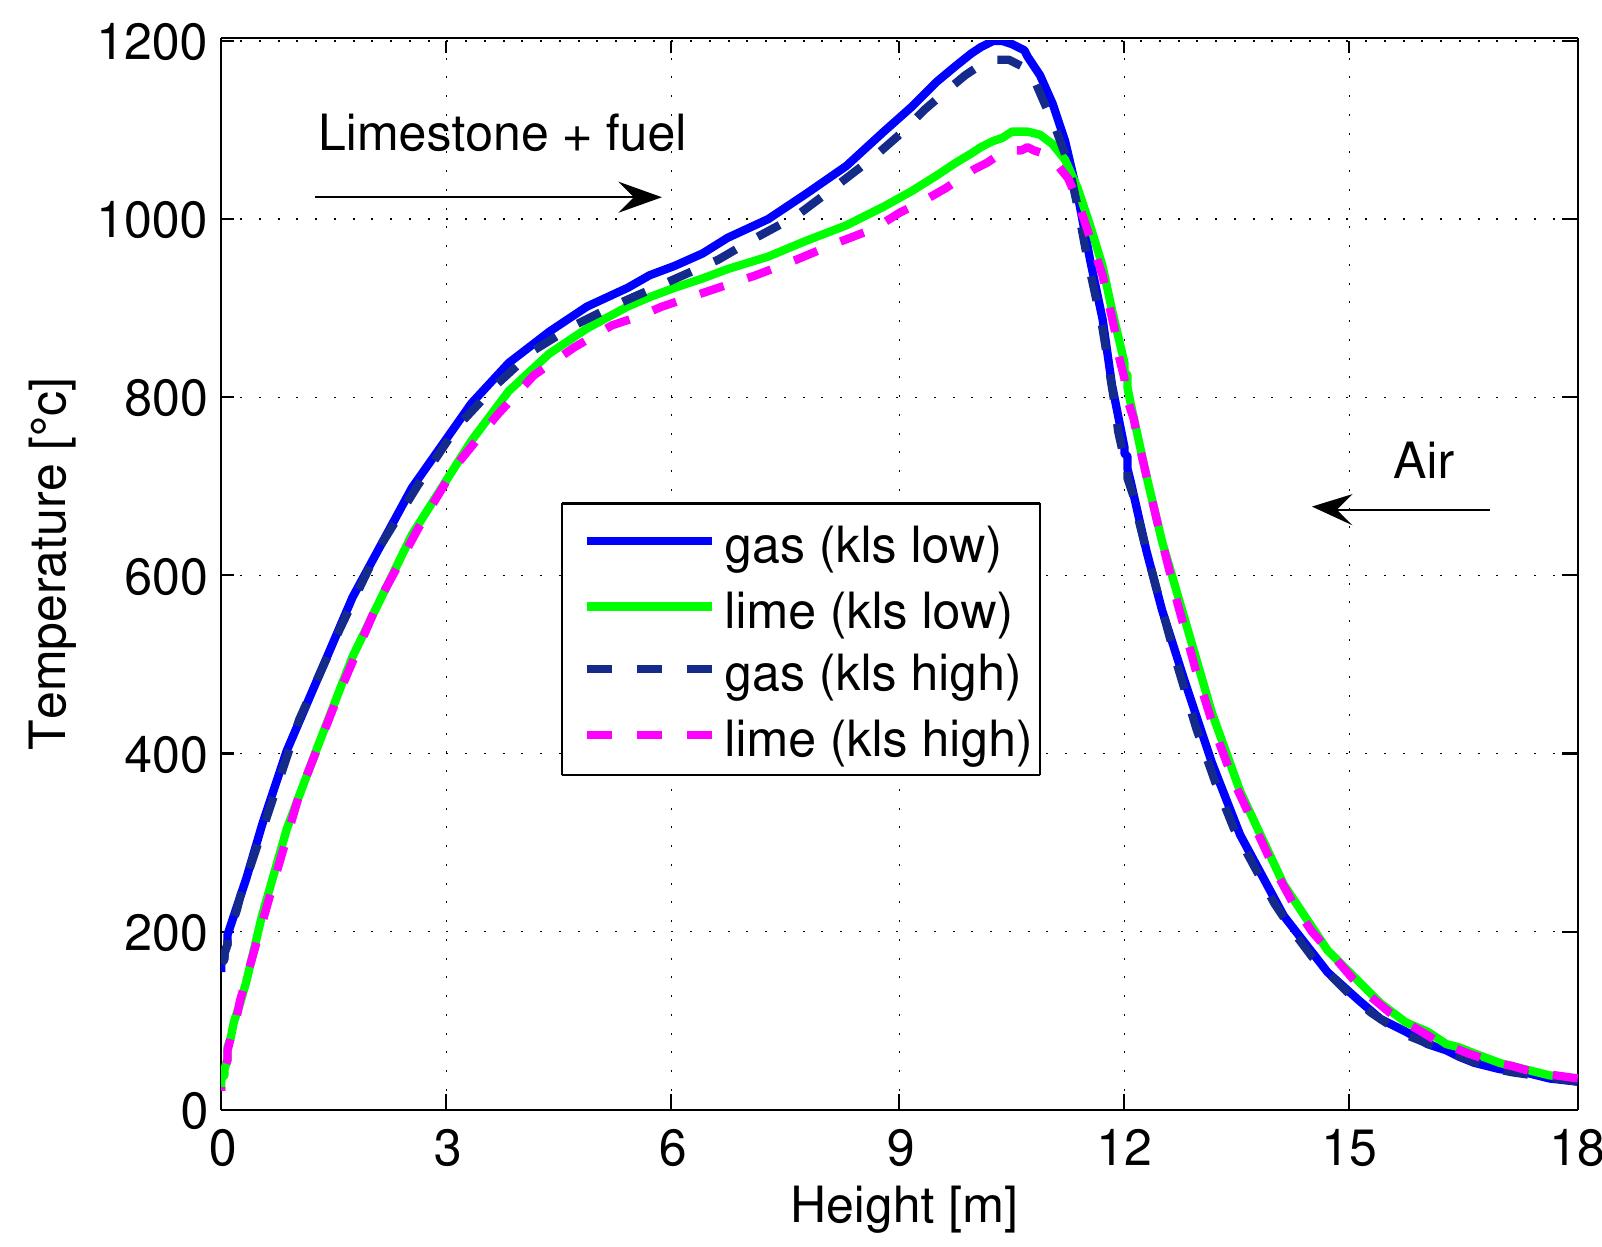
Figure 7.16: Temperature profiles in mixed feed lime kiln at two limestone reactivities and data from table 6.4. temperature of lime decreases where the endothermic calcination reaction is fast.
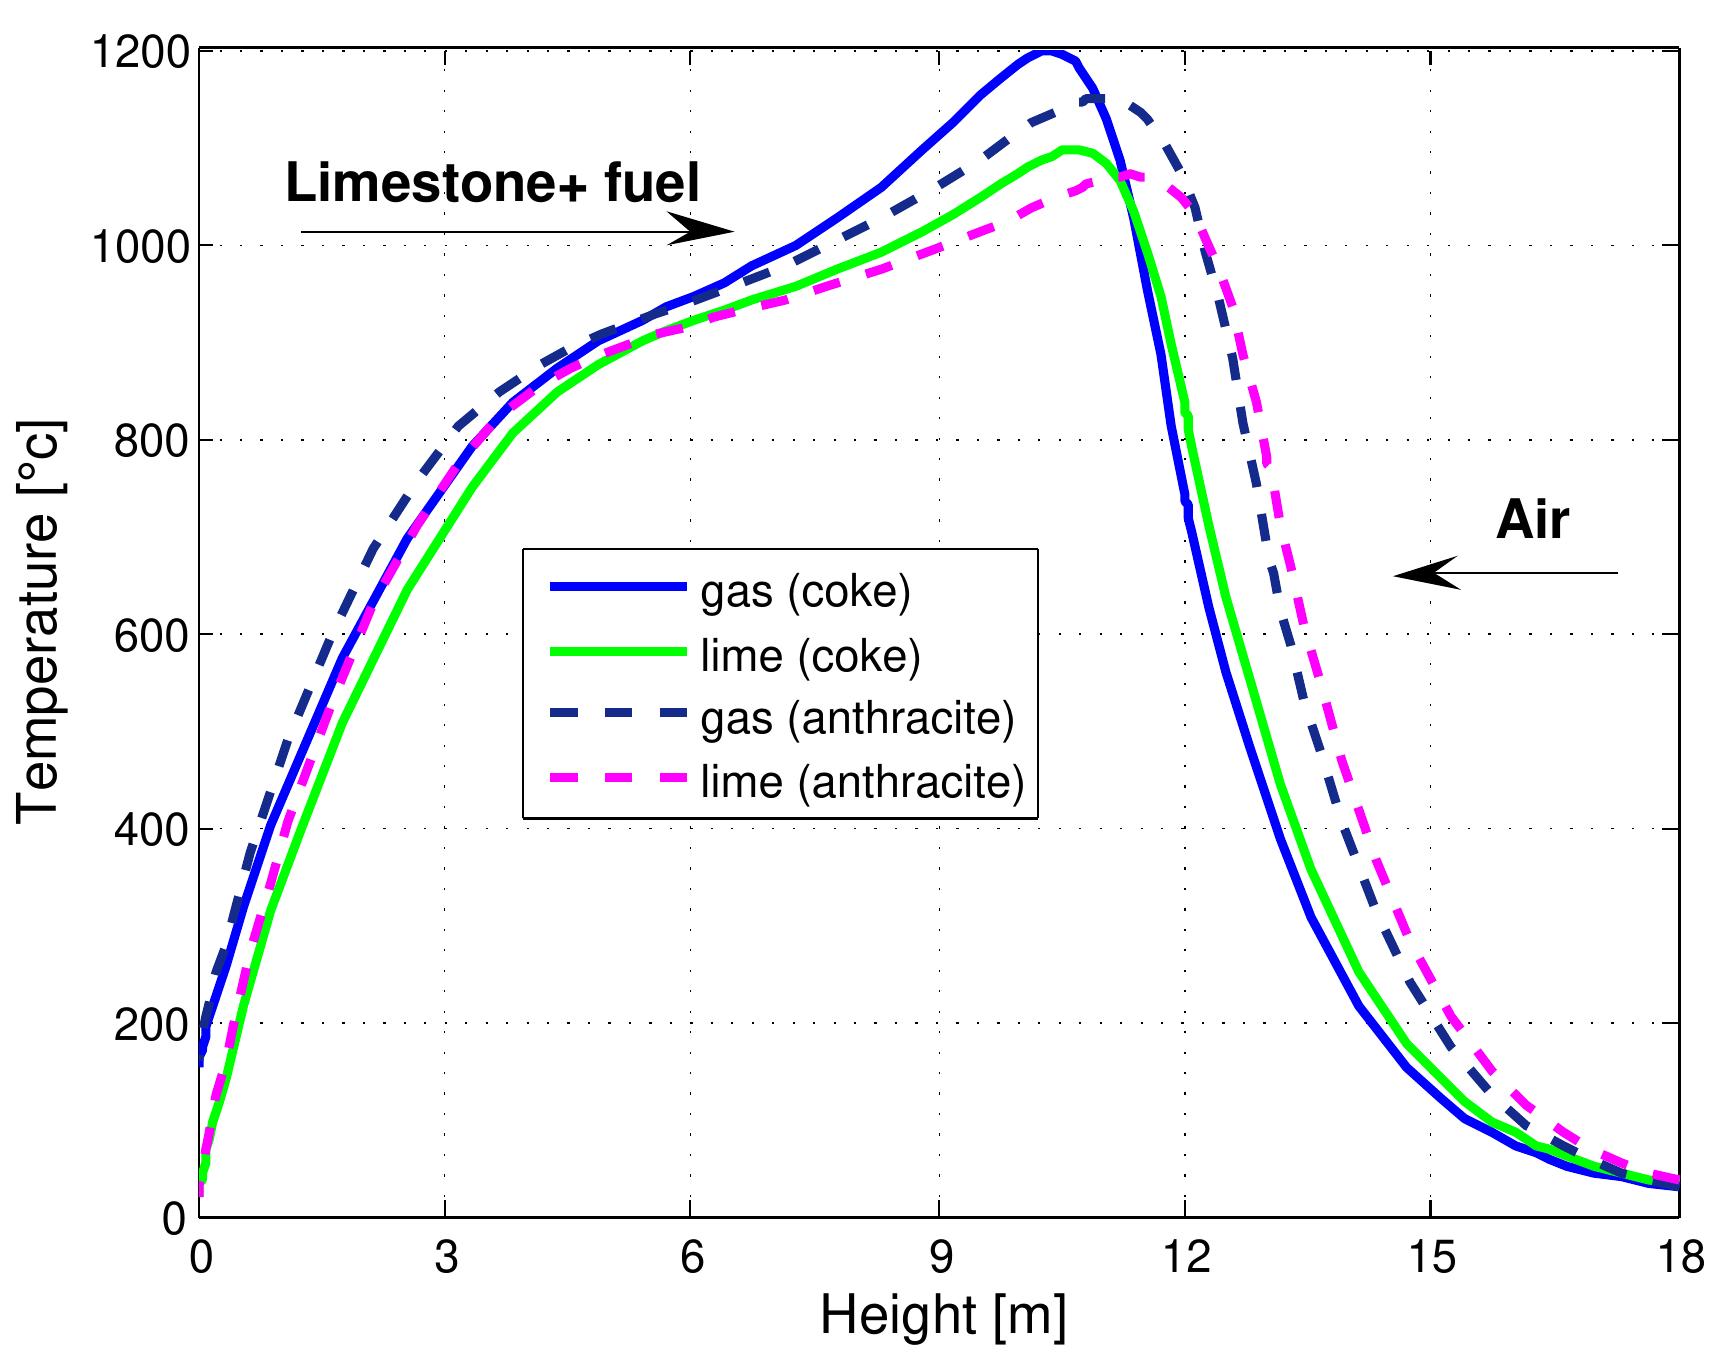
Figure 7.17: Temperature profiles in a mixed feed lime kiln with different kind of fuels and data from table 6.4.
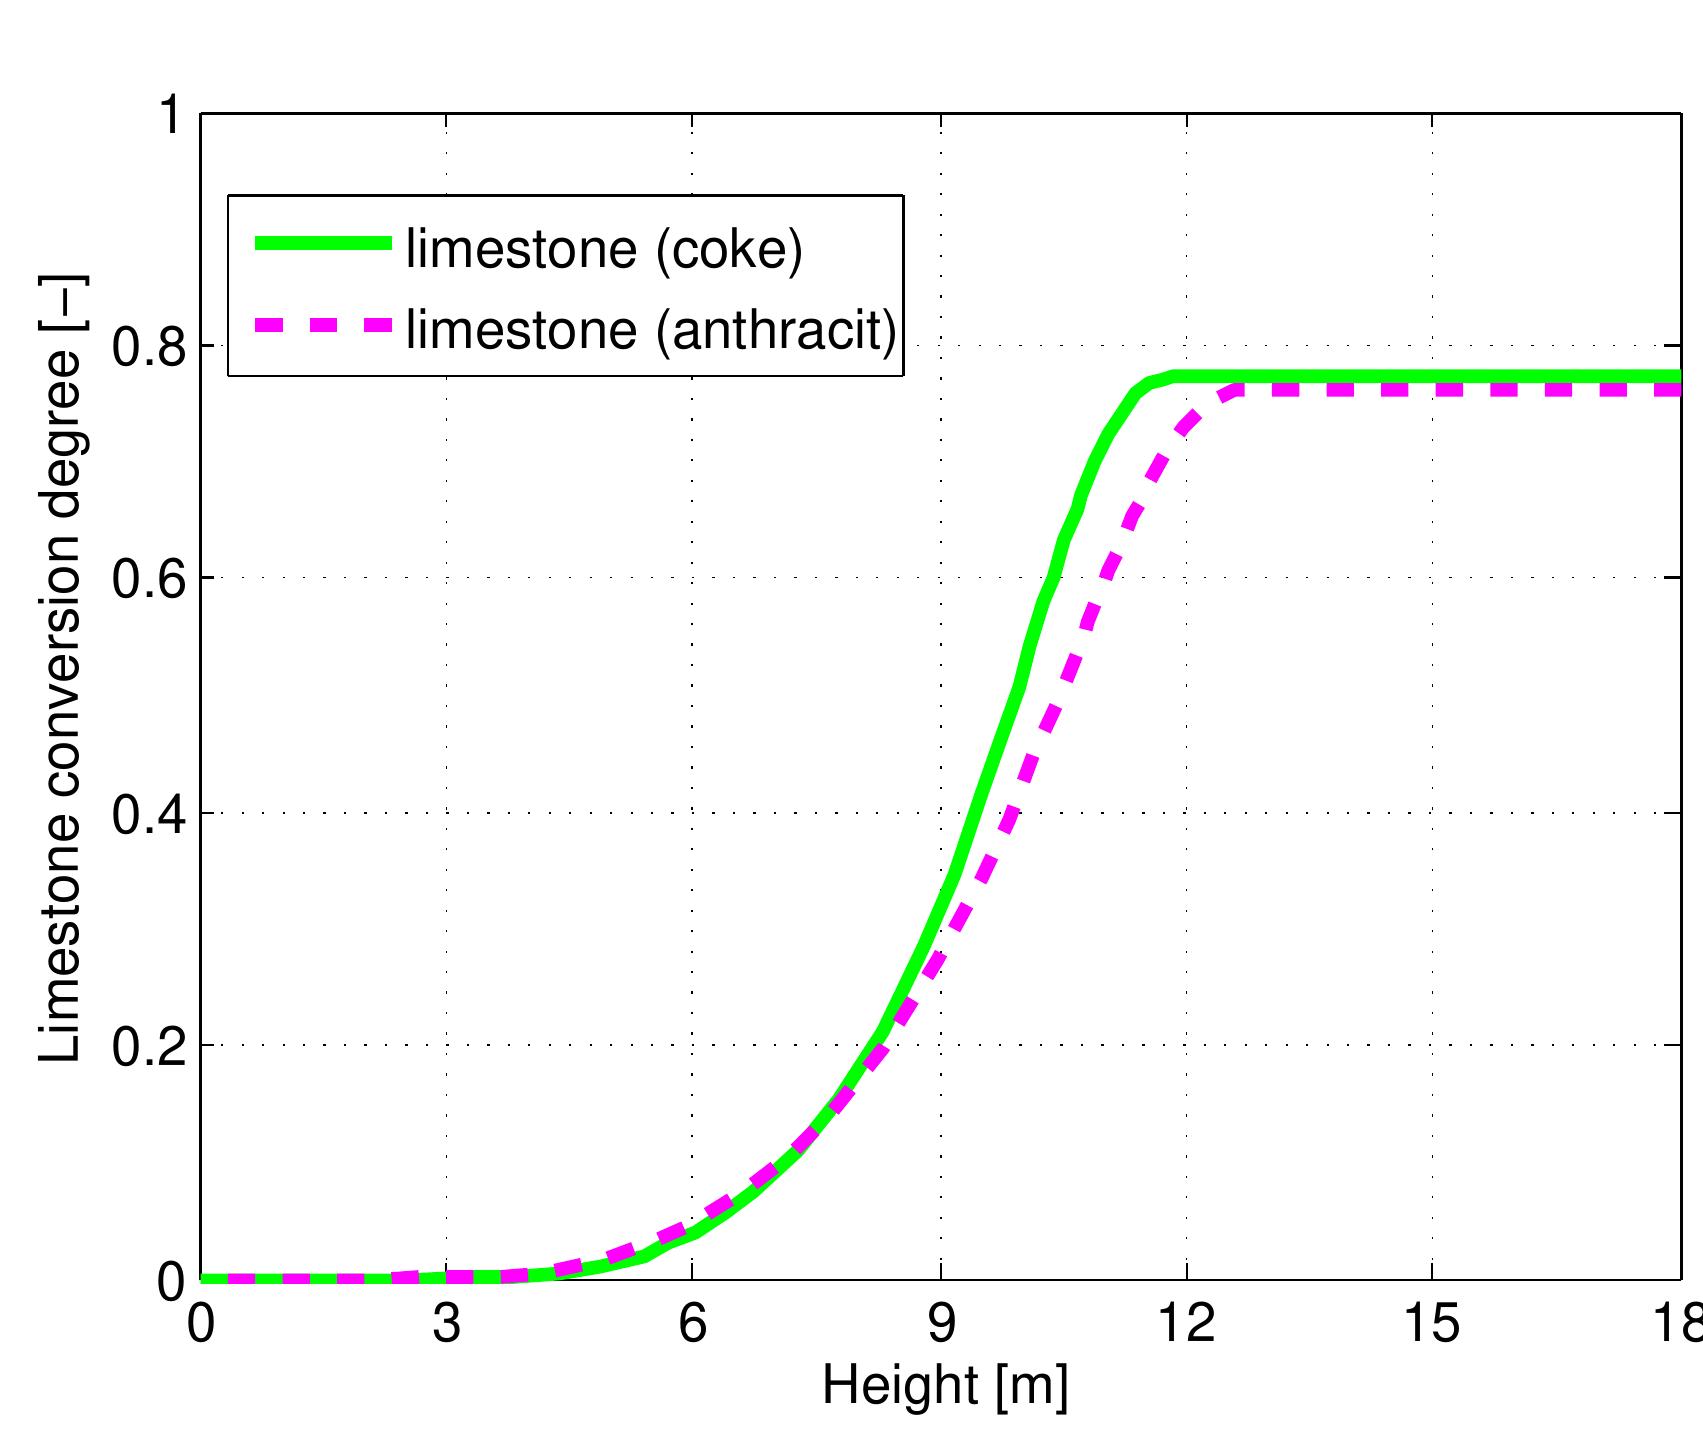
Figure 7.18: Conversion degree of limestone for kinds of fuel and data from table 6.4.
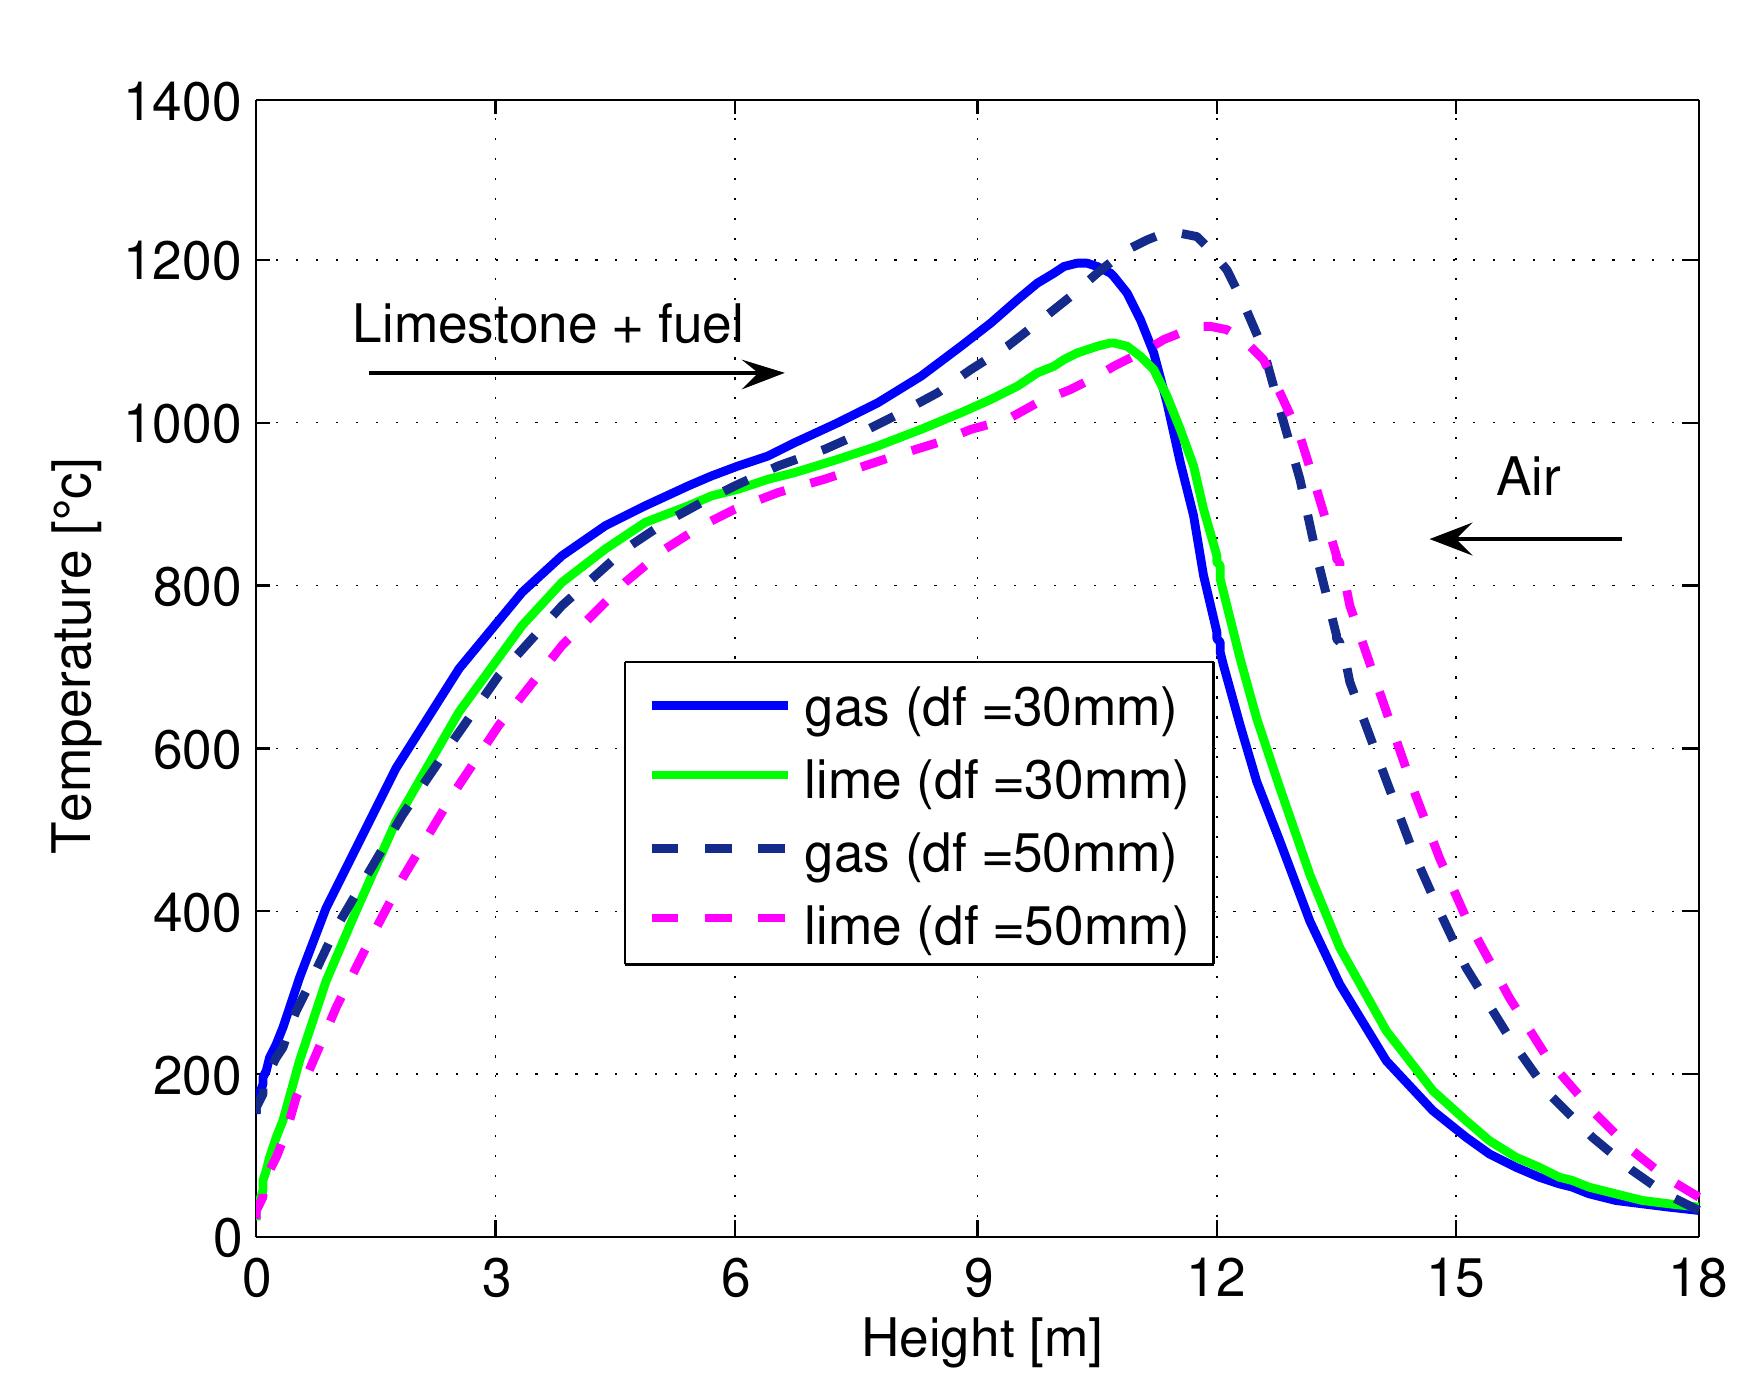
Figure 7.19: Temperature profiles in a mixed feed lime kiln with different coke sizes and data from table 6.4.
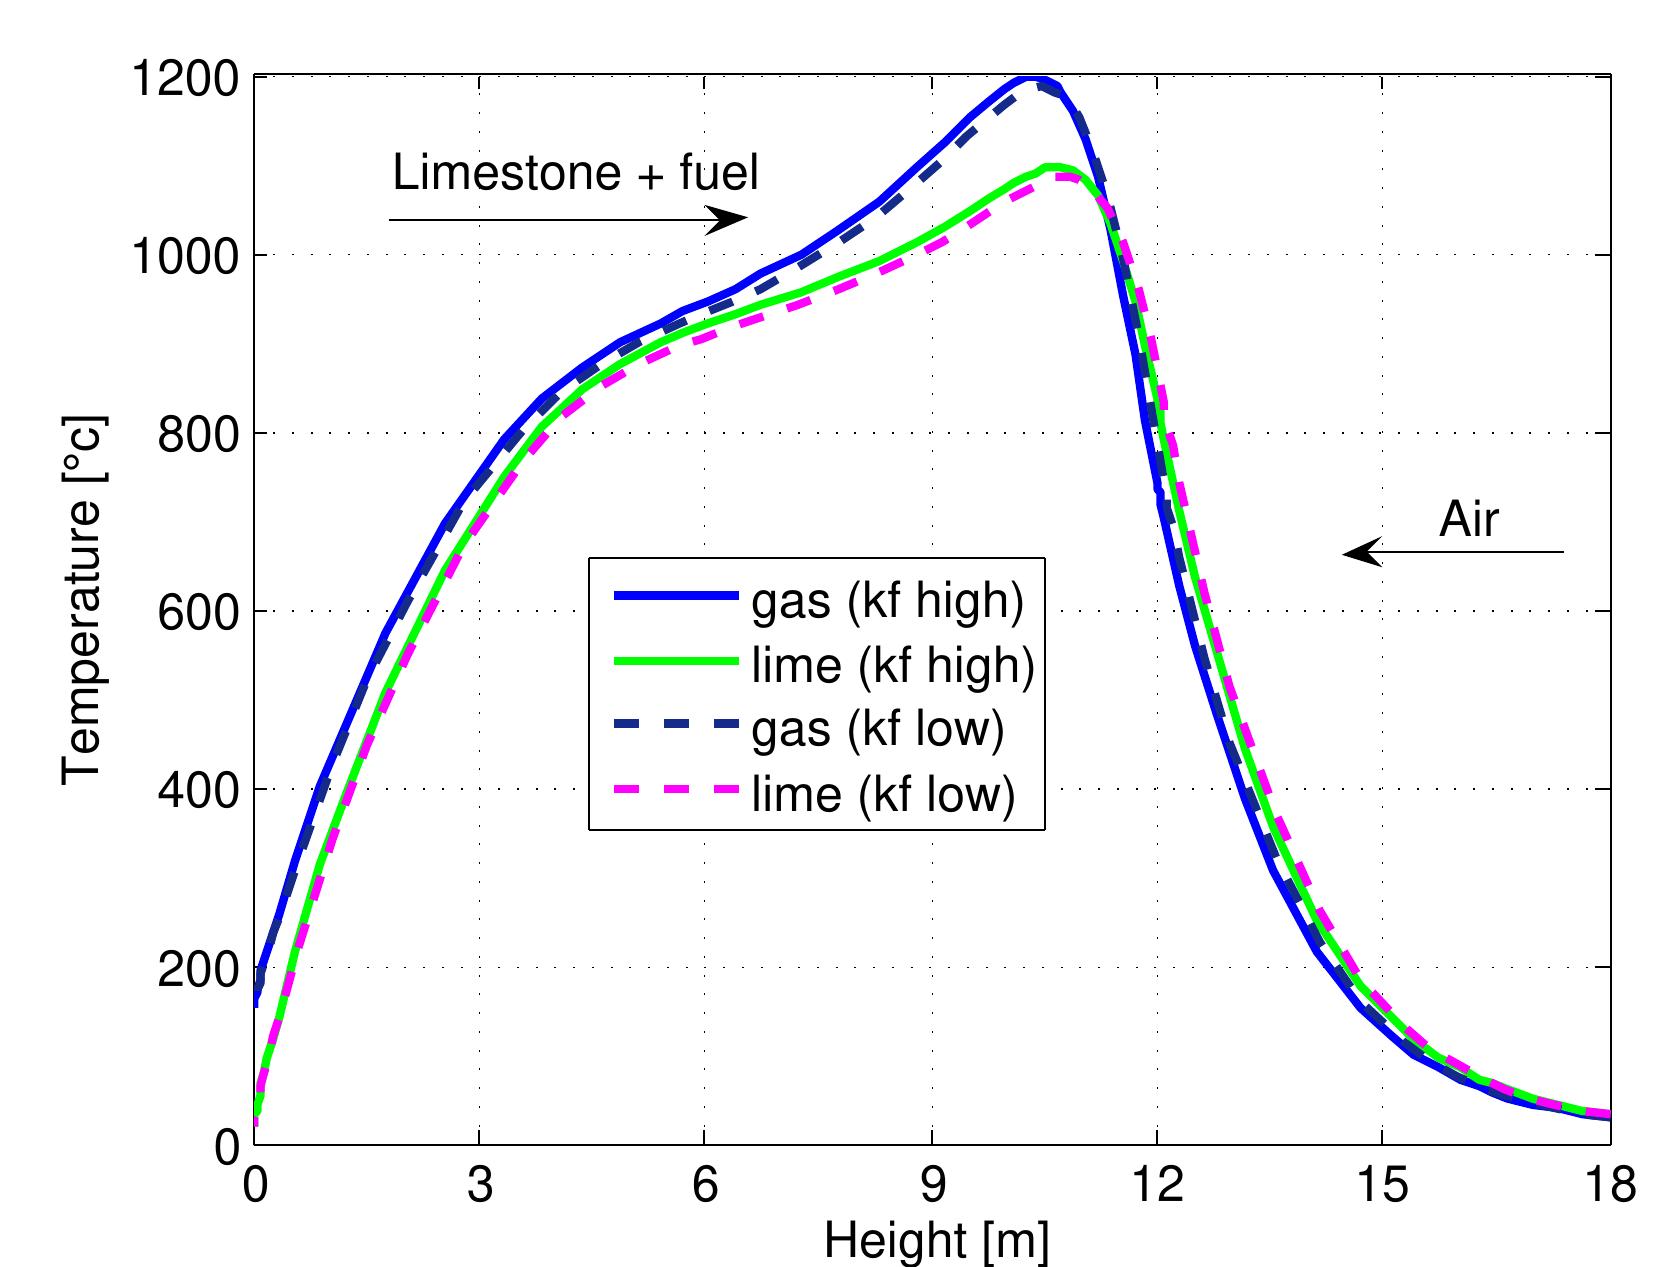
Figure 7.20: Temperature profiles in a mixed feed lime kiln with two coke reactivities and data from table 6.4.

Loading Preview
Sorry, preview is currently unavailable. You can download the paper by clicking the button above.
References (93)
- C.Thieme, "Sodium carbonate." Wiley-VCH Verlag GmbH and Co. KGaA, Weinheim, 2005.
- K. M. Wagialla, I. S. Al-Mutaz, and M. E. El-Dahshan, "The manufacture of soda ash in the arabian gulf." International Journal of Production Economics, vol. 21, pp. 145-153, 1992.
- D. M. Kiefer, "Soda ash, solvay style." Today's Chemist at Work, vol. 11, No. 2, pp. 87-90, 2002.
- D. S. Kostick, "Soda ash." Minerals Yearbook, US Geological Survey, 2006.
- J. Oates, Lime and Limestone Chemistry and Technology,Production and Uses. WILEY-VCH Verlag GmbH, 1998.
- K. Koike and S. Matsuda, "Characterizing content distributions of impurities in a limestone mine using a feedforward neural network." Natural Resources Research, vol. 12, No. 3, 2003.
- A. B. Leslie and J. J. Hughes, "High-temperature slag formation in historic scottish mortars: evidence for production dynamics in 18th19th century lime production from charlestown." Materials Characterization, vol. 53, pp. 181-186, 2004.
- A. I. Gamej, A. Perlevskij, O. Kurchenko, Z. Bol'shakova, and E. Malikova, "Im- provement in quality of preparation of limestone charged into the firing units." Stal, vol. 12, pp. 9-11, 2004.
- H. N. Tran, S. Vollick, M. Gauthier, and C. McNeil, "Correlation between nodule size and residual carbonate content in lime kiln." Proceedings of Tappi Environ- mental Pulping and Engineering Conference, Philadelphia, 2005.
- G. Lienbacher and E. D. Cristea, "Investing." World Cement, vol. 37, pp. 17-22, 2006.
- K. Gehan, F. K. Ngian, and J. W. Grunden, "Solids distribution in vertical shaft mixed feed lime kilns." Eleventh Australian Chemical Engineering Conference on Chemical Engineering Today, Coping With Uncertaint Brisbane, Aust.
- A. Senegacnik, J. Oman, and B. S. irok, "Annular shaft kiln for lime burning with kiln gas recirculation." Applied Thermal Engineering, vol. 28, pp. 785-792, 2008.
- V. T. Ryazanov, V. V. Madison, A. S. Dorokhin, and S. S. Shulgin, "Improving the heating system and structure of shaft furnaces for roasting limestone." Steel in Translation, vol. 40,No.3, pp. 298-304, 2010.
- P. Accinelli, "New life for old lime kilns." World Cement, vol. 37, 2006.
- D. Terruzzi, E. Barberis, and F. Marangoni, "The latest process know-how for single lime kilns." ZKG International, vol. 54, pp. 506-513, 2001.
- A. F. Reshetnyak, V. Konev, A. Mamaev, and N. Seryakov, "Improvement of shaft furnace construction for roasting limestone." Refractories and Industrial Ceramics, vol. 49,no. 3, pp. 25-27, 2008.
- V. I. Matyukhin, Y. G. Yaroshenko, and O. V. Matyukhin, "Improvement of thermal modes of shaft furnaces of nonferrous metallurgy." Non-Ferrous Metals, vol. 51,No.3, pp. 255-262, 2010.
- P. Zeisel, "Annular shaft kilns with the treivo system." ZKG International, vol. 49, pp. 530-539, 1996.
- W. Arnold, "Annular shaft kilns with injector air preheating." ZKG Interna- tional, vol. 50, pp. 86-94, 1997.
- H. Piringer, "Fuel gases with low calorific value for firing pfr lime shaft kilns." ZKG International, vol. 56, NO.6, pp. 66-72, 2003.
- E. D. Cristea, D. Maffioli, and T. Christiansen, "Operational performance of twin shaft vertical kilns fired with two fuels and with lean gas." ZKG International, vol. 54, pp. 232-242, 2001.
- L. Ernstbrunner and S. Lechner, "The use of secondary fuels in the european lime industry." ZKG International, vol. 55, pp. 54-63, 2002.
- H. Piringer and W. Werner, "Conversion of large-diameter single shaft kilns to lignite dust firing successfully concluded." ZKG International, vol. 61, pp. 46-52, 2008.
- D. Lewerenz, "Conversion of a conventional shaft kiln to pulverized lignite firing." Zement-Kalk-Gips, Edition B., vol. 38(2), pp. 84-86, 1985.
- D. Terruzzi, "Lime shaft kilns using the 'two way pressure system' -a new generation of vertical lime kilns." ZKG International, Edition B, vol. 47, pp. 322-326, 1994.
- A. Bes, "Dynamic process simulation of limestone calcination in normal shaft kilns." Ph.D. dissertation, Institute of Fluid Dynamics and Thermodynamics, Otto von Guericke University, Magdeburg, 2006.
- D. HaiDo and E. Specht, "Numerical simulation of heat and mass transfer of limestone decomposition in normal shaft kiln." ASME/JSME 2011 8th Ther- mal Engineering Joint Conference (AJTEC2011) March 1317, 2011, Honolulu, Hawaii, USA.
- F. Marias and B. Bruyres, "Modelling of a biomass fired furnace for production of lime." Chemical Engineering Science, vol. 64, pp. 3417-3426, 2009.
- Y. Gordon, V. Shvidkiy, and Y. Yaroshenko, "Optimization of the design and operating paramaters of shaft furnaces." 3rd International Conference Science and Technology of Ironmaking, June 1620, 2003, Dusseldorf., pp. 311-316.
- A. Senegacnik, J. Oman, and B. Sirok, "Analysis of calcination parameters and the temperature profile in an annular shaft kiln. part1:theoretical survey." Ap- plied Thermal Engineering, vol. 27, pp. 1467-1472, 2007.
- --, "Analysis of calcination parameters and the temperature profile in an an- nular shaft kiln. part2: Results of tests." Applied Thermal Engineering, vol. 27, pp. 1473-1482, 2007.
- X. Zhiguo, "Reduced model for flow simulation in the burner region of lime shaft kilns." Ph.D. dissertation, Institute of Fluid Dynamics and Thermodynamics, Otto von Guericke University, Magdeburg, 2010.
- T. Bluhm-Drenhaus, E. Simsek, S. Wirtz, and V. Scherer, "A coupled fluid dynamic-discrete element simulation of heat and mass transfer in a lime shaft kiln." Chemical Engineering Science, vol. 65, pp. 2821-2834, 2010.
- C. L. Virma, N. G. Dave, and S. K. Saraf, "Performance estimation vis-a-vis design of mixed-feed lime shaft kilns." Zement Kalk Gips, vol. 9, pp. 471-477, 1988.
- C. L. Virma, "Simulation of lime shaft kilns using mathematical modelling." Zement Kalk Gips, vol. 12, pp. 576-582, 1990.
- Z. Yi, J. Zhou, and H. Chen, "Numerical simulation of thermal process and en- ergy saving of lime furnace." Journal of Central South University of Technology., vol. 12,no. 3, pp. 295-299, 2005.
- V. S. Shagapov, M. V. Burkin, A. V. Voronin, and A. A. Shatov, "Calculation of limestone burning in a coke-fired kiln." Theoretical Foundations of Chemical Engineering, vol. 38, pp. 440-447, 2004.
- V. S. Shagapov and M. V. Burkin, "Theoretical modeling of simultaneous pro- cesses of coke burning and limestone decompostion in a furnace." combustion, Explosion, and Shock waves, vol. 44, no. 1, pp. 55-63, 2008.
- A. Bes, E. Specht, and G. Kehse, "Influence of the type of fuel on the energy consumption in lime burning." ZKG International, vol. 60,no. 9, 2007.
- M. Asadi, Beet-Sugar Handbook. WILEY-INTERSCIENCE, A JOHN WILEY and SONS, INC., PUBLICATION, 2007, ch. Sugarbeet processing, pp. 195-212.
- I. Glassman and R. A. Yetter, Combustion. Elsevier, 2008.
- M. S. Ulzama, "A theoretical analysis of single coal particle behavior during spontaneous devolatilization and combustion." Ph.D. dissertation, Institute of Fluid Dynamics and Thermodynamics, Otto von Guericke University of Magde- burg, 2007.
- S. Wang, H. Lu, Y. Zhao, R. Mostofi, H. Y. Kim, and L. Yin, "Numerical study of coal particle cluster combustion under quiescent conditions." Chemical Engineering Science, vol. 62, pp. 4336-4347, 2007.
- V. Manovic, M. Komatina, and S. Oka, "Modeling the temperature in coal char particle during fluidized bed combustion." Fuel, vol. 87, pp. 905-914, 2008.
- R. He, T. Suda, T. Fujimori, and J. Sato, "Effects of particle sizes on transport phenomena in single char combution." Heat and Mass Transfer, vol. 46, pp. 3619-3627, 2003.
- B. Remiarov, J. Markos, R. Zajdlik, and L. Jelemensky, "Identification of the mechanism of coal char particle combustion by porous structure characteriza- tion." Fuel Processing Technology, vol. 85, pp. 303-321, 2004.
- A. K. Sadhukhan, P. Gupta, and R. K. Saha, "Modelling of combustion charac- teristics of high ash coal char particles at high pressure: Shrinking reactive core model." Fuel, vol. 89, pp. 162-169, 2010.
- C. Chen and T. Kojima, "Single char particle combustion at moderate temper- ature: effects of ash." Fuel Processing Technology, vol. 47, pp. 215-232, 1996.
- R. E. Mitchell, L. Ma, and B. Kim, "On the burning behavior of pulverized coal chars." Combustion and Flame, vol. 151, pp. 426-436, 2007.
- A. Kasai, T. Murayama, and Y. Ono, "Measurement of effective thermal con- ductivity of coke." ISIJ International, vol. 33, No.6, pp. 697-702, 1993.
- Y. Zhao, H. Y. Kim, and S. S. Yoon, "Transient group combustion of the pul- verized coal particles in spherical cloud." Fuel, vol. 86, pp. 1102-1111, 2007.
- B. Hallak, "Ermittlung der zuendbedingungen fester fossiler brennstoffe gleicher geometrie bei verschiedenen umgebungszuständen." Master's thesis, Institute of Fluid Dynamics and Thermodynamics, Otto von Guericke University, Magde- burg, 2009.
- C. H. Satterfield and F. Feakes, "Kinetics of the thermal decomposition of cal- cium carbonate." A.I.Ch.E. J., vol. 5, pp. 115-122, 1959.
- G. D. Silcox, J. C. Kramlich, and D. W. Pershing, "A mathematical model for the flash calcination of dispersed caco3 and ca(oh)2 particles." Ind. Eng. Chem. Res., vol. 28, pp. 155-160, 1989.
- J. Khinast, G. F. Krammer, C. Brunner, and G. Staudinger, "Decomposition of limestone: The influence of co 2 and particle size on the reaction rate." Chemical Engineering Science, vol. 51, No.4, pp. 623-634, 1996.
- I. Ar and G. Dogu, "Calcination kinetics of high purity limestones." Chemical Engineering Science, vol. 83, pp. 131-137, 2001.
- F. Garcia-Labiano, A. Abad, L. F. deDiego, P. Gayan, and J. Adanez, "Calcina- tion of calcium-based sorbents at pressure in a broad range of co 2 concentrations." Chemical Engineering Science, vol. 57, pp. 2381-2393, 2002.
- C. Cheng and E. Specht, "Reaction rate coefficients in decompostion of lumpy limestone of different origin." Thermochimica Acta, vol. 449, pp. 8-15, 2006.
- R. H. BORGWARDT, "Calcination kinetics and surface area of dispersed lime- stone particles." AlChE Journal, vol. 31, No. 1, 1985.
- H. Naiyi and A. W. Scaroni, "Calcination of pulverized limestone particles under furnace injection conditions." Fuel, vol. 75, No.2, pp. 177-186, 1996.
- J. Stark and B. Wicht, Zement und Kalk, Birkhäuser, Basel, 2000.
- C. Noiriel, L. Luquot, B. Made, and J. L. L. Raimbault, P. Gouze, "Changes in reactive surface area during limestone dissolution: An experimental and mod- elling study." Chemical Geology, vol. 265, pp. 160-170, 2009.
- H. Kainer, E. Specht, and R. Jeschar, "Pore diffusion, reaction and thermal conduction coefficients of various limestones and their influence on decomposition time." Zement-Kalk-Gips., vol. 7, pp. 259-268, 1986.
- C. Cheng, E. Specht, and G. Kehse, "Influences of the origin and material prop- erties of limestone on its decomposition behaviour in shaft kilns." ZKG Interna- tional, vol. 60, no. 1, 2007.
- M. Silva, E. Specht, and J. Schmit, "Thermphysical properties of limestone as a function of origin (part 1): specific heat capacities." ZKG International, vol. 2, 2010.
- --, "Thermphysical properties of limestone as a function of origin (part 2): Calcination enthalpy and equilibrium temperature." ZKG International, vol. 6, 2010.
- J. Murray, "Specific heat data for evaluation of lime kiln performance." Rock Prod., p. 148, 1947.
- I. Barin and O. Knacke, "Thermochemical properties of inorganic substances." Springer-Verlag, Berlin, 1973.
- R. S. Boynton, Chemistry and technology of lime and limestone. John Wiley and Sons, 1980.
- E. Specht, "Kinetik der abbaureaktionen." Cuvillier Verlag, Göttingen, 1993.
- E. H. Baker, "The calcium oxide-carbon dioxide system in the pressure rang 1-300 atmospheres." J. Chem. Soc., pp. 464-470, 1962.
- J. Zsako and H. E. Arz, "Kinetic analysis of thermogravimetric data. vii. thermal decomposition of calcium carbonate." J.Therm. Anal., vol. 6, pp. 651-656, 1974.
- J. Szekely, J. W. Evans, and H. Y. Sohn, "Gas-solid-reactions." Academic Press, New York., 1976.
- R. Jeschar, "Druckverlust in mehrkornsch-uttungen aus kugeln." Archiv für das Eisenhuettenwesen, vol. 35, pp. 91-108, 1964.
- F. A. L. Dullien, Porous Media. Fluid Transport and Pore Structure. Academic Press Inc., 1992.
- L. Roblee, R. Baird, and J. Tierney, "Radial porosity variations in packed beds." A.I.Ch.E., vol. 4, pp. 460-464, 1958.
- D. Coelho, J.-F. Thovert, and P. Adler, "Geometrical and transport properties of random packings of spheres and aspherical particles." Physical Review E., vol. 55(2), pp. 1959-1978, 1997.
- E. Tsotsas, "Product quality in process and chemical engineering handout for master of quality, safety, environment program." Otto von Guericke University, Magdeburg.
- S. Ergun, "Fluid flow through packed columns." Chem. Engng. Prog., vol. 48(2), pp. 89-94, 1952.
- M. Mayerhofer, J. Govaerts, N. Parmentier, H. Jeanmart, and L. Helsen, "Exper- imental investigation of pressure drop in packed beds of irregular shaped wood particles." Powder Technology, vol. 205, pp. 30-35, 2011.
- C. Cheng, "Thermal process simulation of reactive particles on moving grates." Ph.D. dissertation, Institute of Fluid Dynamics and Thermodynamics, Otto von Guericke University, Magdeburg, 2007.
- M. Brauer, "Grundlagen der einphasen-und mehrphasenstromungen." Sauer- laender Verlag, Aarau u. Frankfurt, 1971.
- Gnielinski, "Wärme-und stoffübertragung in festbetten." Chem. Eng. Technol., vol. 52, pp. 228-236, 1980.
- R. Jeschar, "Heat transfer in pelletizing with mixed feed." Archiv fr das Eisen- huttenwesen, vol. 35, 1964.
- R. Leth-Miller, A. D. Jensen, P. Glarborg, L. M. Jensen, P. Hansen, and S. B. Jorgensen, "Investigation of a mineral melating cupola furnace. part2 mathemat- ical modeling." Ind. Eng. Chem. Res., vol. 42, pp. 6880-6892, 2003.
- N. N. Viswanathan, M. N. Srinivasan, and A. K. Lahiri, "Process simulation of cupola." ISIJ International, vol. 38, pp. 1062-1068, 1998.
- L. D. Smoot and P. J. Smith, Coal combustion and gasification. Plenum Press, New York, 1985.
- R. Chakraborty and J. Howard, "Combustion of char in shallow fluidized bed combustors-influence of some design and operating parameters." Inst Energy, pp. 48-54, 1981.
- H. S. Fogler, Elements of Chemical Reaction Engineering., 4th ed. Prentice Hall PRT, 2005.
- D. Merrick, "Mathematical models of the thermal decomposition of coal." Fuel, vol. 62, pp. 540-546, 1983. Curriculum Vitae Name: Magda K. M. El-Fakharany Date of Birth: July 06, 1975; in Kafr Elsheikh, Egypt. Nationality: Egyptian Status: Married, three Children E-mail: Magdaelfakharany@yahoo.com Education: 1993 -1998 B.Sc. in Mechanical Engineering. Faculty of Engineering, Tanta University, Egypt. 1998 -1999 Postgraduate courses for M.Sc. Faculty of Engineering, Tanta Uni- versity, Egypt. 1999 -2003 M.Sc. in Mechanical Power Engineering. Faculty of Engineering, Tanta University, Egypt. 2008 -Now Works towards Ph.D. degree at ISUT, Otto von Guericke University Magdeburg, Germany.
- Work Experience: 1998 -2003 Demonstrator in Dept. of Mechanical power Engineering, Faculty of Engineering, Tanta University, Egypt. 2003 -2007 Assistant lecturer in Dept. of Mechanical power Engineering, Faculty of Engineering, Tanta University, Egypt.
- Magdeburg,09, 01, 2012
- Magda El-Fakharany
FAQs
![]()
AI
What explains the use of coke and limestone in mixed feed shaft kilns?add
The study highlights that mixed feed shaft kilns efficiently produce lime and high CO2 concentrations, essential for industries like soda ash production. The method capitalizes on utilizing coke or anthracite as fuel, optimizing energy use and carbonation gas supply.
How does limestone quality affect kiln efficiency?add
Findings indicate that low-quality limestone reduces kiln efficiency due to higher impurities and inconsistent composition, leading to incomplete calcination and lower lime yields. Specifically, limestone quality directly correlates with operational challenges and suboptimal thermal performance.
What parameters significantly influence calcination temperature profiles?add
The model illustrates that fuels, mixed feed ratios, and air excess ratios substantially impact calcination temperature profiles, altering the length of operational zones within the kiln. Optimal parameters ensure effective heat transfer and maximize output efficiency.
When does the calcination of limestone begin in the kiln process?add
The initial calcination temperature is recorded at approximately 860°C, marking the transition from preheating to calcination, after which limestone decomposition becomes significant. This temperature threshold is critical for maximizing lime production efficiency.
How do differing fuel types affect the kiln's thermal dynamics?add
The research indicates that using coke versus anthracite markedly alters temperature profiles, with coke producing higher peak temperatures but potentially leading to higher CO emissions. Conversely, anthracite promotes faster decomposition but has a lower overall combustion rate.