Study of Waste Water Effluent Characteristics Generated from Paper Industries (original) (raw)
Abstract
This paper show the physico-chemical characteristics of effluent discharge from paper and pulp industry. The effluent from the paper industry is characterized by high amount of COD, BOD, TDS, pH, SS, Colour .The samples were collected from the inlet and outlet of the effluent treatment plant of paper mill. The samples were analyzed and compared with the Indian standards of effluent discharge. The effluent before treatment average range contains pH of 8.5±0.278, Suspended Solids of 1720.33±253 mg/lt, Total Dissolved Solids average ranges from 2658.33±81.44 mg/lt, Colour value is 735±108.28 PCU, COD and BOD varies 2420±259.55 mg/lt and 778.33±43.10 mg/l simultaneously. After the treatment of waste water average value of pH is 7.65±0.13, Suspended Solids 58.33±7.63 mg/lt, Total dissolved solids ranges from 1918.33±67.88 mg/lt, Colour value is 224.16±3.60 PCU, COD and BOD ranges from 214±1.73 mg/lt and 24±1 mg/lt, respectively. Result shows that the pH, SS, TDS, Colour, COD, BOD, within...
Figures (47)

3. RESULTS Table 1: Analytical methods for physico-chemical parameters of pulp and paper mill effluents

Fig. 1: Bar graph of Average of variations of different physiochemical parameters in effluent from Inlet of paper mill

Table 3: Average of variations of different physiochemical parameters in effluent from Outlet of paper mill:

Fig. 2: Bar graph of Average of variations of different physiochemical parameters in effluent from Inlet of paper mil

On the basis of above discussion it is concluded that the effluent discharged from paper industry in the selected area was within the permissible ranges of the standards of CPCB, but proper strategies can be used to treat the effluent prior to its disposal to the environment. The paper mill is growing fast and produces different varieties of paper. The physico-chemical characteristics of effluent from this mill revealed that the effluent is light brown in colour, pH shows alkaline nature of the effluent, SS, BOD, COD are the parameters from the treated effluent is under norms in concentrations compared to CPCB (Central pollution Board) standards.
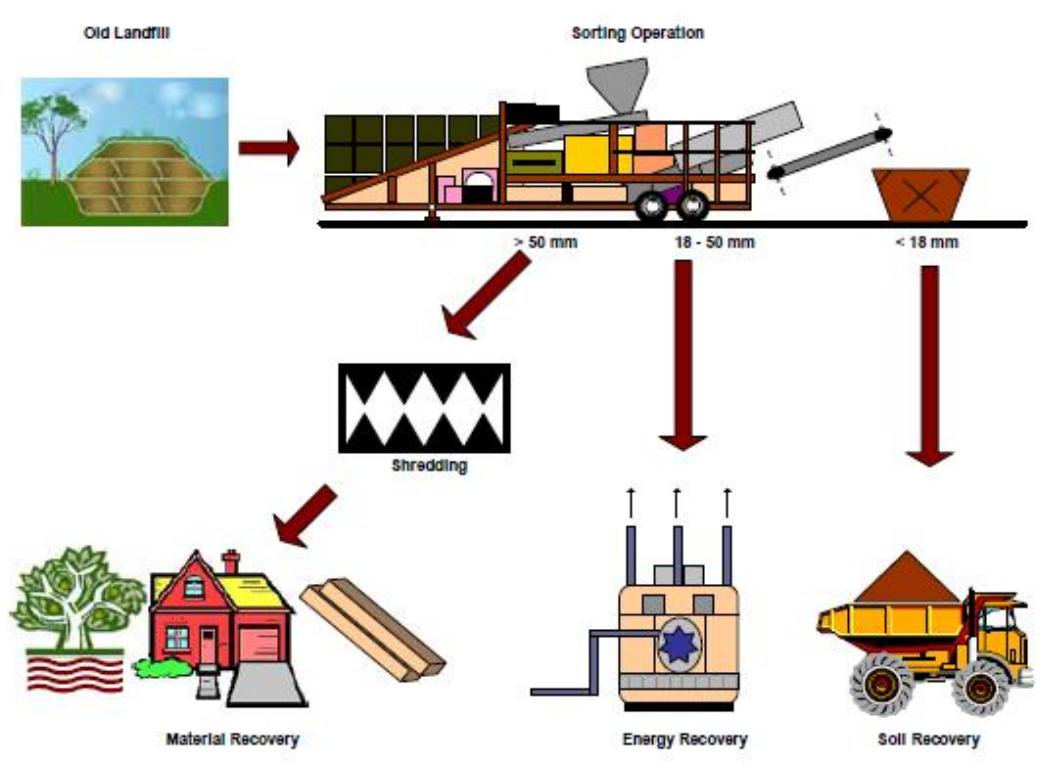
Fig. 1 Schematic of landfill mining process (Carius et al, 1999) A landfill mining project usually consists of an excavator that removes the deposited matter from the dump. The bulky pieces are then removed from the excavated stuff and smaller stockpiles which are easier to handle are made using a front end loader. A trommel is then deployed to physically segregate the soil and solid waste. Trommel screens are much more effective than vibrating screens for basic project (Murphy 1993). The size and type of the screen deployed depend on the end use of the recovered material. A 6.25 mm screen for example, would be deployed when the reclaimed soil is to be used for landfill cover, where as a 2.5mm sieve would be deployed when tiny fractions of metals, plastics, glass etc. are to be recovered from within a large soil fraction. The efficiency of the material recovery is largely governed by the waste composition, mining technology and the efficiency of the segregation technology.


Apparently the facts and figures of a survey reveal that an average household dissipates around 5.6 to 7.6 liters of water per minute for dish-washing while 3.8 liters of water each is exhausted with regard to teeth-brushing, face-washing and shaving purposes. The outrageous statistic is that the utmost part of it is foolishly flushed out to the drains.Water being wasted is wistful. A survey intended to specify the amount of water an average Indian household splurges out each day through and through the flush lead us to the idea of reusing the water outletted through the basins for the same. The research basically has its foundation laid on the gallons of water recklessly depleted that could instead be put to proper and prolonged

While the amount of clean usable water on the planet remains more or less the same, the population has detonated.The availability and access to clean potable water is the goal line. Availability, that implies that the sufficient amount of water on earth must be conserved and also the three R’s must be put into practice to have appropriate amount for each one’s need. Accessibility emphasizes on water being available to the person who needs it, in the form she needs it and in a quality that satisfies the individual. Access and bereaving underlie most water judgments.

Not only the waters from the hand basins could be reused and thus the fresh water consumption by flushes could be reduced significantly, water from ROs, laundry, showers etc. could too be put to use. Figures show that an average shower uses almost 70-120 liters of freshwater. Another significant consumption is in laundry, 53-97 liters per load is used. Reverse Osmosis systems use an approximate amount of 7 to 11 liters of tap water so as to produce 3.7 liters of pure drinking water. Such large amounts of water being dumped is stressful. The water used for the purpose of showers, for instance, after usage becomes grey water which is clearly not synonymous to “waste water”. Our research model prioritizes to re-utilize this grey water from baths, dishwashers, faucets, showers, washing machines and letting it fill the toilet flushes which in turn saves the water wasted in that fraction as well. Isn’t that a approach infallible for this age of the fast and the furious?

The model looks like the figure as drawn below: 5. PRACTICAL APPLICATION
![Fig. 1: Effect of Active Packaging on PLW (%) of banana at RT and AT highest FLW was observed in intact Iruits may be due to high transpirational and respiratory substrate losses at ambient temperature. However the magnitude of losses was lower at low temperature and it may be due to reduced metabolic activities and evapotranspirational losses. Among the treatments of AP, chitosan coated fruits showed minimum weight loss throughout storage period, whereas, fruit samples showed maximum PLW when treated with ethylene scavenger followed by moisture scavenger followed by O, and CO, scavenger as these scavengers possess the tendency to absorb moisture from the fruit surface and utilized in the chemical reactions, so all the scavengers happened to absorb water during storage. At ambient temperature, among all the treatments minimum reduction in PLW was observed in coated fruits. The results obtained in the present investigation are in accordance with previously reported results by increase in PLW with increasing duration of storage but the PLW was lower in coated samples than the control in mango fruit stored at ambient conditions (20-30°C and 70-90% RH), Giri et al. [6]. Further, Lin and Zhao [13] observed that edible coatings provide an effective barrier to oxygen, carbon dioxide and water vapour transmission thus helping to alleviate the problem of moisture loss.](https://figures.academia-assets.com/83172496/figure_010.jpg) ](
](Fig. 1: Effect of Active Packaging on PLW (%) of banana at RT and AT highest FLW was observed in intact Iruits may be due to high transpirational and respiratory substrate losses at ambient temperature. However the magnitude of losses was lower at low temperature and it may be due to reduced metabolic activities and evapotranspirational losses. Among the treatments of AP, chitosan coated fruits showed minimum weight loss throughout storage period, whereas, fruit samples showed maximum PLW when treated with ethylene scavenger followed by moisture scavenger followed by O, and CO, scavenger as these scavengers possess the tendency to absorb moisture from the fruit surface and utilized in the chemical reactions, so all the scavengers happened to absorb water during storage. At ambient temperature, among all the treatments minimum reduction in PLW was observed in coated fruits. The results obtained in the present investigation are in accordance with previously reported results by increase in PLW with increasing duration of storage but the PLW was lower in coated samples than the control in mango fruit stored at ambient conditions (20-30°C and 70-90% RH), Giri et al. [6]. Further, Lin and Zhao [13] observed that edible coatings provide an effective barrier to oxygen, carbon dioxide and water vapour transmission thus helping to alleviate the problem of moisture loss.

![samples followed by samples treated with ethylene scavenger (0.162 and 1.161%), moisture scavenger (0.159 and 0.161%), O, scavenger (0.157 and 0.154%), CO, scavenger (0.153 and 0.147%) and minimum (0.150 and 0.122%) was observed in control samples at RT and AT on 15th and 9th day of storage respectively. AP treatments except CO, significantly retained acidity at RT whereas, at AT all AP treatments significantly retained the acidity (p<0.05). The control fruit samples had minimum acidity at the end of the storage at RT and AT. However the magnitude of reduction in acidity was lower at low temperature than AT storage conditions that attributed to lower rate of ripening. The progressive decrease in acidity could be due to conversion of acids into sugars during ripening process. Among AP treatments, chitosan coated samples were found to be effective in maintaining higher acidity i.e. it significantly decreased the reduction in acidity at RT at final day of storage whereas, AP treatments except CO» scavenger significantly retained the acidity in all the fruits at AT. This is supported by Castro et al. [5] who observed that the rate of reduction in acidity in coated fruits compared to uncoated fruits is low due to restriction of oxygen availability that leads to reduced respiration rate. Further, Jiang ef al. [10] also reported the effect of chitosan coatings on litchi fruit and found that titratable acidity decreased during storage. Fig. 3: Effect of Active Packaging on titratable acidity (%) of banana at RT and AT](https://figures.academia-assets.com/83172496/figure_012.jpg) ](
](samples followed by samples treated with ethylene scavenger (0.162 and 1.161%), moisture scavenger (0.159 and 0.161%), O, scavenger (0.157 and 0.154%), CO, scavenger (0.153 and 0.147%) and minimum (0.150 and 0.122%) was observed in control samples at RT and AT on 15th and 9th day of storage respectively. AP treatments except CO, significantly retained acidity at RT whereas, at AT all AP treatments significantly retained the acidity (p<0.05). The control fruit samples had minimum acidity at the end of the storage at RT and AT. However the magnitude of reduction in acidity was lower at low temperature than AT storage conditions that attributed to lower rate of ripening. The progressive decrease in acidity could be due to conversion of acids into sugars during ripening process. Among AP treatments, chitosan coated samples were found to be effective in maintaining higher acidity i.e. it significantly decreased the reduction in acidity at RT at final day of storage whereas, AP treatments except CO» scavenger significantly retained the acidity in all the fruits at AT. This is supported by Castro et al. [5] who observed that the rate of reduction in acidity in coated fruits compared to uncoated fruits is low due to restriction of oxygen availability that leads to reduced respiration rate. Further, Jiang ef al. [10] also reported the effect of chitosan coatings on litchi fruit and found that titratable acidity decreased during storage. Fig. 3: Effect of Active Packaging on titratable acidity (%) of banana at RT and AT

The headspace O, and CO, (%) levels in all the fruit packages were analyzed using gas analyzer and the observations regarding O, concentration are presented in Fig. 5.(a,b) for banana whereas; the observations regarding CO, concentration for are presented in Fig. 6.(a,b) for banana. The initial concentration of O2 was 21% and CO, was 0.03%. Maximum retention of O2 concentration (12.20 and 7.37%) was observed in chitosan coated banana samples followed by samples treated with ethylene scavenger (10.57 and 6.93%), moisture scavenger (9.23 and 4.60%), O2 scavenger (9.13 and 4.50%), CO, scavenger (9.13 and 4.17%) and lowest (8.47 and 4.03%) in control samples at RT and AT on 15th and 9th day of storage respectively. AP treatments significantly (p<0.05) maintained the O, concentration at RT whereas; AP treatments except CO, and O, scavengers significantly maintained the Oz concentration at AT.
![fruits can be attributed to slow ripening rate of treated fruits. Srinivasa et al. [17] observed that coatings prevent transfer of gases between the fruit and atmosphere and served as a protective layer that control the permeability of O2 and O, and therefore, prevent the oxidation of vitamin C by hindering the fruit’s exposure to oxygen, altering enzymatic activity and slowing the respiration process. Fig. 4: Effect of Active Packaging on ascorbic acid (mg/100g) of banana at RT and AT](https://figures.academia-assets.com/83172496/figure_014.jpg) ](
](fruits can be attributed to slow ripening rate of treated fruits. Srinivasa et al. [17] observed that coatings prevent transfer of gases between the fruit and atmosphere and served as a protective layer that control the permeability of O2 and O, and therefore, prevent the oxidation of vitamin C by hindering the fruit’s exposure to oxygen, altering enzymatic activity and slowing the respiration process. Fig. 4: Effect of Active Packaging on ascorbic acid (mg/100g) of banana at RT and AT
![samples had highest CO, concentration than the samples treated with AP treatments. All the AP treatments especially chitosan coated samples followed by ethylene and moisture scavengers delay ripening by the modification of gases and thereby significantly reduce (p < 0.05) the rate of respiration at both the storage temperatures. However, the magnitude was low at RT (low temperature). Our results are in accordance with Jiang and Li [11] who studied the effect of chitosan coating on fruits and concluded that chitosan coating may form a protective barrier on the fruit surface which reduces the availability of O,, and delays ripening in fruits. Furthermore, chitosan coating can also reduce the internal O, concentration in treated fruits and so produce low CO, and ethylene concentration. Further, Baez-Sanudo et al. [4] evaluated the effects of 1-methyl cyclopropene and chitosan based edible coating on banana fruits during storage of 8 days at 22°C, 85% RH and found that treated fruits showed a lower rate of respiration than control fruits. Fig. 6: Effect of Active Packaging on CO, (%) of banana at RT and AT](https://figures.academia-assets.com/83172496/figure_015.jpg) ](
](samples had highest CO, concentration than the samples treated with AP treatments. All the AP treatments especially chitosan coated samples followed by ethylene and moisture scavengers delay ripening by the modification of gases and thereby significantly reduce (p < 0.05) the rate of respiration at both the storage temperatures. However, the magnitude was low at RT (low temperature). Our results are in accordance with Jiang and Li [11] who studied the effect of chitosan coating on fruits and concluded that chitosan coating may form a protective barrier on the fruit surface which reduces the availability of O,, and delays ripening in fruits. Furthermore, chitosan coating can also reduce the internal O, concentration in treated fruits and so produce low CO, and ethylene concentration. Further, Baez-Sanudo et al. [4] evaluated the effects of 1-methyl cyclopropene and chitosan based edible coating on banana fruits during storage of 8 days at 22°C, 85% RH and found that treated fruits showed a lower rate of respiration than control fruits. Fig. 6: Effect of Active Packaging on CO, (%) of banana at RT and AT
![ambient storage and concluded that alumina-limestone based formulation increased the overall extension of shelf-life from 3-8 days. Kudachikar et al. [12] found that banana packed with LDPE film in combination of ethylene adsorbent stored under 13°C extended the shelf-life upto 42 days. Fig. 7: Effect of Active Packaging on ethylene (ul C,H4/kg/h) of banana at RT and AT](https://figures.academia-assets.com/83172496/figure_016.jpg) ](
](ambient storage and concluded that alumina-limestone based formulation increased the overall extension of shelf-life from 3-8 days. Kudachikar et al. [12] found that banana packed with LDPE film in combination of ethylene adsorbent stored under 13°C extended the shelf-life upto 42 days. Fig. 7: Effect of Active Packaging on ethylene (ul C,H4/kg/h) of banana at RT and AT

2.3 Moisture scavenger Table 2. describes the formulation of CO, scavenger based on activated charcoal, for this four types of formulations were tried by using activated charcoal as main ingredient and silica gel in different concentration ratios (1:0, 9:1, 8:2 and 7:3) and finally for 100g of CO, scavenger was prepared by mixing 80g activated charcoal with 20g silica gel by maintaining the ratio of 8:2. This concentration was selected on the basis of CO), absorption as shown in the given Table 2. The selected concentration of CO, scavenger reduces the CO, concentration from 0.03 to 0.016 per cent when measured after 4 days.

2.1.2 Carbon dioxide scavenger Table 1: Formulation of oxygen scavenger

2.4.1. Selection of sachet material Table 4: Formulation of ethylene scavenger

Table 5: Selection of sachet material 2.4.2. Sachet preparation: Sachet was prepared by selecting high density woven fabric (100 gauge) which was permeable to gases but impermeable to active packaging ingredients, it was cut into 8 x 4 cm with scissors and 2 sides were sealed by

2.4.3. Filling of prepared scavengers inside sachet: 5g dried scavenger granules of O,, CO», moisture and ethylene scavengers were weighed and filled in sachet (4 x 4 cm) prepared from gas permeable high density woven fabric but impermeable to sachet ingredients and heat-sealed by using an electronic form, fill and seal machine and packed in LDPE pouches for further use. 2.5. Antimicrobial film/coating

3. CONCLUSION” Table 5: Formulation of antimicrobial film forming solution

Fig. 1 I): Short angle XRD diffraction pattern of a) SBA-15 b) RuS@SBA-15 ID Schematics of visible light induced photocyanation of tertiary amines. cree See ae ee ee a ee ee SS eee ee ee eS eee ee ee ee ee ee ee ee eS ee ee ee ee on photoactive supports like graphene, carbon nitride, SBA-15 etc. makes them recyclable as well increase their catalytic performance. Herein, we report a new microwave synthesized heteroleptic ruthenium previously synthesized by our group and characterised by 'H and "°C NMR, ESI-HR-MS and UV-Vis spectroscopy. The synthesized catalyst was immobilized on highly mesoporous SBA-15 material as efficient photoredoxcatalyst for oxidative cyanation of wide range of tertiary amines to corresponding a-aminonitriles via C-H activation anc characterized by FTIR, TGA, XRD, ICP-AES, BET, CHNS, UV-Vis etc. The catalytic activity of the photocatalyst was tested for the oxidative cyanation of various tertiary amines under visible light irradiation. The developed catalytic system yields a-aminonitriles from corresponding amines in excellent yields. Due to the heterogenization of the synthesized catalyst on the photoactive support, it can be recovered and reusec for further reactions withoyt mych loss in the activity.

Fig: 1: a) XRD diffraction pattern of a) meso-CeO, b) CoPcS/meso-CeO, and c) Co-doped/meso CeO, and 2. a) UV-Vis spectra of CoPcS b) meso-CeO, c) CoPcS/meso-CeO, d) Co-doped/meso CeO, Abstract—Oxidation of thiols to disulfides is immensly important because this not only remove thiols from petroleum products but als« extracted thiols can be used in synthetic industries. Many catalytic systems like conventional oxidants such as manganese dioxide, dichromates chlorochromates, etc., other catalytic systems like cobalt, manganese, copper, vanadium, cerium, and nickel based catalysts have beer reported for the aerobic oxidation of thiols into disulfides. Visible light initiated organic transformation has attracted scientific community fo the development of green and sustainable catalytic system. Semiconductor like TiO2, CeO2 etc. can may be applied for this purpose because o their electron transfering ability. Meso CeO? is good in the sense of its good visible light absorption pattern. But high electron hole pair. recombination make this unsuitable for practical application. Doping with metals like Ag, Au, Cu, Co etc slowdown electron hole pai recombination rate. Most of doping methods use wet surface imprgnation methods that show leaching of metals from the surface o semiconductors catalyst. In this work we have developed a new method of cobalt, nitrogen and carbon doping on the surface of CeO. Th synthesized catalyst was charecterized with various techniques like SEM, TEM, FTIR, UV, XPS, ICP-AES, CHNS, BET, DT-TGA etc tha confirm the well synthesis of catalyst. The developed catalyst was used for visible light driven thiols oxidation to disulfides. Various thiols fron C, to Cy were checked for the photooxidation. All thiols was oxidized to disulfides within 5 hours. Further we have checked phocatalyti activity of catalyst for the oxidation of thiols in kerosene having premixed docecane thiols as model substrate for simulating conditions o sulfur containg thiols. It was found that catalyst was well functioning in this medium too. For confirming that developed catalyst was robus enough we have carried out recycling experiment and after four recycling there were no significant loss in activity of catalyst was found.

Abstract—Polypyrrole-zirconium(IV)selenoiodate (PPy/ZSI) cation exchange nanocomposite has been synthesized by chemical oxidative polymerization of polypyrrole in the presence of inorganic entity zirconium(IV)selenoiodate by sol-gel method. The formation of PPy/ZS nanocomposite was characterized by fourier transform infra-red spectroscopy (FTIR), x-ray diffraction (XRD), scanning electron microscop: (SEM), energy-dispersive x-ray (EDX), transmission electron microscopy (TEM)andthermogravimetric analysis (TGA). The ion exchang capacity of the nanocomposite was found to be 2.49 meqg”. Also, itselectrical conductivity was determined by using a four-in-line probe an was measured to be0.436 S cm'.The nanocomposite showed appreciable isothermal stability till 130 °Cin terms of DC electrical conductivit retention under ambient condition.In addition, the cation exchange nanocomposite based sensor for detection of formaldehyde vapors wa. fabricated at room temperature. It was revealed that the resistivity of the nanocomposite increases on exposure to higherpercent concentratio} of formaldehyde at room temperature (25 °C), also the sensor exhibited good reversible response towards formaldehyde vapors ranging fron 5-7%. The present study may serve as a basis for designing other smart materials for formaldehyde sensors. Keywords:Nanocomposite, polypyrrole, conductivity, formaldehyde, sensing.
[
Fig. 1: District heat energy Distribution building types, including residential, commercial, institutional and industrial. [he conversion procedures is concentrate on the types of onditions most likely to be found in cold weather countries .e. centralized chilled water district cooling systems, service ‘0 a variety of building sizes and types, applicable to both new and existingprimarily on larger buildings. It’s always possible he indirect and direct connection between the district chilled water and building systems.

2. ENERGY SECURITY AND REDUCING INFRASTRUCTURE COSTS IN POWER GENERATION AND WATER MANAGEMENT reduce the infrastructure required for storm water containment. Lastly, a DHS produces thermal energy on a large scale and is technology neutral. The nature of DHS allows for fuel diversity and flexibility. Should the cost of any one type of fuel increase dramatically in price, DHS have the ability to switch sources with minimal investment.DHS will allow municipalities to ensure their communities will be able to maintain reasonable fuel costs and a high standard of living. None of these economic benefits are included in current feasibility analyses yet they can be substantial. If these factors were included, the economic case for DHS would be made quite easily and communities could then benefit from the reduced carbon footprint for their heating and cooling.

Fig. 3: illustrates that DHS is not technology specific In the case of district heating system, hot water (or steam) transported through a sys- tem of pipes and delivered to t customer buildings for space heating and domestic water heating. The heat energy carried in the fluid is extracted by t building’s systems and the cooled water is returned to t central energy centre, in a closed loop is reheated for redistribution. Similarly with district cooling, piping system, where is he he he it chilled water is pumped through a network of pipes and t cooling energy is extracted by the build ne ing for air conditioning or process cooling and then the warmed water is returned to the plant to be cooled again.

Fig. 4: illustrates how DHS typically works.

Fig. 5: Shows particular buildingswitched from running its own chillers to a DHS 1 kWh saved during peak time is more significant than one saved at night. Exacerbating the problem, line losses are higher during peak times than low usage times. When the electricity transmission and distribution systems get hotter, the loss can be substantially higher than the average. In Ontario, the variation ranges from 5 % during low usage times to 25 % during peak hours according to an Ontario Hydro study. Taking into account the total losses from generation to delivery, saving 1 kW during peak times can reduce generating requirements by 1.47 kW (Ontario Hydro 2007).

Table 2: NOx and Sox output for various electricity generation forms (NRCAN GHGenius 2010) g/kWh Is the first choice for marginal requirements. As the demand increases, coal starts to come online as a last resort given how dirty it is.

Table 3: Cooling IESO, NRCAN 2010) Putting a price tag on GHG emissions and carbon footprint reduction may not be popular in many jurisdictions but policy makers should recognize its merits. Deciding the value of each ton of GHGs reduced and applying that value to projects could spur innovation beyond DHS.


Fig. 1: Reproduced from Water Pollution Control - A Guide to the Use of Water Quality Management Principle Eds by Richard Helmer and Ivanildo Hespanhol © 1997 WHO/UNEP ISBN 0 419 22910 8 a spring or a lake. Rivers carry dissolved minerals, organic compounds, small grains of sand, gravel, and other material as they flow downstream. Rivers begin as small streams, which grow wider as smaller streams and rivers join them along their course across the land. Eventually they flow into seas or oceans. There has been a steady deterioration in the quality of water of Indian rivers over several decades. India’s fourteen major, 55 minor and several hundred small rivers receive millions of liters of sewage, industrial and agricultural wastes. Most of these rivers have been rendered to the level of sewage flowing drains. There are serious water quality problems in the cities, towns and villages using these waters. Water borne diseases are rampant, fisheries are on decline, and even cattle are not spared from the onslaught of pollution. In the Himalayan region the Bhagirathi is joined by the tributaries Alaknanda and Mandakini to form the Ganga. After entering the plains at Hardiwar, it winds its way to the Bay of Bengal, covering 2,500 km through the provinces of Uttar Pradesh, Bihar and West Bengal.

Fig. 2: Average value of physicochemical parameter at all the sites A Total of three surface water samples were taken from each site at an interval of 1 week between 10 am-1 lam and slightly different results were obtained and an average value of all the parameter is taken. The results obtained from the entire Site are given below in the tabular form.

2.1 Analytical methods and equipment used in the study

4. RESULT & DISCUSSION

Keywords: MWCNTs; Poly-o-toluidine; Electrical conductivity; Thermal stability; Isothermal Stability.


Table 3: Peak positions (cm-1) of IR spectra of Pr3+ doped Li20-MO-B203 glasses. 3.3 Thermoluminescence

The highest values of these parameters are obtained for ZnO- modifier glass (ZnBPr) indicating it’s relatively high glass forming ability among the three glasses. Insets of Fig.1 represent; (a) the variation of Hruby's parameter and (b) the variation of (T.-T,) for pr’* ions doped glasses mixed with different modifier oxides.
![of bands is identified as due to the stretching relaxation of the B-O bond of the trigonal BO; units and the band at 710 cm’ is due to the bending vibrations of B-O-B linkages in the borate network [26-29]. A weak band observed around 456 cm’ is an indicative of the presence of ZnO, units in the ZnB series glass network [30,31].](https://figures.academia-assets.com/83172496/figure_031.jpg) ](
](of bands is identified as due to the stretching relaxation of the B-O bond of the trigonal BO; units and the band at 710 cm’ is due to the bending vibrations of B-O-B linkages in the borate network [26-29]. A weak band observed around 456 cm’ is an indicative of the presence of ZnO, units in the ZnB series glass network [30,31].
![Table 4: Data on various trap depth parameters of Li2O-MO- B203: Pr20Q3 glasses The action of X-ray irradiation on glasses is to produce secondary electrons from the sites where they are in a stable state and have an excess energy. Such electrons may traverse in the glass network depending upon their energy and the composition of the glass and are finally be trapped, thus forming color centres (or alternatively they may form excitons with energy states in the forbidden gap). The trapping sites may be the praseodymium ions which constitute the glass structure, ions of admixtures to the main composition and the structural defects due to impurities in the glass. Thus this process leads to the formation of 1) boron electron centres, 2) non-bridging oxygen hole centres and 3) boron oxygen hole centres [35-37]. Thermoluminescence is a consequence of radiative recombination between the electrons (released by heating from electron centre) and an anti bonding molecular orbital of the nearest of the oxygen hole centres. The observed TL peaks in the present glasses can be attributed due to such radiation.](https://figures.academia-assets.com/83172496/table_014.jpg) ](
](Table 4: Data on various trap depth parameters of Li2O-MO- B203: Pr20Q3 glasses The action of X-ray irradiation on glasses is to produce secondary electrons from the sites where they are in a stable state and have an excess energy. Such electrons may traverse in the glass network depending upon their energy and the composition of the glass and are finally be trapped, thus forming color centres (or alternatively they may form excitons with energy states in the forbidden gap). The trapping sites may be the praseodymium ions which constitute the glass structure, ions of admixtures to the main composition and the structural defects due to impurities in the glass. Thus this process leads to the formation of 1) boron electron centres, 2) non-bridging oxygen hole centres and 3) boron oxygen hole centres [35-37]. Thermoluminescence is a consequence of radiative recombination between the electrons (released by heating from electron centre) and an anti bonding molecular orbital of the nearest of the oxygen hole centres. The observed TL peaks in the present glasses can be attributed due to such radiation.

Tin of the existing glow peak shifted gradually towards higher temperatures with a gain in the intensity of TL light output. The glow peaks of praseodymium ion doped ZnBPr, CaBPr and CdBPr glasses shifted to 386K, 432K and 469K respectively. Fig. 3: Thermoluminescence emission of pure (dotted line) and Pr** ions doped (solid line) Li,O-MO- B,O; glasses. Inset figure represents the relative TL light output of pure and Pr*™ ions doped glasses

In the paper, Financial Viability, Value Addition and Constraint Analyses of Certified Organic Pineapple Production and Marketing in Ghana, John K.M. Kuwornu, Abdulai A. Nafeo and Yaw B. Osei-Asare have assessed the value added by the farmer, retailer and processor. It established that the processor adds the highest value per metric tonne of pineapple fruits followed by fresh fruit retailer and then the farmer. On the average the pineapple drying processor adds the highest total value per tonne of fresh pineapple followed by the slicing processor and then juicing processor. On the whole, the drying processor incurs the highest cost per tonne and hence sells at a higher price to obtain a value to recover cost and make some profit to remain in business compared to the slicing and then juicing processor. On a daily basis, the drying processor adds the highest value

Loading Preview
Sorry, preview is currently unavailable. You can download the paper by clicking the button above.
References (126)
- Medhi .U.J, Talukdar A.K, Deka. S. (2011)-Impact of paper mill effluent on growth and development of certain agricultural crops, Journal of Environmental Biology, (32), 185-188.
- Malaviya.P, Rathore.V.S, (2007)-Seasonal variations in different physico-chemical parameters of the effluents of Century Pulp and Paper Mill, Lal Kuan, Uttarakhand., Journal of Environmental Biology,28(2), 219-224.
- Ugurulu M, Karaoglu. M. H, Kula. I (2006)-Experimental investigation of chemical oxygen demand, lignin and phenol removal from paper mill effluents using three-phase three- dimensional electrode reactor, Polish J. Of Environ. Stud. 15(4), PP 647-654.
- O.Connor D.J. and W.W. Eckenfelder (1980)-Treatment of organic wastes in aerated lagoons., Journal of Water Pollution Control Federation, 32, pp. 365
- Lee, C.C. and Lin, S.D. (2000)-Handbook of environmental engineering calculations, McGraw-Hill Professional.
- Droste, R.L. (2004)-Theory and Practice of water and wastewater treatment, John Wiley & Sons, Inc., Singapore
- Standard methods for the examination of water and wastewater, (1998)-20th edn (American Public Health Association, American water works association, water environment federation), Washington, DC, USA.
- N.Kirkpatric, (1998)-A Handbook on "Pulp and Paper Industries", Pollution Prevention and Abatement. 395-399.
- W.Yuxing, Y,Jain, (1999)-Water Research, 33(16), 3512 REFERENCES
- ARRPET), Manual on Dumpsite Rehabilitation and Landfill mining -Asian Regional Research Program on Environment Technology 2004
- Visvanathan. C, et al, Landfill Management in Asia -Notions about future approaches to appropriate and sustainable solutions, 2003
- Vasudevan. N, et al , Study on Various Methods of Landfill remediation, 2003
- Rajkumar Nagrajan, Environmental Health Impact of leachate on ground water pollution due to non-engineered municipal solid waste landfill sites of Erode city, Tamil Nadu, India, et al, 2012
- J Kurian, Studies on landfill mining at solid waste dump sites in India , et al, 2003
- C H Raghumani Singh, M Dey, Surface water quality with respect to Municipal Solid Waste Disposal within the Imphal Municipality area, Manipur, 2014
- Cobb, CE, Ruckstuhl, Konrad , Mining and reclaiming existing sanitary landfills, 1998
- Gautam, S P , Municipal Solid Waste Management in Indian cities -A Review, et al, 2010
- Kumar, S, , Assessment of the status of municipal solid waste management in metro cities, state capitals, class I cities and class II towns in India: An insight, et al, 2009 REFERENCES [1] https://www.google.co.in/url?sa=t&rct=j&q=&esrc=s&source= web&cd=1&cad=rja&uact=8&ved=0CB0QFjAAahUKEwim28 yI2vnGAhWTCI4KHQg6C4Y&url=http%3A%2F%2Fwater.org %2Fwater-crisis%2Fwater- facts%2Fwater%2F&ei=JEy1Vaa5C5ORuASI9KywCA&usg=A
- FQjCNH5tSBz5jiQqvKzKognadKStxFemQ&bvm=bv.9871760 1,d.c2E
- AOAC., Official methods of analysis: Association of official analytical chemist, Washington, DC, USA, 15, 1990.
- AOAC., Official methods of analysis: Association of official analytical chemist, Gaithersburg, MD, USA, 17, 2005.
- Banks, N.H., "Some effects of Tal prolong coating on ripeness on bananas", Journal of Experimental Botany, 35, 1984, pp 127- 137.
- Baez-Sanudo, M., Siller-Cepeda, J., Muy-Rangel, D. and Heredia, B.J., "Extending the shelf-life of bananas with 1- methylcyclopropene and a chitosan-based edible coating, Journal of Food Science and Agriculture, 89, 2008, pp 2343- 2349.
- Castro, L.R., Vigneault, C., Charles, M.T., and Cortez, L.A.B., "Effect of cooling delay and cold chain breakage on "Santa Clara" tomato", Journal of Food Agricultural Environment, 3, 2005, pp 49-54.
- Giri, S.K., Prasad, N., and Kumar, K.K., "Lac wax based emulsion coating to extend post-harvest life of mango", Indian Food Packer, 3, 2003, pp 62-68.
- Indian Horticulture Database., Facts and Figures: National Horticulture Board (NHB), 1, 2014, pp 2-25.
- Ishaq, S., Rathore, H.A., Majeed, S., Awan S., and Shah, S.Z.A., "The studies on physico-chemical and Oraganoleptic characteristics of Apricot (Prunus armeniaca L.) produced in Rawalakot, Azad Jammu and Kashmir during storage" Pakistan Journal of Nutrition, 8 6, 2009, pp 856-860.
- Jayaraman, K.S., and Raju, P.S., "Development and evaluation of a permanganate based ethylene scrubber for extending the shelf-life of fresh fruits and vegetables" Journal of Food Science and Technology, 29 2, 1992, pp 77-83.
- Jiang, Y., Li, J., and Jiang, W., "Effects of chitosan coating on shelf-life of cold-stored litchi fruit at ambient temperature", LWT Food Science and Technology, 38, 2004, pp 757-761.
- Jiang, Y.M., and Li, Y.B., "Effect of chitosan coating on the post-harvest life and quality of longan fruit", Journal of Food Chemistry, 73 2, 2001, pp 139-143.
- Kudachikar, V.B., Kulkarni, S.G., Vasantha, M.S., Aravinda Prasad, B., and Aradhya, S.M., "Effect of modified atmosphere packaging on shelf-life and fruit quality of banana stored at low temperature" Journal of Food Science and Technology, 44, 2007, pp 74-78.
- Lin, D., and Zhao, Y., "Innovations in the development and applications of edible coatings for fresh and minimally processed fruits and vegetables", Comprehensive Reviews in Food Science and Food Safety, 6, 2007, pp 62-63.
- Lizada, M.C.C., Pantastico, E.B., Abd. Shukor, A.R. and Sabari, S.D., "Ripening of banana: changes during ripening in banana", Banana: Fruit Development, Postharvest Physiology Handling and Marketing, Abdullah, H. and Pantastico, ASEAN Food Handling Burea, Malaysia, 1990, pp 65-84.
- Ranganna, S., Handbook of Analysis and Quality Control for Fruit and Vegetable Products, Tata McGraw Hill Publishing Co. Ltd. New Delhi, 1986.
- Sarode, S.C., and Tayade, N.H., "Physio-chemical changes during ripening in "Williams, "Zeling" and Grand nain" banana" Journal of Dairying, Foods and Home Sciences, 28 3-4, 2009, pp 220-224.
- Srinivasa, P., Revathy, B., Ramesh, M., Prashanth, K.H., and Tharanthan, R., "Storage studies of mango packed using biodegradable chitosan film" European Food Research Technology, 215 6, 2002, pp 504-508.
- Suppakul, P., Miltz, J., Sonneveld, K., and Bigger, S.W., "Active packaging technologies with an emphasis on antimicrobial packaging and its applications" Journal of Food Science, 68 2, 2003, pp 408-420.
- Surendranathan. K.K., "Post-harvest biotechnology of fruits with special reference to banana-Perspective and scope" Indian Journal of Biotechnology, 4, 2005, pp 39-46.
- Suppakul, P., Miltz, J., Sonneveld, K., and Bigger, S.W., "Active packaging technologies with an emphasis on antimicrobial packaging and its applications" Journal of Food Science, 68 2, 2003, pp 408-420.
- Vermeiren, L., Devlieghere, F., Van Beest, M., De Kruijf, N., and Debevere, J., "Development in the active packaging of foods" Trends in Food Sciences and Technology, 10, 1999, pp 77-86. References
- J. Piera and J.-E. Backvall, Angew. Chem., Int. Ed., 2006, 47, 3506.
- S. I. Murahashi, N. Komiya and H. Terai, Angew. Chem., Int. Ed., 2005, 44, 6931. References
- B. Basu, S. Satapathy, and A.K. Bhatnagar, Catal. Rev. 1993, 35, 571-609
- H. Golchoubian, and F. Hosseinpoor, Catal. Commun. 2007, 8, 697-700
- I. Chatti, A. Ghorbel, P. Grange, and J. M. Colin, Catal. Today, 2002, 75, 113-117 References
- http://www.riversides.org/rainguide/riversides\_hgr.php?cat=1&p age=78&subpage=79& subpage2=
- AJMAL M., KHAN M.A. and NOMANI A.A. (1987), 'Monitoring of Heavy Metals in the Water and Sediments of the Ganga River, India', Water Science & Technology .
- ARMIENTA M. A., MORTON O., RODRIGUEZ R., CRUZ O., AGUAYO A., and CENICEROS N. (2001), 'Chromium in a tannery wastewater irrigated area, Leon Valley, Mexico', Bulletin of Environmental Contamination and Toxicology.
- AR; 1P. SUR; 1S. K. MANDAL; 2T. SAHA and R. K. KOLE, (2008) 'Assessment of heavy metal pollution in surface water', Int. J. Environ. Sci. Tech., 5 (1): 119-124,
- BEG K.R. and ALI S. (2008), 'Chemical contaminants and toxicity of Ganga River sediment from Up and Down stream area at Kanpur', American J of Environ Sci 4(4)
- CHAKRABORTY R.N., SAXENA, K.L. and KHAN, A.Q. (1965), 'Stream pollution and its effect on water supply. A report of survey, Proc. Symp. Problems in Water treatment. Oct. 29-30, Nagpur': 211-219.
- DHIRENDRA MOHAN JOSHI, NARENDRA SINGH BHANDARI, ALOK KUMAR and NAMITA AGRAWAL (2009), 'Statistical Analysis of Physicochemical Parameters of Water of River Ganga in Haridwar District', Rasayan J Chem., Vol 2(3): 579-587.
- DHIREDRNA MOHAN JOSHI (2009), 'Assessment of the irrigation water quality of river Ganga in Haridwar', district Vol.2, No.2 (2009): 285-292.
- DHIRENDRA MOHAN JOSHI, ALOK KUMAR, AND NAMITA AGRAWAL(2009), 'Studies On Physicochemical Parameters To Assess The Water Quality Of River Ganga For Drinking Purpose In Haridwar District', Rasayan J Chem Vol.2, No.1 :195-203
- EKIN BIROL A. and SUKANYA DAS (2010), 'Estimating the value of improved wastewater treatment: The case of River Ganga, India', Journal of Environmental Management 91: 2163- 2171
- KASHIPRASAD (1977), 'Survival of Coliform organism in river Ganga water near Kanpur and applicability of water quality indices. M. Tech. Thesis, Department of Civil Engineering, IIT, Kanpur, India'.
- KHWAJA A.R., SINGH RASHMI, TANDON S.N. (2001), 'Dept Chem, Univ Roorkee, Roorkee', a case study. Environ Monit Assess, 68(1) : 19-35.
- KUMARI M., TRIPATHI S., PATHAK V. and TRIPATHI B.D. 'Chemometric characterization of river water quality', Environ Monit Assess. 2013 Apr;185(4): 3081-92
- KUNWAR P. SINGH, DINESH MOHAN, SARITA SINHA and R. DALWANI (2004), 'Impact assessment of treated/untreated wastewater toxicants discharged by sewage treatment plants on health, agricultural, and environmental quality in the wastewater disposal area (Elsevier) Chemosphere', 55: 227-255.
- MADHAB BORAH ET AL (2011), 'Study of some Physico- Chemical Parameters of Pond and River water with reference to Correlation Study', International Journal of Chem Tech ResearchVol.3, No.4:1802-1807,
- MAHESHWARI et al. (2011), 'Hydro Chemical Analysis of Surface and Ground Water Quality of Yamuna River at Agra, India', J. Mater. Environ. Sci. 2 (4) 373-378.
- MEHROTRA M.N. (1990), 'The role of sediments in environmental pollution: A case study of the Ganga at Varanasi', Jour. of the Ind. Association of Sedimentologists.
- NIKHIL GARG, NEERAJ MATHUR, D. P. MODAK, K. P. SINGH, R. C. MURTHY, SHAKEEL AHMED, S. V. CHANDRA and P. K. RAY(1992), 'Trace metals trend analysis in river Ganges at Kanpur', Environment International: 297-305
- N.R. PRASAD and J.M. PATIL (2008), 'A study of physico- chemical parameters of Krishna River water particularly in Western Maharashtra', Rasayan J. Chem.1 (4): 943-958
- PAHWA D.V. and S.N. MEHROTRA, (1966), 'Observation on fluctuations in the abundance of plankton in. relation to certain hydrological condition of river Ganga. Proc. Nat. Acad. Sci. India', 36(2): 187-189
- PANDEY P.K. & PANDEY (1980), 'Physico-Chemical Characteristics of River Ganga at Kanpur', J. INST. ENG. INDIA. Vol. 61, no. Pt. En 1: 28-30.
- RAI et al. P. K. RAI, MISHRA and B. D. TRIPATHI (2012), 'Heavy metal and microbial pollution the River Ganga: A case study of water quality at Varanasi', Aquatic Ecosystem Health and Management 13 : 352-361.
- REETA JOHRI (2011),'Study of the comparative physico-chemical analysis of potable and polluted Ganga river water at Kanpur in reference to the tannery effluents discharged in the river', J. Exp. Zool. India Vol. 14, No. 2: 403-409.
- SANDEEP ARYA and RICHA GUPTA (2013), 'Water Quality Evaluation of Ganga River from Up to Downstream Area at Kanpur City', J. Chem. & Chem. Sci. Vol.3 (2): 54-63.
- SHASHWAT KATIYAR (2011), 'Impact of tannery effluent with special reference to seasonal variation on Physico-chemical characteristics of river water at Kanpur (U.P), India', Katiyar, J Environment Analytic Toxicol.
- SINGH, A. K. & TIWARI, R. K. (2009), 'Physico chemical characteristics of Ganga river water at Varanasi', Journal of Ecobiology Vol. 25 No. 1
- SINGH NAMRATA (2010), 'Physicochemical properties of polluted water of river Ganga at Varanasi', International Journal Of Energy And Environment Volume 1, Issue 5:823-832.
- SUJEET KUMAR, P.K. MISHRA, NAND LAL SINGH, K.K.SINGH and PRADEEP SRIVASTAVA (2012), 'Water Quality of River Varuna in Varanasi City, Uttar Pradesh India',
- TIWARI R.K, RAJAK GP, ABHISHEK, MONDAL MR (2005),' Water quality assessment of Ganga river in Bihar Region', India J Environ Sci Eng. Oct;47(4): 326-35
- TRIPATHI B.D. and SIKANDARM.(1991), 'Physico-chemical characterization of city sewage discharged into River Ganga at Varanasi, India', Environment International,Vol-17 : 469-478
- TRIVEDI PRIYANKA, BAJPAI AMITA and THAREJA SUKARMA (2010), 'Comparative Study of Seasonal Variation in Physico-Chemical Characteristics in Drinking Water Quality of Kanpur', Nature and Science.2010:8(4): 11-17.
- ZAFER A. and SULTANA N. (2007), 'Seasonal Analysis in the Water Quality of River Ganga', Disaster Ecology and Environment Arvind Kumar (Ed.) Daya publishing House, India: 57-62.
- Rojas, S.S., De Souza, J.E., Yukimitu, K., Hernandes A.C. Structural, thermal and optical properties of CaBO and CaLiBO glasses doped with Eu 3 + . Journal of Non-Crystalline Solids. 398-399 (2014) 57-61.
- Swamy, B.J.R., Bhaskar Sanyal, Gandhi, Y., Kadam, R.M., Nata Rajan, V., Raghava
- Rao, P., & Veeraiah, N. Thermoluminescence study of MnO doped borophosphate glass samples for radiation dosimetry. Journal of Non-Crystalline Solids. 368 (2013) 40-44.
- I. Hossain, N. K. Shekaili, H. Wagiran, Thermoluminescence Response of Copper-Doped Potassium Borate Glass Subjected to 6 Megavolt X-Ray Irradiation. Journal of App. Spectr., 82(1) (2015) 149-152.
- Tengku Kamarul Bahri, T.N.H., Wagiran, H., Hussin, R., Hossain, I., & Kadni, T. Thermoluminescence properties of CaO-B 2 O 3 glass system doped with GeO 2 . Radiation Physics and Chemistry. 102 (2014) 103-107.
- Haydar Aboud, Wagiran, H., Hussin, R., Hassan Ali, Yasser Alajerami, & Saeed. M.A. Thermoluminescence properties of the Cu-doped lithium potassium borate glass. Applied Radiation and Isotopes. 90 (2014) 35-39.
- Yan Zhang, Chunhua Lu, Liyan Sun, Zhongzi Xu, & Yaru Ni. Influence of Sm 2 O 3 on the crystallization and luminescence properties of boroaluminosilicate glasses. Materials Research Bulletin. 44 (2009) 179.
- Rao, T.V.R., Reddy, R.R., Nazeer Ahammed, Y., & Parandamaiah, M. Luminescence propertiesof Nd 3+ , TeO 2 - B 2 O 3 -P 2 O 5 -Li 2 O glass. Infrared Physics & Technology. 41 (2000) 247.
- Annapurna, K., Das, M., Kundu, M., Dwivedhi, R.N., & S. Buddhudu. Journal of Molecular Structure. 741(2005) 53.
- Lee, J. D. Concise inorganic chemistry. (Blackwell science, Oxford) (1996).
- Chialanza, M.R., Castiglioni, J., & Fornaro, L. Crystallization as a way for inducing thermoluminescence in a lead borate glass. Journal of Materials Science. 47 (2012) 2339.
- Szumera, M., & Walawska, I. Thermal study of Mn-containing silicate-phosphate glasses. Journal of Thermal Analysis and 108 (2012) 583.
- Magdalyna Ignatovych, Mauro Fasoli, & Andras Kelemen. Thermoluminescence study of Cu, Ag and Mn doped lithium tetraborate single crystals and glasses. Radiation Physics and Chemistry. 81 (2012) 1528.
- Kipke, A., & Hofmeister, H. Formation of silver nanoparticles in low-alkali borosilicate glass via silver oxide intermediates. Materials Chemistry and Physics. 111 (2008) 254.
- Schulman, J.H., Kirk, R.D., & West, E.J. Use of lithium borate for thermo-luminescence dosimetry. In: Proceedings of the International Conference on Luminescence Dosimetry. Conf:650637.25 (1965) 113-117.
- Hashim, S., Alajerami, Y.S.M., Ramli, A.T., Ghoshal, S.K., Saleh, M.A., & Abdul Kadir, A.B. Thermoluminescence dosimetry properties and kinetic parameters of lithium potassium borate glass co-doped with titanium and magnesium oxides. Applied Radiation and Isotopes. 91 (2014) 126-130.
- Tajuddin, Hamiza Ahmad., Wagiran, Husin., & Husin, Rosli. The Thermoluminescence response of Dy Doped Calcium Borate Glass subjected to 6MV photon irradiation. Advanced Materials Research. 895 (2014) 390.
- Kutub, A.A., Elmanhawaawy, M.S., & Babateen, M.O. Studies on gamma-irradiated sodium tetraborate glasses containing ytterbium. Solid State Science and Technology. 15 (2007) 191.
- Subanakov, A., Bazarova, Zh., Nepomnyshchikh, A., Perevalov, A., & Bazarov, B. Synthesis and characterization of dysprosium- doped magnesium tetraborate. Inorganic Materials. 50(5) (2014) 485.
- Swamy, B.J.R.S., Bhaskar Sanyal, Vijay, R., Rameshbabu, P., KrishnaRao, D., & Veeraiah N. Influence of copper ions on thermoluminescence characteristics of CaF 2 -B 2 O 3 -P 2 O 5 glass system. Ceramics International. 40, (2014) 3707-3713.
- Mady, F., Benabdesselam, M., & Blanc, W. Thermoluminescence characterization of traps involved in the photo darkening of ytterbium-doped silica fibers. Optical Letters. 35(21) (2010) 3541-3543.
- Paul, A. Chemistry of glasses. London: Chapman & Hall. (1982).
- Elliot, S.R. Physics of amorphous materials. London: Longman. (1990).
- Shackl Ford, J. F. Introduction to Materials Science for Engineers. New York: Macmillan. (1985).
- Dietzel A. Glass structure and glass properties. Glasstech Ber. 22 (1968) 41-50.
- Hruby, A. Evaluation of glass-forming tendency by means of DTA. Czechoslovak Journal of Physics B. 22(11) (1972) 1187-1193.
- Tandon, R.P., & Hotchandani, S. Electrical conductivity of semiconducting tungsten oxide glasses. Physica Status Solidi (a).185 (2001) 453-460.
- Hong-Hua QIU, Hidetsugu MORI, Hironobu SAKATA, & Toru HIRAYAMA. Electrical conduction of glasses in the system Fe 2 O 3 -Sb 2 O 3 -TeO 2 . Journal of Ceramic Society of Japan, 103(1) (1995) 32-38.
- Khalifa, F.A., El Batal, H.A., & Azooz, A. Infrared absorption spectra of gamma irradiated glasses of the system Li 2 O-B 2 O 3 - Al 2 O 3 . Indian Journal of Pure & Applied Physics. 36(6) (1998) 314-318.
- J. Anjaiah and C. Laxmikanth Journal of Basic and Applied Engineering Research p-ISSN: 2350-0077; e-ISSN: 2350-0255; Volume 2, Number 17; July-September, 2015 1548
- Ahmed, A.A., Abd ElShafi, N., & ElTohamy, M. R. Infrared study of glasses in the system B 2 O 3 -PbO-CuO in relation to their structure. Indian Journal of Pure & Applied Physics. 36 (1998) 335-341.
- Subbalakshmi, P., & Veeraiah, N. Influence of WO 3 on dielectric properties of zinc phosphate glasses. Indian Journal of Engineering & Materials Sciences. 8 (2001) 275-284.
- Karthikeyan, B., Mohan, S., & Baesso, M.L. Spectroscopic and glass transition studies on Nd 3+ -doped sodium zincborate glasses. Physica B 337 (2003) 249- 254.
- Chen, R. On the calculation of activation energies and frequency factors from glow curves. Journal of Applied Physics. 40 (1969) 570-585.
- Gartia, R.K., Rey, L., Tejkumar Singh, Th., & Basanta Singh, Th. Thermoluminescence of alkali halides and its implications. Nuclear Instruments and Methods in Physics Research Section B: Beam Interactions with Materials and Atoms. 274 (2012) 129-134.
- Anjaiah, J., Laxmikanth, C., & Kistaiah, P. Effect of rare-earth ions on the thermoluminescence properties of lithium borate glasses. International Journal of Emerging Technologies and Applications in Engineering Technology and Sciences. 4(1) (2011) 214-221.
- Pontusuchka, W.M., Isotani, S., & Piccini, A. Optical and thermal bleaching of x-irradiated barium aluminoborate glasses. The American Ceramic Society. 70(I) (1987) 59-64.
- Del Nery, S.M., Pontusuchka, W.M., Isotani, S., & Rouse, C.G. Luminescence quenching by iron in barium aluminoborate glasses. Physical Review B. 49 (1994) 3760.
- da Rocha, M.S.F., Pontusuchka, W.M., & Blak, A.R. Radiation induced capacitance in barium aluminaborate glasses. Journal of Non-Crystalline Solids. 321 (2003) 29.
- Van Der Ziel, A. Solid State Physics Electronics. New Delhi: Prentice-Hall of India. (1971).
- Mohammad Rais, Shatroopa Acharya and Gary W. Vanloon; Food Processing Industry: Opportunities in North East Region of India; The Nehu Journal, Vol xii, No. 1, January -June 2014.
- Government of India, Ministry Of Food Processing Industries, APEDA; Report on Export Potential of Horticultural Products from North-Eastern States (2004-2005).
- John K.M. Kuwornu, Abdulai A. Nafeo and Yaw B. Osei-Asare; Financial Viability, Value Addition and Constraint Analyses of Certified Organic Pineapple Production and Marketing in Ghana; African Journal of Basic & Applied Sciences 5 (1): 12- 24, 2013.
- Economic Survey of Assam; 2012-2013.
- ONICRA Credit Rating Agency of India Ltd.; Food Processing Industry in India. Vivek Kr. Pathak, Hirak Chakraborty and K.M Pandey Journal of Basic and Applied Engineering Research p-ISSN: 2350-0077; e-ISSN: 2350-0255; Volume 2, Number 17; July-September, 2015 1554
- Department of Horticulture, Government of Assam; Horti Vision 2020.
- The Indian Chamber Of Commerce; India"s North-East - Diversifying Growth Opportunities; 2013.
- http://www.livemint.com/Politics/rKB1eUHQQpUOuZ9WvnKc zJ/Cold-storage-Demand-supply-gap-at-3683-mt-says- study.html accessed on 25th of February 2015.
- Last 3 years Annual Reports of MoFPI, NERAMAC, NHB, APEDA, NCCD.