Association for Institutional Research Supporting quality data and decisions for higher education. Professional Development, Informational Resources & Networking Tuition Revenues and Enrollment Demand: The Case of (original) (raw)
Abstract
This paper details our experience with successfully increasing tuition revenues at Southern Utah University and provides a case study in how economic research and the politics of tuition policy combined to increase university revenue with stakeholder buy-in. Our success was based on three key factors: (a) we had a key administrator who advocated economic modeling and a positive basis for tuition policy; (b) we obtained empirical evidence of the effects of the proposed tuition increase by estimating an enrollment demand model; and (c) we were able to obtain stakeholder buy-in. Following the largest tuition increase in over 30 years, enrollment growth has remained strong and revenues have increased.
Figures (8)
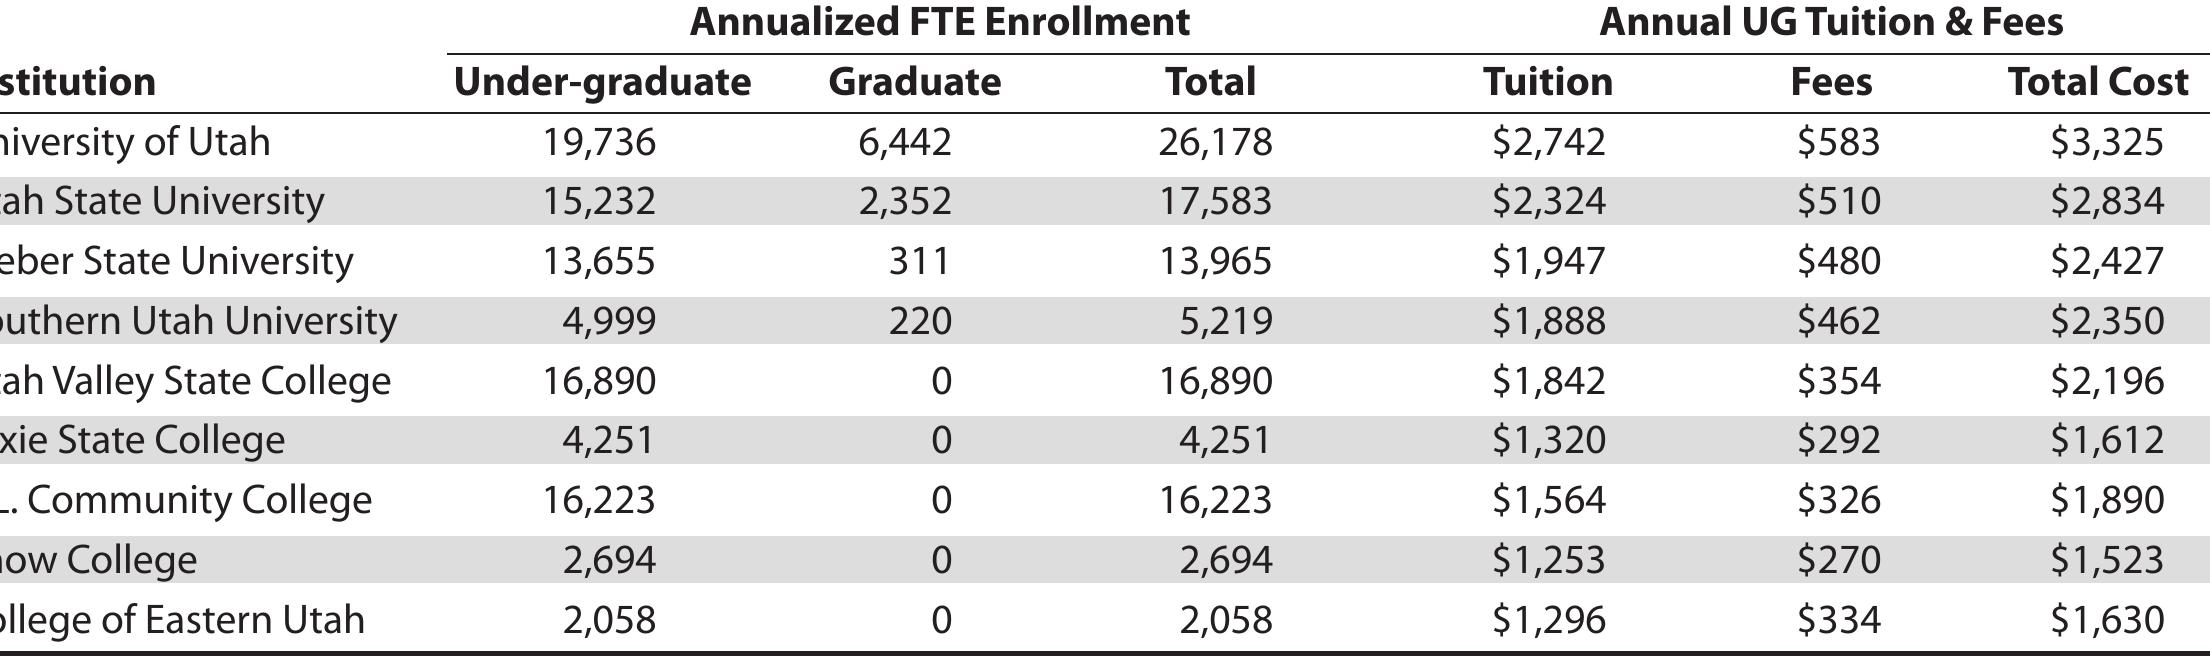
Notes: Undergraduate enrollment data includes vocational students; graduate enrollment data includes medical students at the University of Utah. Tuition and fee figures are for full-time (15 credit hours) undergraduate state residents, for two semesters. Cxsciwmns Phe Cortanwnce t Bache Didicwntiiancan SAS BARA inde Decl Utah System of Higher Education Statistical Comparison, 2002-03 Table 1 'The Carnegie Basic Classification states: “Master’s program size was based on the number of master’s degrees awarded in 2003-04. Those awarding at least 200 degrees were included among larger programs; those awarding 100-199 were included among medium programs; and those awarding 50-99 were included among smaller programs.’ Retrieved from http://www. carnegiefoundation.org/classifications/index.asp?key=798
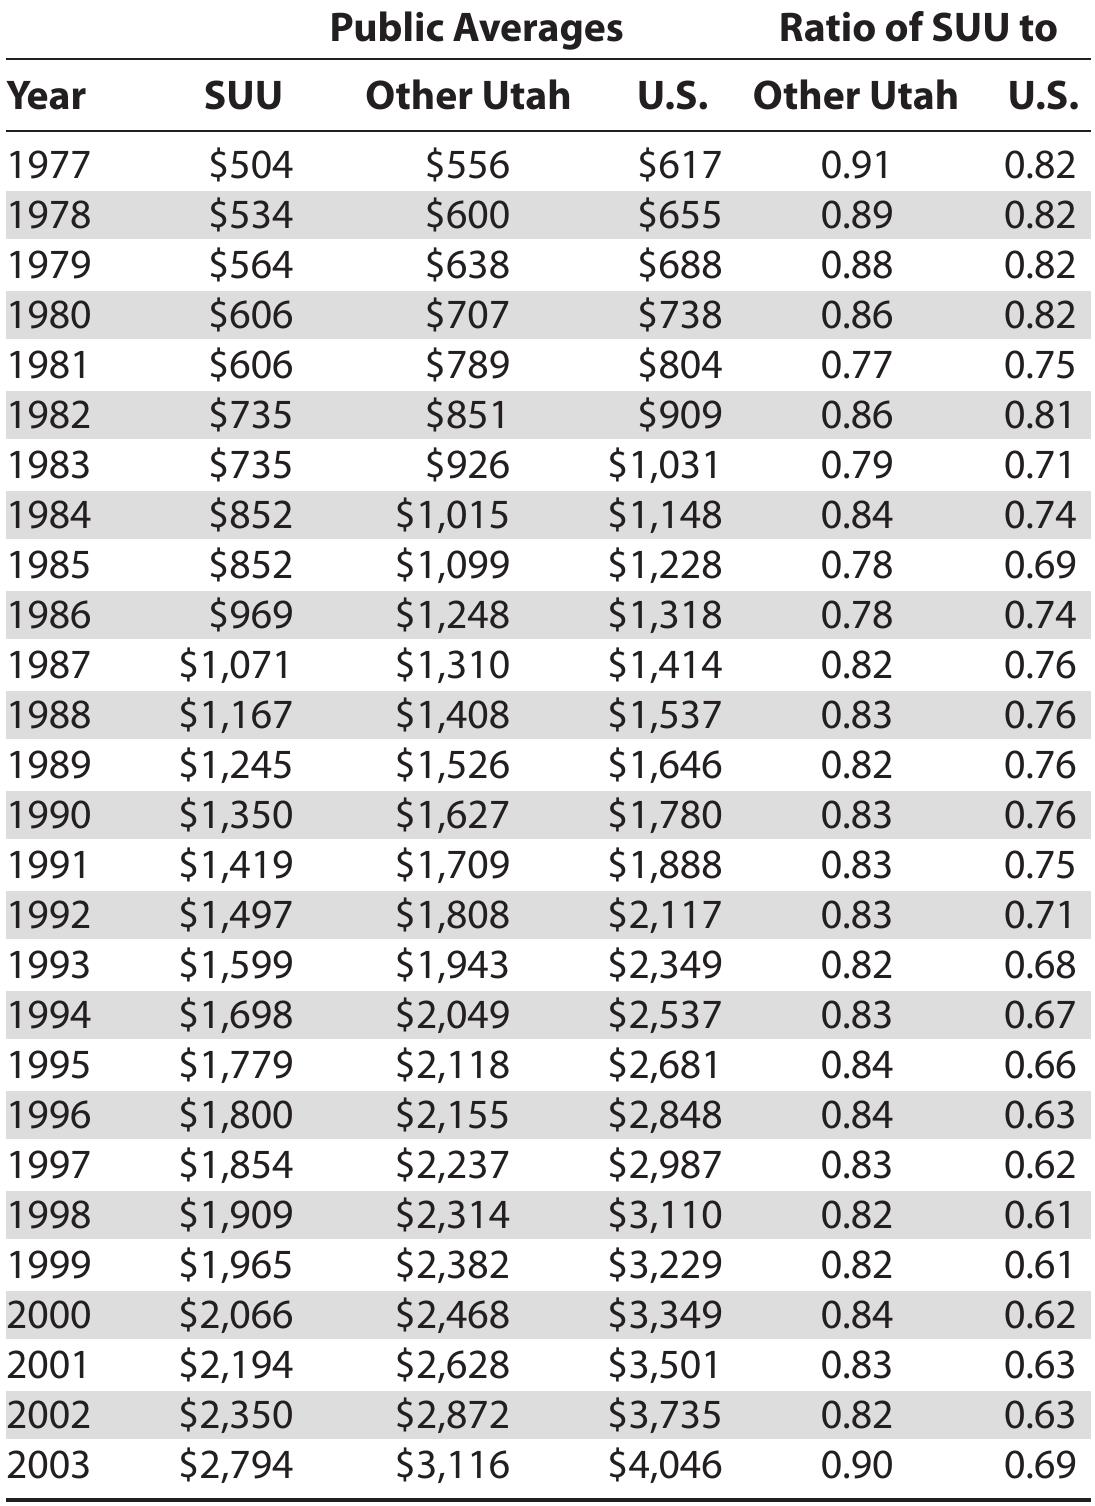
Historical Tuition and Fees: SUU, Other Utah Four-Year Institutions, and U.S. Public Four-Year Institutions
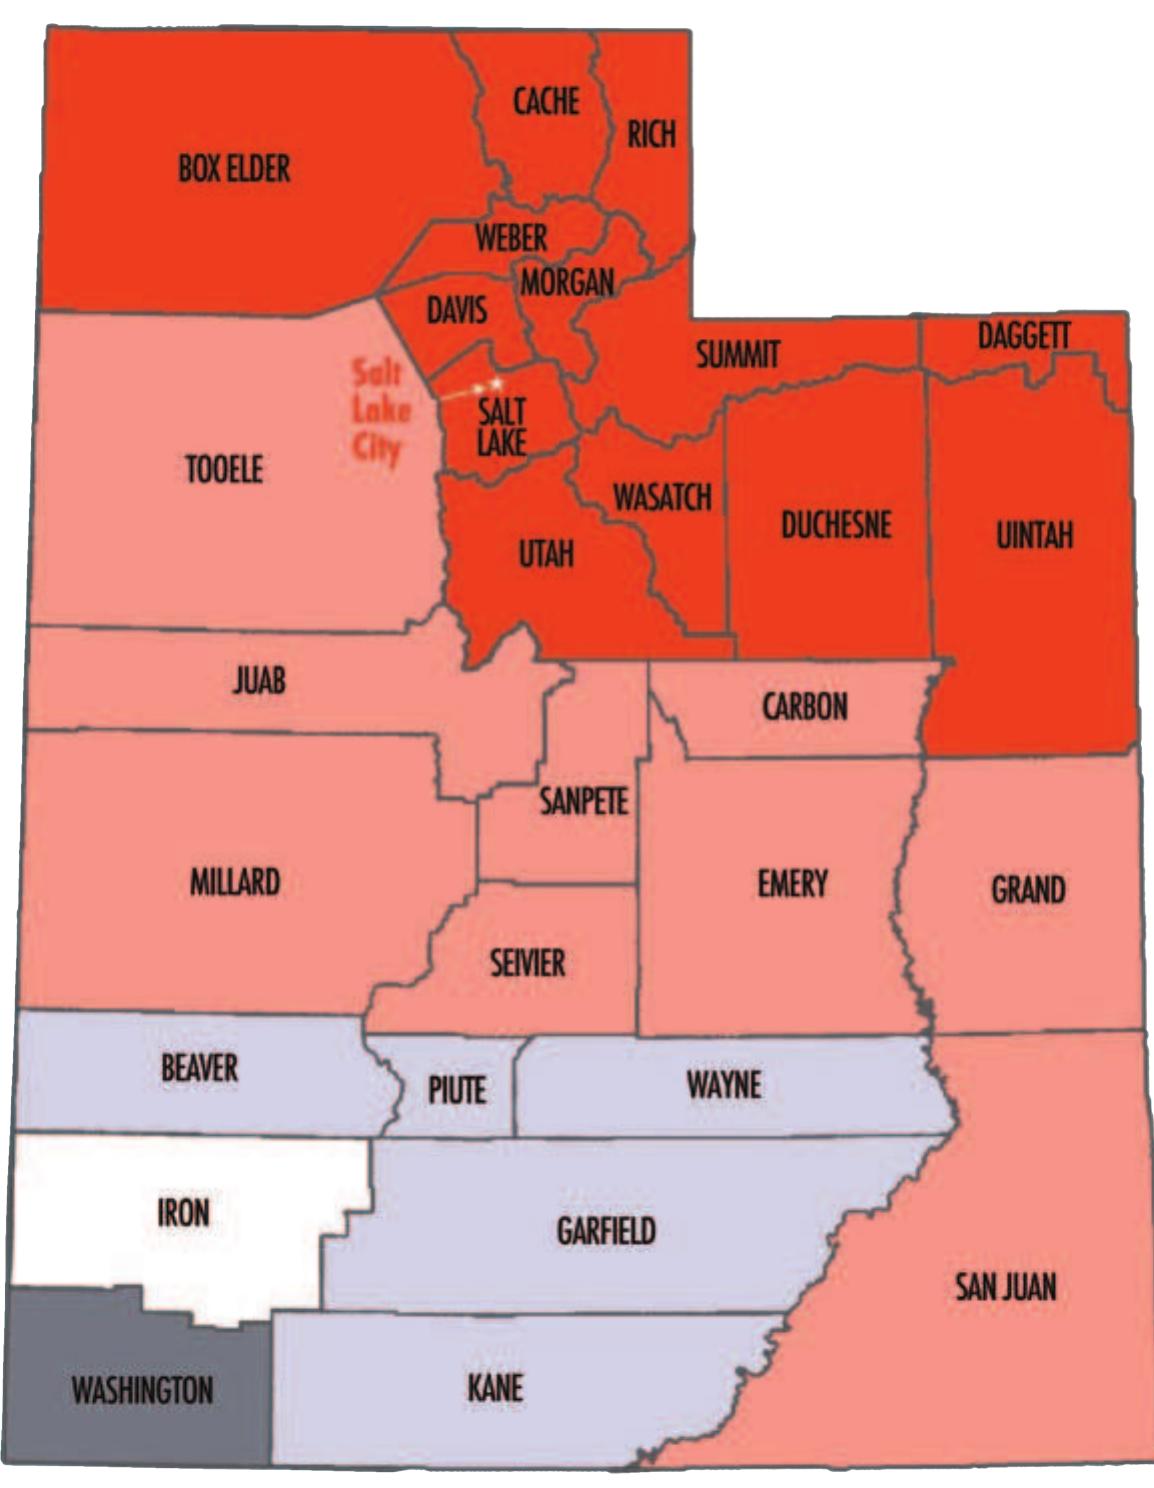
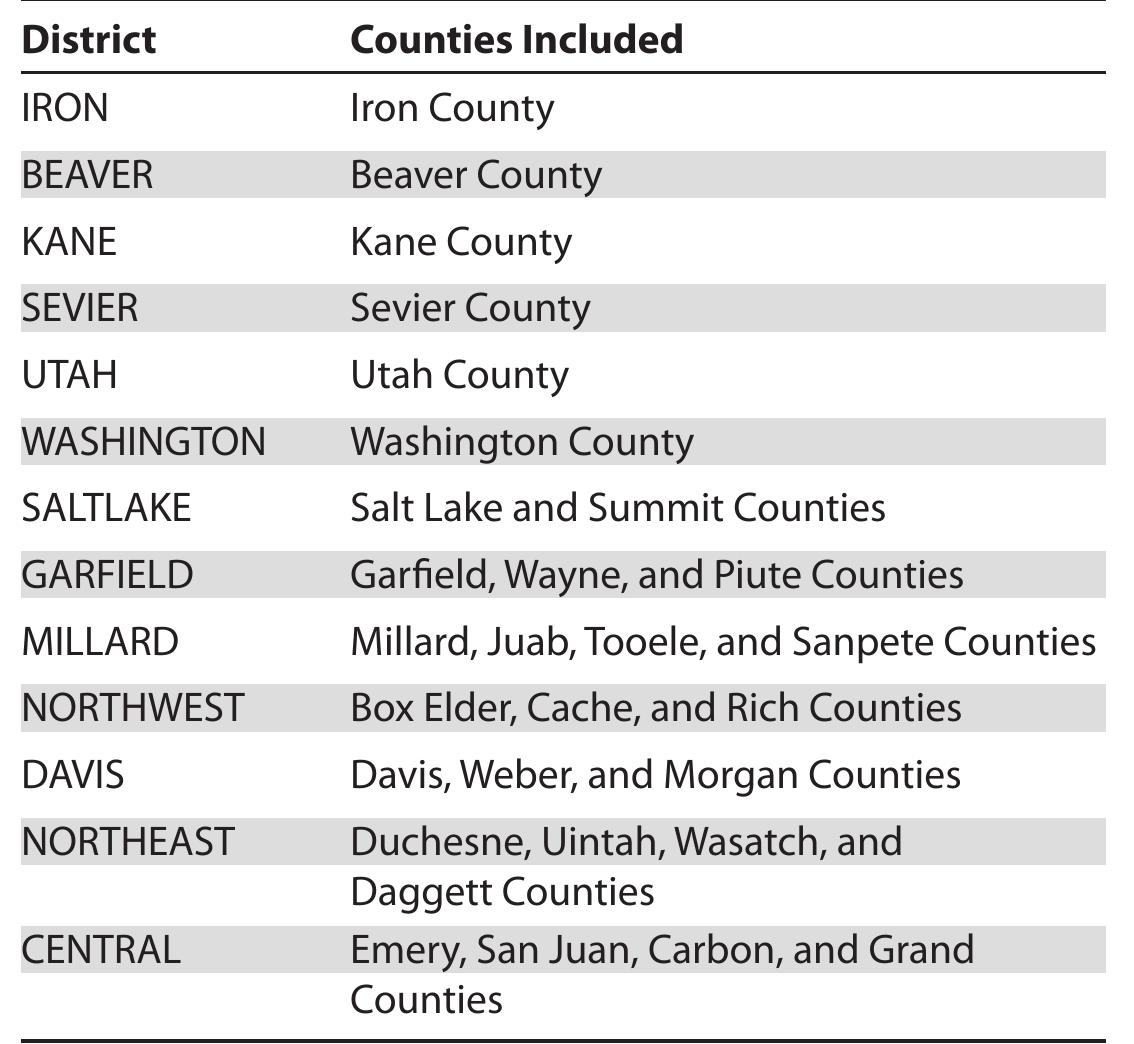
Figure 1. Utah counties and regions defined for analysis. '2When the demand for a good decreases with increases in income, the good is called inferior by economists; in contrast, nor goods are those for which demand increases with increases in income. '3 Frequently, two time-series variables can appear to be more closely related than they actually are simply because both trend over time for extraneous reasons; thus, time-trend variables are often included in econometric analyses to control for these kinds of spurious relationships (Wooldridge, 2006, pp. 363-369). Other types of trend relationships were considered but were rejected empirically. “ Enrollment data were obtained from SUU’s provost office. County unemployment rates were collected from the Utah State Governor's Office of Planning and Budget. Per capita personal income figures came from the Bureau of Economic Analysis. Link ecrhaal anradiiatac data wuinra tah latad picinn infarmatinn fram tha | leah Ceatan N\fGran anf Edhicatinn | Indararads ata tiitian
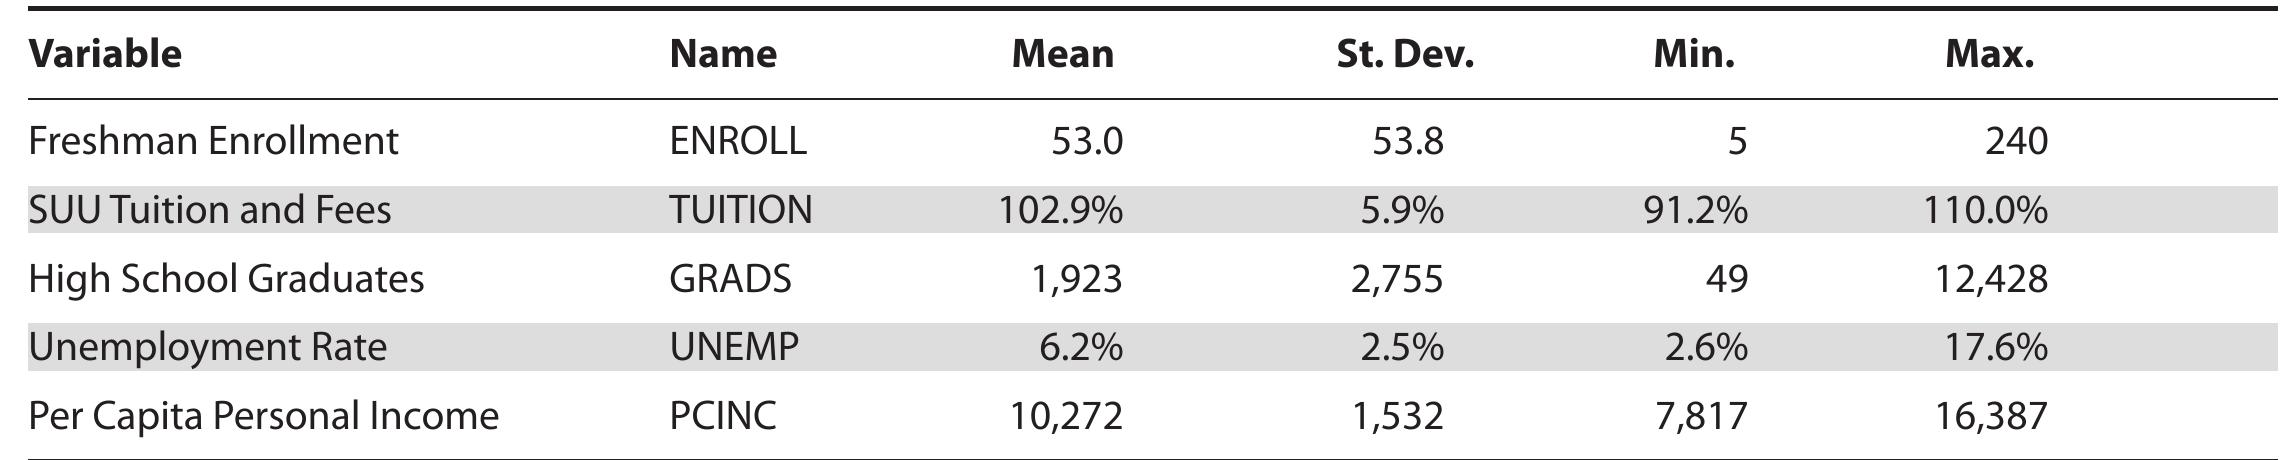
Descriptive Statistics for Quantitative Variables Notes: Variables are in level form; statistics are based on 299 observations, across all time periods and cross sections; PCINC is deflated by the CPI, 1982-84 = 100; average SUU tuition & fees over the time period were $1,405 (nominal). Table 4
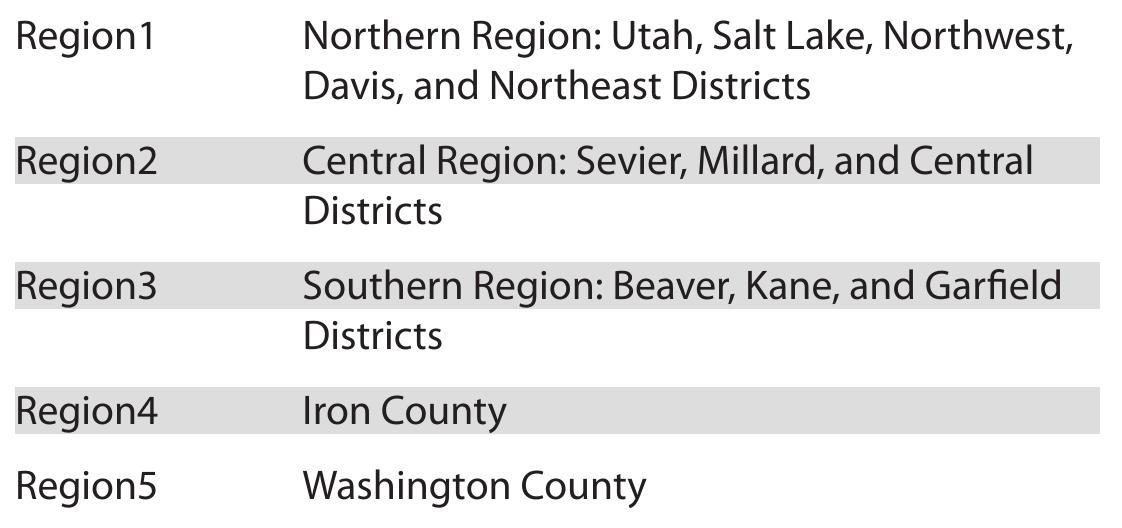
Utah Regions
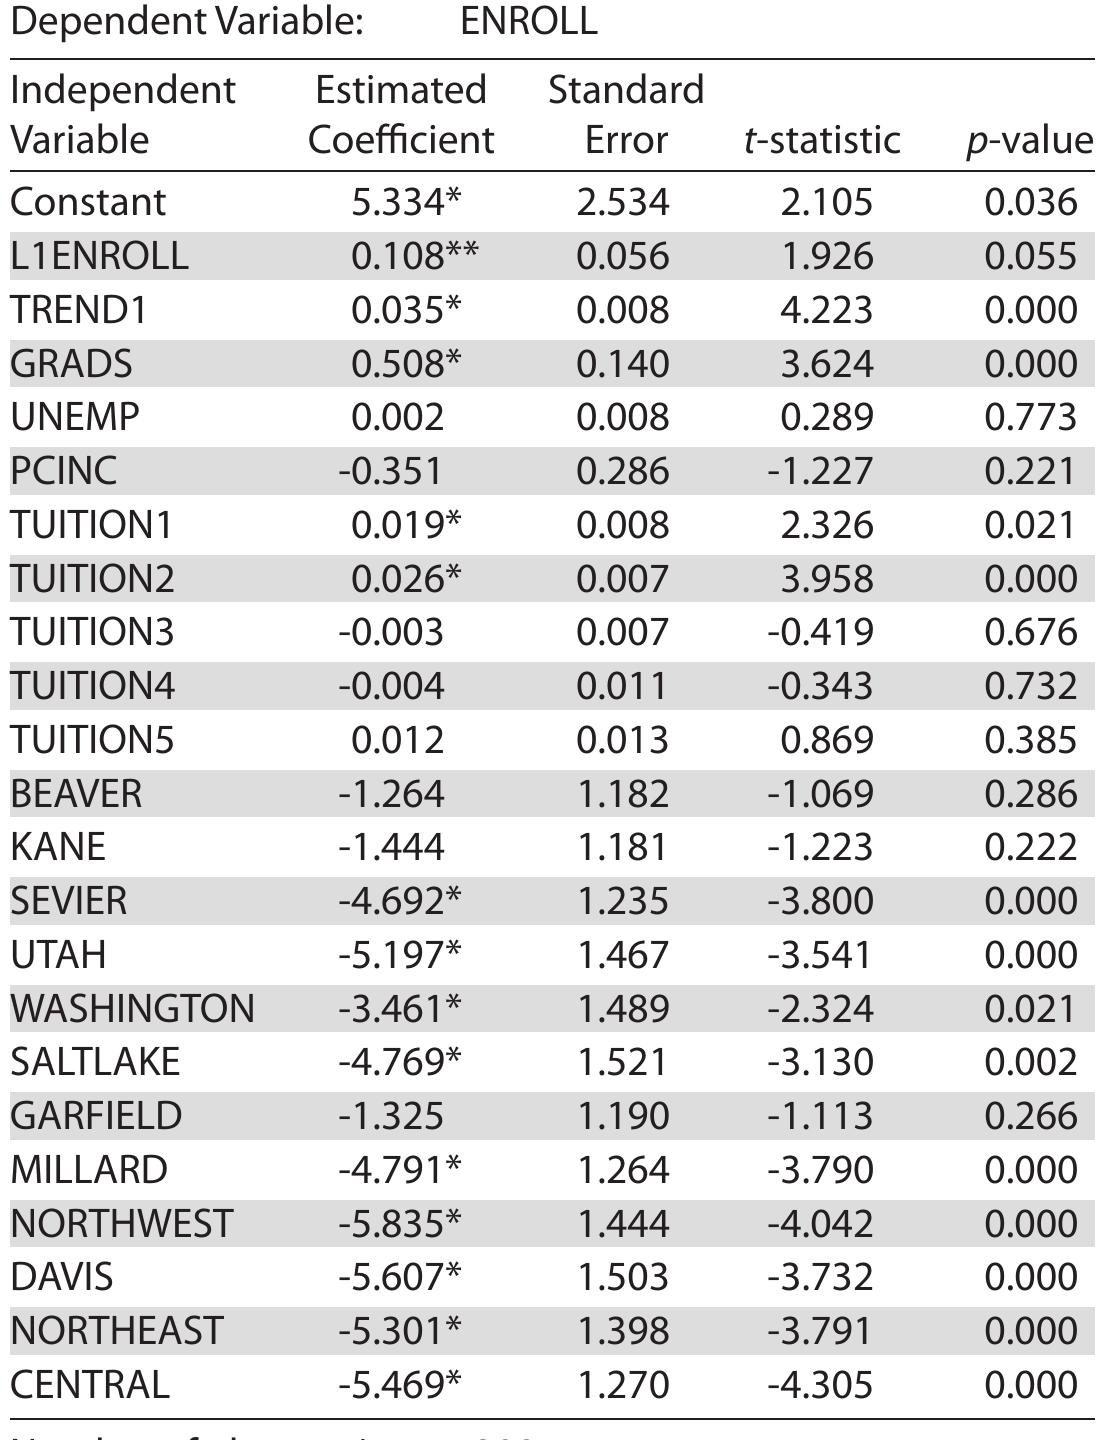
Table 7 * significant at the 5% significance level; ** significant at the 10% significance level '? Because both the dependent variable and the independent variable in question appear in natural log form, the coefficient o! the (logged) independent variable can be interpreted as the percentage change in the untransformed value of the dependent variable associated with a 1% change in the untransformed value of the independent variable. In t his case, if the coefficient associated with the GRADS variable is less than one, and assuming the number of high school graduates is generally increasin¢ over time, it implies the percentage of high school graduates enrolling at SUU is declining over time. ?° In an alternative regression model that allowed for interaction terms between the GRADS variab e and regional dummy variables, it was discovered that the effects of high school graduates is near zero in lron County, where SUU is located. Thus, after controlling for other factors, changes in Iron County high school graduates have little impact on the number of SUU enrollments from Iron County. Since the county has been growing steadily, it appears that SU immediate area. U is doing poorly in its 21\Nith a loqqed danendent variahle coefficiante accociated with diirmmy variahlec reflect the nercentaqe differanca

Loading Preview
Sorry, preview is currently unavailable. You can download the paper by clicking the button above.
References (21)
- Abraham, K., & Clark, M. (2006). Financial aid and students' college decisions evidence from the District of Columbia Tuition Assistance Grant Program. The Journal of Human Resources, 41, 578-610.
- Baye, M. R. (2006). Managerial economics and business strategy (5 th ed.). New York: McGraw- Hill/Irwin.
- Becker, W. E. (1990). The demand for higher education. In S. A. Hoenack, & E. L. Collins (Eds.), The economics of American universities: Management, operations, and fiscal environment (pp. 155-188). Albany, NY: State University of New York Press.
- Buss, C., Parker, J., & Rivenburg, J. (2003). Cost, quality and enrollment demand at liberal arts colleges. Economics of Education Review, 23, 57-65.
- Campbell, R., & Siegel, B. N. (1967). The demand for higher education in the United States 1919- 1964. American Economic Review, 57, 482-494.
- Chressanthis, G. A. (1986). The impacts of tuition rate changes on college undergraduate head counts and credit hours over time-A case study. Economics of Education Review, 5, 205- 217.
- Fredriksson, P. (1999). Economic incentives and the demand for higher education. Scandinavian Journal of Economics, 99, 129-142.
- Gallet, C. (2007). A comparative analysis of the demand for higher education: Results from a meta-analysis of elasticities. Economics Bulletin, 9, 1-14.
- Hearn, J. C., & Longanecker, D. (1985). Enrollment effects of alternative postsecondary pricing policies. Journal of Higher Education, 56, 485- 508.
- Heller, D. E. (1997). Student price response in higher education: An update to Leslie and Brinkman. Journal of Higher Education, 68, 624-659.
- Heller, D. E. (1999). The effects of tuition and state financial aid on public college enrollment. The Review of Higher Education, 23, 65-89.
- Kennedy, P. (2003). A guide to econometrics (5 th ed.). Cambridge, MA: The MIT Press.
- Leslie, L. L., & Brinkman, P. T. (1987). Student price response in higher education: The student demand studies. Journal of Higher Education, 58, 181-204.
- Mankiw, N. G. (2007). Principles of economics (4 th ed.). Mason, OH: Thomson South-Western.
- McPherson, M. S., & Shapiro, M. O. (1991). Does student aid affect college enrollment? New evidence on a persistent controversy. American Economic Review, 81, 309-318.
- Mueller, R. E., & Rockerbie, D. (2004). Determining demand for higher education in Ontario by type of student. Economics of Education Review, 24, 469-483.
- National Center for Education Statistics. (2007). Digest of education statistics 2007. Washington, DC: U.S. Department of Education.
- Rao, A. R., & Monroe, K. B. (1989). The effect of price, brand name, and store name on buyers' perceptions of product quality: An integrative review. Journal of Marketing Research, 26, 351- 357.
- Studenmund, A. H. (2006). Using econometrics: A practical guide (5 th ed.). Boston: Pearson/ Addison-Wesley.
- Wetzel, J., O'Toole, D., & Peterson, S. (1998). An analysis of student enrollment demand. Economics of Education Review, 17, 47-54.
- Wooldridge, J. M. (2006). Introductory econometrics: A modern approach (3 rd ed.). Mason, OH: Thomson South-Western.