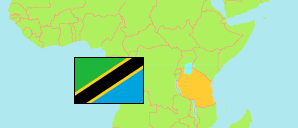
Dar es Salaam (Region, Tanzania) (original) (raw)
Region in Tanzania
Contents: Subdivision
The population development in Dar es Salaam as well as related information and services (Wikipedia, Google, images).
The icon links to further information about a selected division including its population structure (gender, urbanization, age groups, age distribution).
| Name | Status | PopulationCensus1988-08-27 | PopulationCensus2002-08-01 | PopulationCensus2012-08-26 | PopulationCensus2022-08-23 | |
|---|---|---|---|---|---|---|
| Dar es Salaam | Region | 1,360,850 | 2,487,288 | 4,364,541 | 5,383,728 | |
| Dar es Salaam City (Ilala Municipal) | City | 331,663 | 634,924 | 1,220,611 | 1,649,912 | → |
| Kigamboni Municipal (← Temeke Municipal) | Municipality | ... | ... | 162,932 | 317,902 | → |
| Kinondoni Municipal | Municipality | ... | ... | 929,681 | 982,328 | → |
| Temeke Municipal | Municipality | ... | ... | 1,205,949 | 1,346,674 | → |
| Ubungo Municipal (← Kinondoni Municipal) | Municipality | ... | ... | 845,368 | 1,086,912 | → |
| Tanzania | United Republic | 23,174,336 | 34,443,603 | 44,928,923 | 61,741,120 |
Source: National Bureau of Statistics Tanzania.
Explanation: Area figures of districts are calculated from geospatial data.
Further information about the population structure:
| Gender (C 2022) | |
|---|---|
| Males | 2,600,018 |
| Females | 2,783,710 |
| Urbanization (C 2022) | |
|---|---|
| Urban | 5,383,728 |
| Age Groups (C 2022) | |
|---|---|
| 0-14 years | 1,694,098 |
| 15-64 years | 3,559,268 |
| 65+ years | 130,362 |
| Age Distribution (C 2022) | |
|---|---|
| 80+ years | 25,755 |
| 70-79 years | 55,944 |
| 60-69 years | 129,853 |
| 50-59 years | 267,613 |
| 40-49 years | 539,362 |
| 30-39 years | 877,905 |
| 20-29 years | 1,262,924 |
| 10-19 years | 1,021,230 |
| 0-9 years | 1,203,142 |
