# Your Gateway to NASA 
Earth Observation Data | NASA Earthdata (original) (raw)

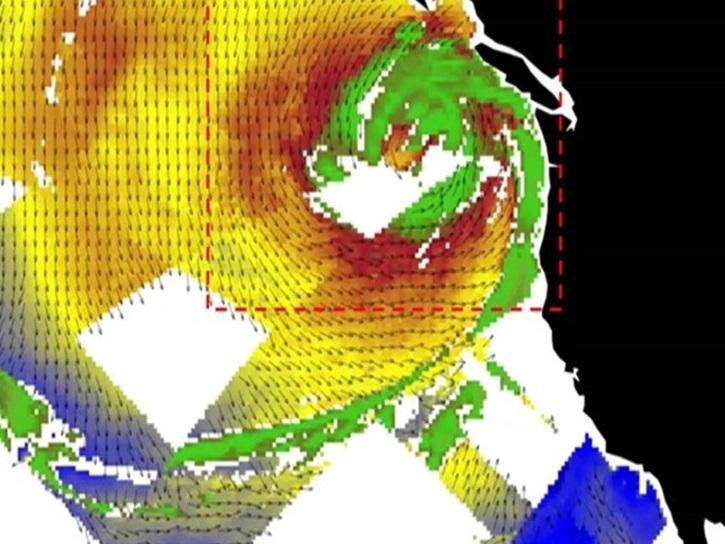
A visualization of COWVR wind speed and direction data during a bomb cyclone in November 2024.

The Compact Ocean Wind Vector Radiometer (COWVR) and Temporal Experiment for Storms and Tropical Systems (TEMPEST) datasets are the first from the Space Test Program - Houston 8 (STP-H8) mission that aims to test low-cost, light-weight instruments designed for weather applications.

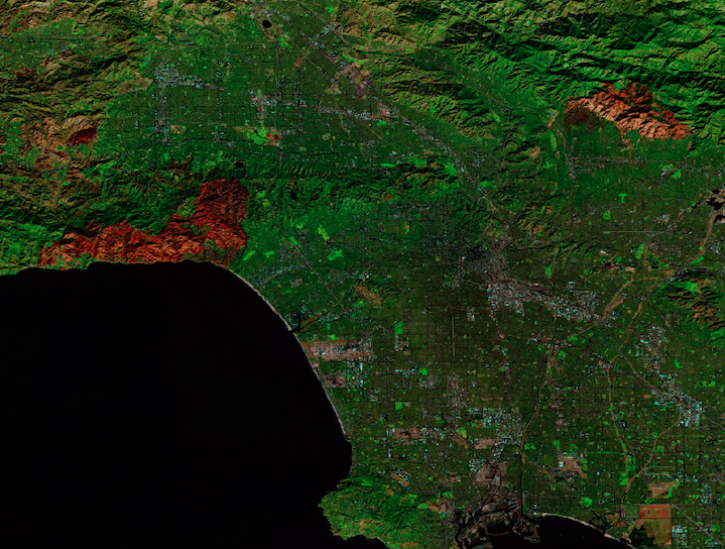
False-color corrected reflectance image of the Palisades and Eaton Fires in Los Angeles, California on 12 January 2025 from the MSI instrument aboard the Sentinel-2A satellite

Worldview Image of the Week

Image captured on Jan 12, 2025, by the MSI instrument aboard ESA's Sentinel-2A platform.

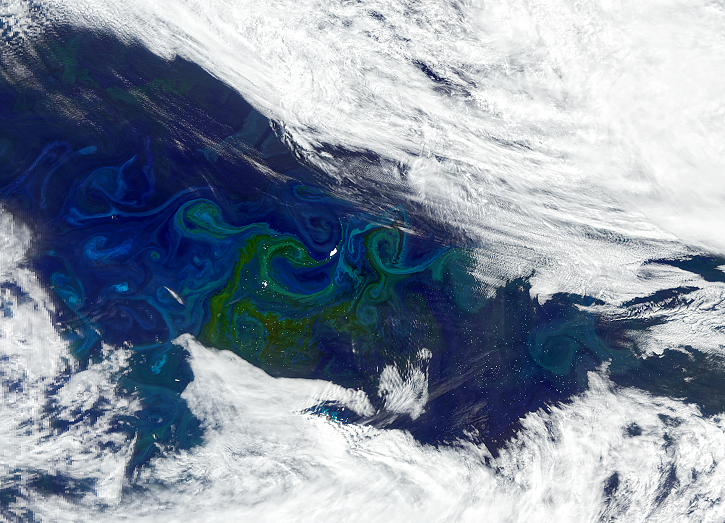
Icebergs circulate in the South Atlantic Ocean currents near the island of South Georgia. Around them, phytoplankton is blooming, creating large green-tinted swirls in this NASA Plankton, Aerosol, Cloud, ocean Ecosystem (PACE) Ocean Color Instrument (OCI) acquired on January 5, 2025.

The Help Hub hosted by NASA's Ocean Biology Distributed Active Archive Center (OB.DAAC) has been updated with new learning resources for processing ocean color satellite data, working with Plankton, Aerosol, Cloud, ocean Ecosystem (PACE) data, and more.

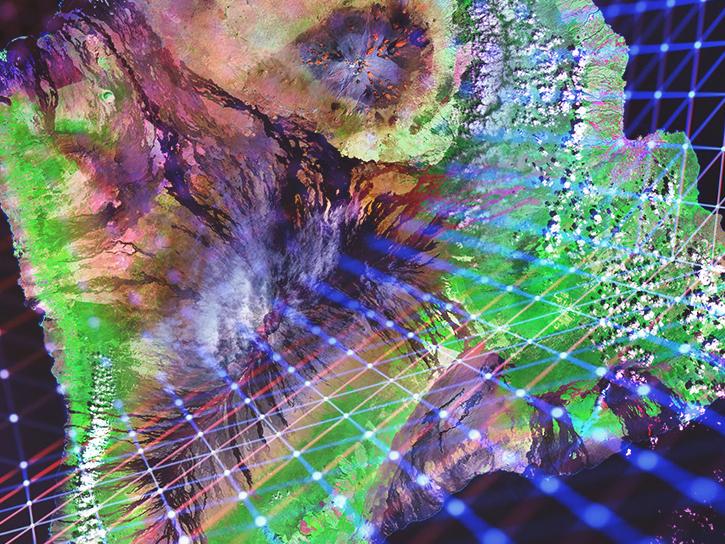
SAR image of Mauna Loa

Submit your abstract for a workshop hosted by NASA and ESA (European Space Agency) focused on the opportunities and challenges of integrating foundation models into the Earth observation (EO) and Earth science ecosystems. The abstract submission deadline is January 31, 2025.

This rectangular image shows the location of satellite-based fire detection targets overlaid on visible imagery of the Los Angeles area landscape. In the center of the image over Pacific Palisades, CA, are nearly 30 pink, light purple, and purple squares showing the location of suspected fires.

This image shows Hurricane Milton’s storm path between October 5-10, 2024 using Time-Resolved Observations of Precipitation structure and storm Intensity with a Constellation of Smallsats (TROPICS) Level 1B Brightness Temperature and International Best Track Archive for Climate Stewardship database from NOAA’s National Centers for Environmental Information (NCEI) datasets.

False-color corrected reflectance image of fires in Los Angeles, California including the Palisades, Hurst, and Eaton Fires on 8 January 2025 from the MODIS instrument aboard the Aqua satellite

Worldview Image of the Week

A satellite image of the West Coast shows the ocean in dark blue, land in shades of brown, and wildfire hotspots in bright red.

Open Science

We empower an inclusive, collaborative scientific process through the open sharing of data and knowledge. Our open data, services, and software policies ensure that data are fully available to any user for any purpose.

Earth Science Data Systems 2024 Fiscal Year Highlights
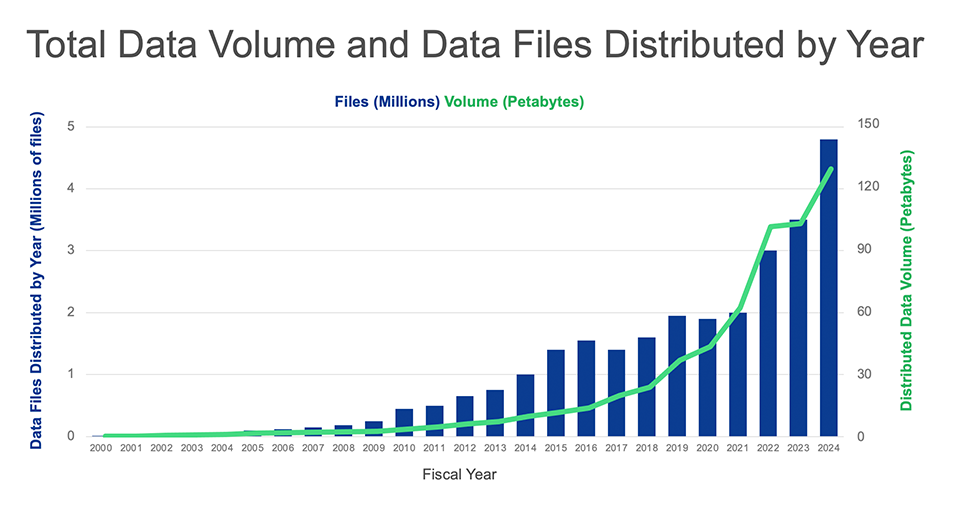
This bar chart and line graph shows total data volume and data files distributed by year for fiscal year 2024.

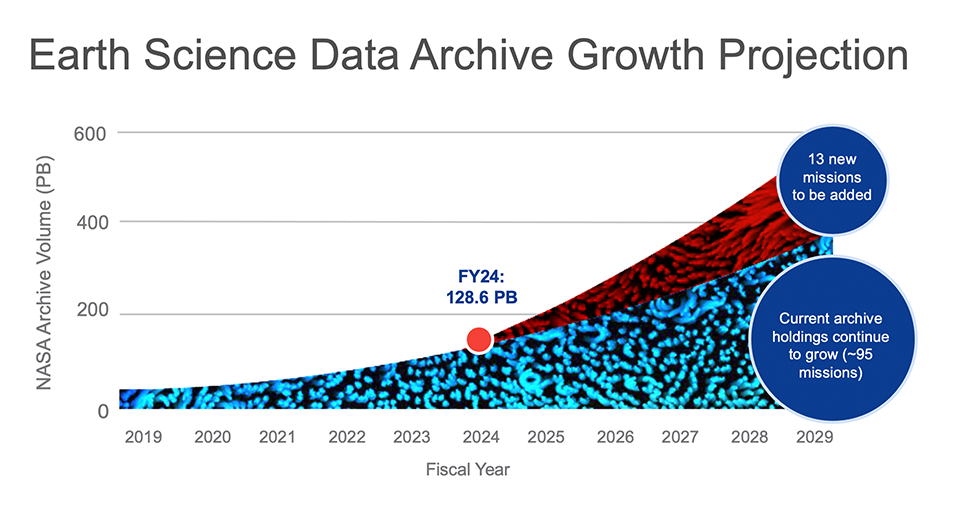
This is a chart showing the data archive growth projection up to fiscal year 2024.

+4.5 billion

files distributed to end users

8+ million

distinct data and service users

128+ petabytes

of Earth science data available