Venn Diagrams (original) (raw)
Last Updated : 11 Aug, 2025
A Venn diagram is a visual representation that uses overlapping shapes to illustrate the relationships between different groups or sets. The overlapping regions represent common elements shared between groups, while the non-overlapping areas show elements unique to each group. This clear and concise visualization simplifies understanding how different groups relate to each other.
Types of Venn Diagram
There are two types of questions asked from the Venn diagram:
1. Basic Relationship
In this type, simple relationships between groups or sets are described. Candidates are required to identify the Venn diagram that best represents these general relationships.
**Sample Problem 1:
The Relationship among **Cars, **Electric Vehicles, and **Vehicles is given as:
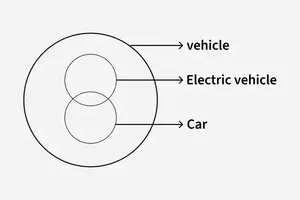
- Electric vehicles are a type of vehicle.
- Cars are also a type of vehicle.
- Some cars are electric vehicles, but not all.
2. Geometrical Relationship
This type involves relationships presented in a geometrical format. Candidates must analyze these and select the most logical Venn diagram that accurately depicts the given relations.
**Sample Problem 2:
In the figure below:
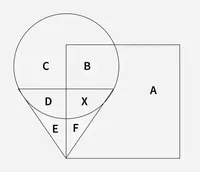
- The circle represents Books,
- The triangle represents Magazines,
- The square represents Newspapers.
Which region(s) represent all three — Books, Magazines, and Newspapers?
**Solution: Here, **X represents all three elements.
**Sample Problem 3:
In the given Venn diagram:
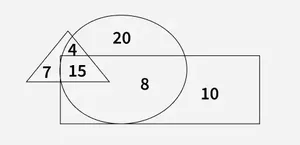
- The circle represents Football players,
- The triangle represents Basketball players,
- The rectangle represents Students.
The numbers inside the shapes represent the number of people in each category.
How many students play football but not basketball?
**Solution:
The diagram positions the rectangle overlapping the circle on one side with the label 8 in that overlapping region, while the triangle overlaps the circle on the opposite side.
- Since the rectangle and triangle do not overlap each other, the region labeled 8 is entirely outside the triangle.
- Thus, it represents students who play football but not basketball.
Also Check:
➣ Venn Diagrams Solved Question- Refer Here!
➣ Test your knowledge- Quiz!