Evaluate Library for Hugging Face (original) (raw)
Last Updated : 9 May, 2026
Evaluate library is a tool designed to assess the performance of Hugging Face models using a wide range of evaluation metrics. It simplifies the process of measuring model accuracy, precision, recall and other metrics across different tasks.
- Provides ready‑to‑use evaluation metrics for various ML tasks
- Supports benchmarking and comparison of model performance
- Works seamlessly with Hugging Face datasets and transformers
Techniques for Evaluation
**1. ROUGE: Used for evaluating text summarisation by comparing generated text with the actual text
- **ROUGE-1: Checks how many words in the generated summary are also present in the actual summary
- **ROUGE-2: Checks how many pairs of words (phrases) match between the two summaries
- **ROUGE-L: Checks how much of the sentence structure matches in the same order
- **ROUGE-Lsum: Checks overall similarity of the complete summary
**2. BLEU: Used for evaluating generated text by comparing it with reference text and checks how many words and word sequences match with the actual text.
**3. **Accuracy: Measure how many predictions are correct out of total prediction and gives overall correctness of the model.
**4. **Precision: Measures how many predicted positive results are actually correct
**5. **Recall: Measure how many actual positive results are correctly identified
6. **F1 Score: Used for balancing precision and recall into a single value
Implementation
Let’s understand the implementation using a text summarization model from Hugging Face with a sample dataset.
**Step 1: Importing the required libraries
- transformers (pipeline) is used to load pre-trained models for tasks like text summarization
- evaluate is used for computing evaluation metrics
- datasets is used for loading dataset Python `
import pandas as pd from transformers import pipeline import evaluate from datasets import load_dataset
`
**Step 2: Loading the Dataset
Loading the dataset from a CSV file to use real text and summary data.
You can download the dataset from here.
Python `
df = pd.read_csv("bbc_real_dataset.csv") print(df.head())
`
**Output:
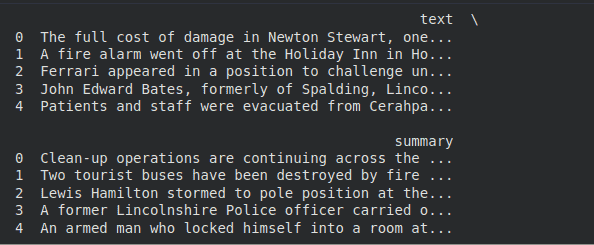
Dataset preview showing text and summaries
Step 3: Preparing the Dataset
Selecting a small subset of the dataset and converting it into the required format.
Python `
dataset = df.head(2).to_dict(orient="records") print(dataset)
`
**Output:
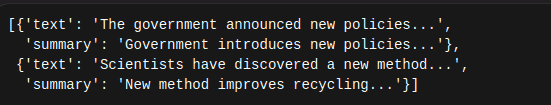
Prepared dataset in dictionary format
**Step 4: Loading the Summarization Model
Loading a pre-trained model to generate summaries from the given text.
Python `
summarizer = pipeline(task="summarization", model="sshleifer/distilbart-cnn-12-6") print("\nModel loaded successfully")
`
Generating summaries for the input text using the loaded model.
Python `
predictions = [] for item in dataset: summary = summarizer( item["text"], # article text max_length=40, min_length=15, do_sample=False )[0]['summary_text']
predictions.append(summary)Show one generated summary
print("\nGenerated Summaries:") for i in range(len(predictions)): print(f"{i+1}. {predictions[i]}\n")
`
**Output:

Generated summaries by the model
Step 6: Preparing Reference Summaries
Extracting the actual summaries from the dataset for comparison.
Python `
references = [item["summary"] for item in dataset]
print("Reference Summaries:") for i in range(len(references)): print(f"{i+1}. {references[i]}\n")
`
**Output:

Actual Reference Summaries from the Dataset
**Step 7: Loading the ROUGE metric
- ROUGEmeasures similarity between generated and reference summaries
- Higher score indicates better performance Python `
rouge = evaluate.load("rouge") print("ROUGE metric loaded")
`
**Step 8: Computing the ROUGE Score
Compare generated summaries with actual summaries
Python `
result = rouge.compute(predictions=predictions, references=references)
`
**Step 9: Displaying the Results
Python `
print("ROUGE-1:", result['rouge1']) print("ROUGE-2:", result['rouge2']) print("ROUGE-L:", result['rougeL']) print("ROUGE-Lsum:", result['rougeLsum'])
`
**Output:
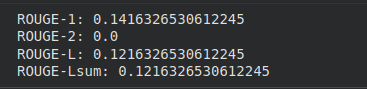
Output
The output shows how close the generated summary is to the actual summary.
- ROUGE-1 (0.14) means only about 14% of the words in the generated summary match the actual summary
- ROUGE-2 (0.0) means no word pairs match, so phrases are not correctly captured
- ROUGE-L (0.12) shows very low similarity in the overall structure of the summary
- ROUGE-Lsum (0.12) also indicates low similarity for the complete summary
- Lower values indicate that the generated summary is not very accurate
We performed this implementation to check how good the model’s output is. It helped us compare the generated summary with the actual summary and showed that the model needs improvement as the similarity is quite low.