Grafana (original) (raw)
Last Updated : 1 Apr, 2026
Grafana is an open-source observability platform that visualizes real-time data from multiple external sources without storing it. It acts as a bridge between telemetry and monitoring workflows, helping teams understand system performance and respond faster to incidents.
- Connects with tools like Prometheus, Elasticsearch, and MySQL for unified data visualization.
- Offers interactive dashboards, alerting, plugins, and RBAC for secure and scalable monitoring.
- Commonly paired with Prometheus to track infrastructure health, latency, and anomalies.
- Supports diverse use cases including infrastructure, application performance, business metrics, and cloud monitoring.
Grafana Working & Architecture Flow
Grafana acts as a visualization layer between your data sources and your monitoring workflows.
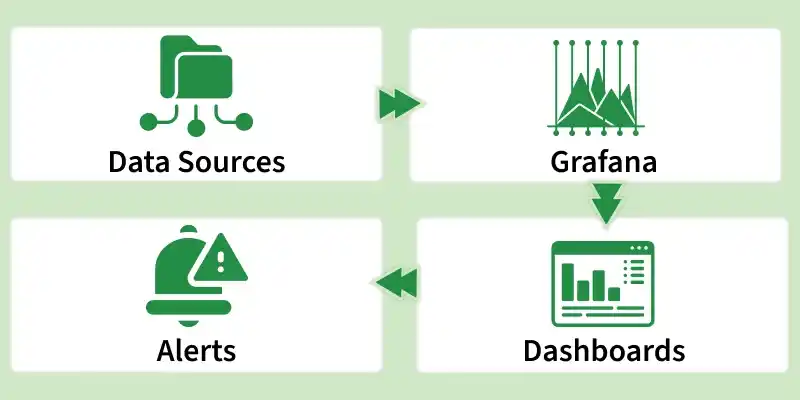
Grafana Working
- Data is collected by monitoring tools (e.g., Prometheus).
- Grafana queries these sources in real time.
- Results are displayed through dashboards.
- Alerts are triggered when thresholds are exceeded.
Grafana also integrates seamlessly with:
- **Metrics: Prometheus, InfluxDB
- **Logs: Loki, Elasticsearch
- **Traces: Tempo, Jaeger
This unified approach provides complete visibility across your systems.
Key Features of Grafana
**Interactive Dashboards & Customizable Visualizations
- Grafana enables users to build interactive, real-time dashboards for monitoring data.
- Grafana offers a wide range of visualization options, from simple line graphs to advanced charts like heatmaps, histograms, pie charts, and gauges.
- Each visualization is highly customizable with settings such as color schemes, axes, legends, and queries.
- The drag-and-drop interface makes dashboards easy to organize and customize.
- Users can add, remove, and rearrange panels, allowing dashboards to adapt as data needs evolve.
**Support for Multiple Data Sources
- Grafana supports multiple data sources, offering flexibility in how data is collected and visualized.
- It integrates with popular time-series databases like Prometheus, InfluxDB, and Graphite.
- Grafana also connects to relational databases such as MySQL, PostgreSQL, and SQL Server.
- It works with tools like Elasticsearch and AWS CloudWatch, enabling teams to unify data from multiple systems into a single monitoring interface.
**Alerting and Notifications
- Grafana’s alerting feature helps users actively monitor systems by triggering notifications based on defined thresholds.
- Alerts can be set on any dashboard panel to warn teams when metrics cross configured limits.
- It is particularly valuable for monitoring critical infrastructure and preventing outages.
- Notifications can be sent through channels like email, Slack, or Microsoft Teams for quick response.
**Plugins and Extensibility
- Grafana supports numerous plugins that add new data sources, visualization types, and third-party integrations.
- It can connect with external systems like Jira, PagerDuty, and Google Cloud Monitoring to enhance monitoring and incident management.
- The plugin ecosystem allows users to expand functionality based on their operational needs.
- Users can build custom panels, dashboards, and apps tailored to specific business requirements.
Setting Up Grafana
**Install Grafana:
- Begin by installing Grafana on your system to enable monitoring and visualization capabilities.
- Grafana offers installation packages for Linux, macOS, and Windows, allowing flexibility across different environments.
- You can install it either through package managers or by downloading it directly from the official Grafana website, depending on your operating system.
**Start and Enable Grafana:
- Once the installation is complete, you can start Grafana as a service on your system.
- Running it as a service ensures that Grafana operates continuously in the background.
- It also enables Grafana to start automatically whenever your system boots up.
**Access Grafana Web Interface:
- By default, Grafana runs on port 3000 after the initial setup.
- Open a web browser and visit the default URL to access the Grafana web interface.
- Log in using the default credentials, after which you will be prompted to change your password.
**Add Data Sources:
- After logging in, you need to add data sources to Grafana to begin visualizing metrics.
- Grafana supports multiple data sources such as Prometheus, MySQL, and PostgreSQL, along with many other integrations.
- Navigate to the settings section to add and configure a data source by providing details like the server address and login credentials.
**Create Your First Dashboard:
- After connecting your data sources, you can start designing dashboards within Grafana.
- Grafana’s interface makes it easy to create dashboards and visualize your data effectively.
- Add panels to monitor different metrics, choosing from visualization options such as graphs, tables, and heatmaps.
**Set Up Alerts:
- Grafana enables users to set up alerts to monitor specific conditions.
- Alerts trigger notifications when defined metrics exceed or fall below specified threshold values.
- You can create alert rules within the panel settings and configure notification channels to receive alerts.
**Secure Grafana:
- Securing Grafana is essential for maintaining a safe deployment environment.
- Enable HTTPS to encrypt data in transit and protect sensitive information.
- Implement authentication methods such as LDAP or OAuth, and configure Role-Based Access Control (RBAC) to limit access to data and features.
Grafana Management Solutions
Grafana offers different management solutions to cater to the diverse requirements of businesses, from small startups to large enterprises. These options provide flexibility, scalability, and control over how organizations monitor and manage their data. The primary management solutions offered are:
1 . Grafana Cloud
Grafana Cloudprovides comprehensive monitoring capabilities which unite Grafana data visualization with strong full-stack monitoring performance. The platform perfectly connects with major data sources including Prometheus, Loki and Graphite to present businesses with a complete picture of their metrics and logs.
2. Grafana Enterprise Stack
For organizations that prefer handling their observability setup on their own infrastructure **Grafana Enterprise Stack provides complete control and high-performance capabilities. Some standout features include:
- **Enterprise Log Management: Secure and scalable log analysis for advanced log indexing.
- **Enterprise Metric Handling: Self-managed scalable Prometheus-based service for storing and processing metrics.
- **Enterprise Tracing: With the tracing system, you maintain full control over tracing operations that link logs and metrics with traces to analyze system behavior in depth.
The Enterprise Stack is ideal for teams who need to preserve their infrastructure while using Grafana’s advanced monitoring features.
3. Grafana OnCall
**Grafana OnCall represents a strong solution to manage which team member handles particular incidents at what time. The system was created to decrease manual workload through the automation of routine tasks such as schedule generation, escalation processes and notification distribution.
Common Use Cases
Grafana is widely used across industries for various purposes due to its flexibility, scalability, and powerful visualization capabilities. Here are some of the most common use cases:
1. Infrastructure Monitoring
- Grafana serves as a powerful visualization tool for monitoring infrastructure health and performance.
- It enables teams to view real-time metrics from servers, networks, and cloud services.
- This helps track critical parameters such as system uptime, CPU usage, memory consumption, and network traffic.
2. Application Performance Monitoring (APM)
- Developers and DevOps teams use Grafana to monitor application performance effectively.
- By integrating data sources like Prometheus or Elasticsearch, Grafana can visualize metrics such as response times, error rates, and application throughput.
- This helps ensure applications run smoothly and allows teams to quickly identify and resolve performance issues that could impact end users.
3. Business Metrics Tracking
- Grafana is a valuable tool for tracking business metrics and key performance indicators (KPIs).
- It can monitor data such as sales, website traffic, and customer interactions.
- With the ability to visualize data from multiple sources like SQL databases and cloud services, Grafana helps organizations assess business health and make data-driven decisions in real time.
4. Log and Event Monitoring
- Grafana can be integrated with tools like Loki and Elasticsearch to centralize log management and event monitoring.
- Visualizing logs alongside system metrics provides a comprehensive view of your environment.
- This capability is especially helpful for troubleshooting, system monitoring, and managing security events.
5. Cloud Service Monitoring
- Grafana is widely used by organizations to monitor cloud infrastructure across AWS, Azure, and Google Cloud Platform.
- It collects monitoring data from services like AWS CloudWatch, Google Stackdriver, and Azure Monitor to create clear dashboard visualizations.
- This unified view allows teams to easily track cloud performance and health from a single interface.
6. IoT and Sensor Data Visualization
- Grafana is used in industries like manufacturing and agriculture to monitor data from IoT devices and sensors.
- It visualizes real-time metrics such as machine temperature, warehouse humidity, and urban air quality.
- This helps organizations optimize operations and address potential issues before they escalate.
7. Incident Response and Alerting
- Grafana offers advanced alerting features that make it an essential tool for incident response.
- Teams can set threshold-based alerts to receive immediate notifications for events like server downtime or traffic spikes.
- It integrates with external services such as Slack and PagerDuty, enabling faster response to incidents.