Change grid line thickness in 3D surface plot in Python Matplotlib (original) (raw)
Last Updated : 14 Sep, 2021
Prerequisites: Matplotlib
Using Matplotlib library we can plot the three-dimensional plot by importing the mplot3d toolkit. In this plot, we are going the change the thickness of the gridline in a three-dimensional surface plot. Surface Plot is the diagram of 3D data it shows the functional relationship between the dependent variable (Y), and two independent variables (X and Y) rather than showing the individual data points.
Gridlines are the lines that cross the plot to show the axis divisions. Gridlines of the plot help the viewer of the chart to see what value is represented by the particular unlabeled data point of the plot. It helps especially when the plot is too complicated to analyze, so according to the need, we can adjust or change the thickness of the grid lines or the styles of the grid lines.
Approach
- Import the necessary libraries.
- Create the 3D data for plotting.
- Create the three-dimensional co-ordinate system using ax = matplotlib.pyplot.gca('projection=3d') here gca stands for get current grid and in that pass the parameter projection=3d it will generate three-dimensional co-ordinate system.
- Now for changing the gridline thickness we have to update the axes info of respective axes by using ax.xaxis.update({'linewidth':3}) or whatever grid width you want to set this is for x-axis in the same way you can set for Y axis and Z axis just writing yaxis, zaxis in place of xaxis respectively.
- If want to change the color of the respective axis just pass 'color':'red' in the dictionary ax.xaxis.update({'linewidth':3,'color':'red'}) or whatever color you want to set.
- Now after making changes plot the surface plot using ax.plot_surface(x,y,z) in that pass 3d data.
- Set X, Y and Z label using ax.set_xlabel(), ax.set_ylabel(), ax.set_zlabel() in parameter pass the string.
- Now visualize the plot using matplotlib.pyplot.show() function.
Example 1: Changing X-axis grid lines thickness in the 3D surface plot using Matplotlib.
Python `
importing necessary libraries
import matplotlib.pyplot as plt from mpl_toolkits.mplot3d import Axes3D import numpy as np
function to create data for plotting
def data_creation():
# creating 3d data
x = np.outer(np.linspace(-3, 3, 30), np.ones(30))
y = x.copy().T # transpose
z = np.cos(x ** 2 + y ** 2)
return (x,y,z)
main function
if name == 'main':
# creating three dimensional co-ordinate system
ax = plt.gca(projection='3d')

# calling data creation function and storing in
# the variables
data_x,data_y,data_z = data_creation()

# changing grid lines thickness of x axis to 3
ax.xaxis._axinfo["grid"].update({"linewidth":3})

# plotting surface plot
ax.plot_surface(data_x,data_y,data_z)

# giving label name to x,y and z axis
ax.set_xlabel("X axis")
ax.set_ylabel("Y axis")
ax.set_zlabel("Z axis")

# visualizing the plot
plt.show()
`
Output:

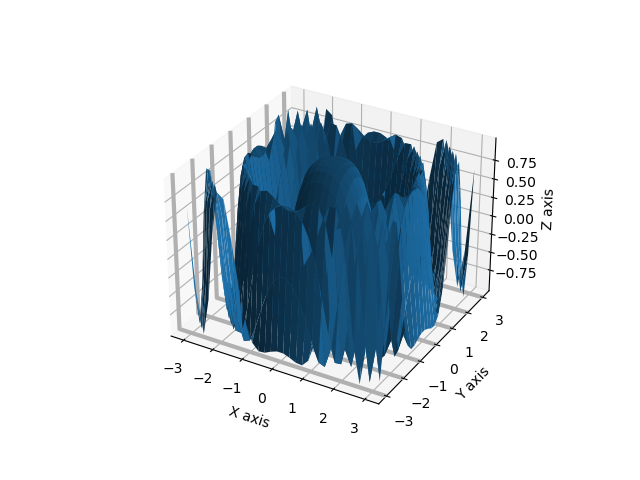
In the above example, we had changed the gridline thickness of X-axis, as you can see in the above figure X-axis gridlines has a thicker line with gray color. It can be done by updating the _axinfo dictionary of the respective axis in the above example code our respective axis is X axis.
Example 2: Changing X-axis grid lines thickness in the 3D surface plot using Matplotlib.
Python `
importing necessary libraries
import matplotlib.pyplot as plt from mpl_toolkits.mplot3d import Axes3D import numpy as np
function to create data for plotting
def data_creation():
# creating 3d data
x = np.outer(np.linspace(-3, 3, 30), np.ones(30))
y = x.copy().T # transpose
z = np.cos(x ** 2 + y ** 2)
return (x,y,z)
main function
if name == 'main': # creating three dimensional co-ordinate system ax = plt.gca(projection='3d')
# calling data creation function and storing in the variables
data_x,data_y,data_z = data_creation()

# changing grid lines thickness of Y axis to 3
ax.yaxis._axinfo["grid"].update({"linewidth":3})

# plotting surface plot
ax.plot_surface(data_x,data_y,data_z)

# giving label name to x,y and z axis
ax.set_xlabel("X axis")
ax.set_ylabel("Y axis")
ax.set_zlabel("Z axis")

# visualizing the plot
plt.show()
`
Output:
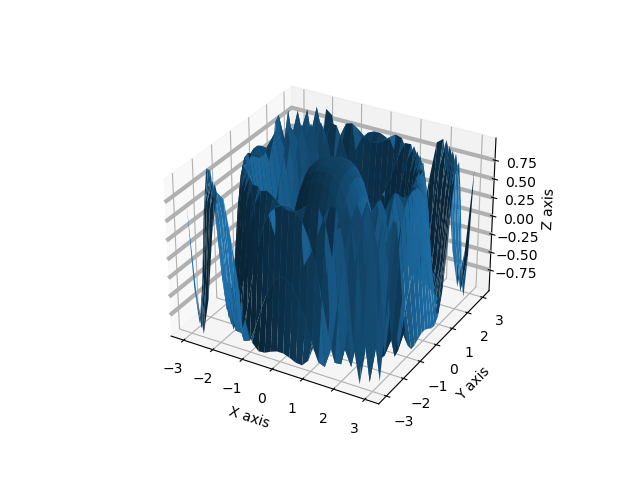
In the above example, we had changed the gridline thickness of Y axis, as you can see in the above figure Y-axis gridlines has a thicker line with gray color. We had set the gridline thickness of Y-axis to 3.
Example 3: Changing Z axis grid lines thickness in 3D surface plot using Matplotlib.
Python `
importing necessary libraries
import matplotlib.pyplot as plt from mpl_toolkits.mplot3d import Axes3D import numpy as np
function to create data for plotting
def data_creation(): # creating 3d data x = np.outer(np.linspace(-3, 3, 30), np.ones(30)) y = x.copy().T # transpose z = np.cos(x ** 2 + y ** 2) return (x,y,z)
main function
if name == 'main': # creating three dimensional co-ordinate system ax = plt.gca(projection='3d')
# calling data creation function and storing in the variables
data_x,data_y,data_z = data_creation()

# changing grid lines thickness of Z axis to 3
ax.zaxis._axinfo["grid"].update({"linewidth":3})

# plotting surface plot
ax.plot_surface(data_x,data_y,data_z)

# giving label name to x,y and z axis
ax.set_xlabel("X axis")
ax.set_ylabel("Y axis")
ax.set_zlabel("Z axis")

# visualizing the plot
plt.show()
`
Output:
In the above example, we had changed the gridline thickness of the Z-axis, as you can see in the above figure Z-axis gridlines have a thicker line with gray color. We had set the gridline thickness of the Z-axis to 3.
Example 4: Changing gridline thickness and color of all three axis using Matplotlib.
Python `
importing necessary libraries
import matplotlib.pyplot as plt from mpl_toolkits.mplot3d import Axes3D import numpy as np
function to create data for plotting
def data_creation():
# creating 3d data
x = np.outer(np.linspace(-3, 3, 30), np.ones(30))
y = x.copy().T # transpose
z = np.cos(x ** 2 + y ** 2)
return (x,y,z)
main function
if name == 'main': # creating three dimensional co-ordinate system ax = plt.gca(projection='3d')
# calling data creation function and storing in the variables
data_x,data_y,data_z = data_creation()

# changing grid lines thickness of x axis to 1
ax.xaxis._axinfo["grid"].update({"linewidth":1})

# changing grid lines thickness of Y axis to 1 and giving color to red
ax.yaxis._axinfo["grid"].update({"linewidth":1,'color':'red'})

# changing grid lines thickness of Z axis to 1 and giving color to green
ax.zaxis._axinfo["grid"].update({"linewidth":1,'color':'green'})

# plotting surface plot
ax.plot_surface(data_x,data_y,data_z)

# giving label name to x,y and z axis
ax.set_xlabel("X axis")
ax.set_ylabel("Y axis")
ax.set_zlabel("Z axis")

# visualizing the plot
plt.show()
`
Output:
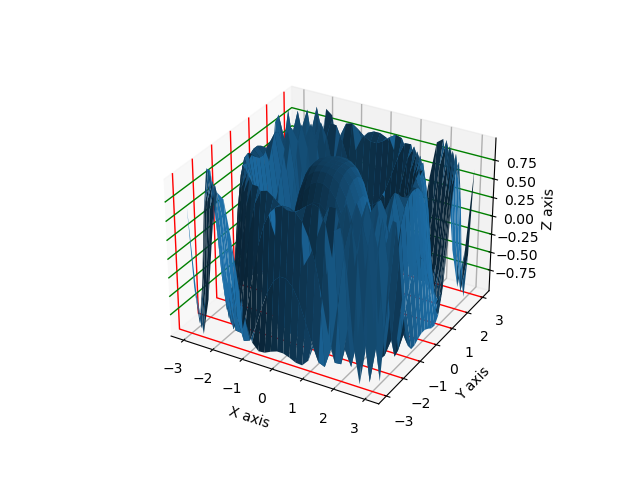
In the above example, we had set the gridline thickness of X, Y, and Z axis to 1 and change the color of the Y-axis to red and Z-axis to green, by updating the _axinfo and updating the dictionary we had set line width and color of the 3D plot.