Google Cloud Monitoring & Logging (original) (raw)
Last Updated : 17 Mar, 2026
Monitoring and logging are essential in cloud environments to maintain the performance, reliability, and security of applications. Google Cloud provides Cloud Monitoring and Cloud Logging to track system metrics, analyze logs and detect issues. These tools help teams gain real-time visibility into infrastructure and troubleshoot problems efficiently.
- **Monitoring Dashboards: Create custom dashboards to visualize metrics like CPU, memory, network traffic and latency.
- **Metrics Explorer: Analyze and filter metrics to identify performance issues and unusual system behavior.
- **Alerting Policies: Set alerts based on thresholds and receive notifications via Email, SMS, Slack, Pub/Sub, or PagerDuty.
- **Observability Integration: Integrates with Google Cloud observability tools for unified monitoring of metrics, logs, and traces.
Google Cloud Operations Suite
Google Cloud Monitoring and Logging are part of the Google Cloud Operations Suite (formerly known as Stackdriver). This suite includes several tools designed for monitoring, debugging, and managing cloud environments.
Key components include:
- **Cloud Monitoring: Tracks metrics and system health.
- **Cloud Logging: Collects and analyzes logs.
- **Cloud Trace: Analyzes request latency in distributed systems.
- **Cloud Profiler: Identifies performance bottlenecks in applications.
- **Cloud Debugger: Debugs applications in production without stopping them.
These tools work together to provide end-to-end observability for applications running on Google Cloud.
Google Cloud Monitoring (Step-by-Step Guide)
Step 1: Enable Monitoring API
Open the Google Cloud Console.
Select your existing project or create a new project.
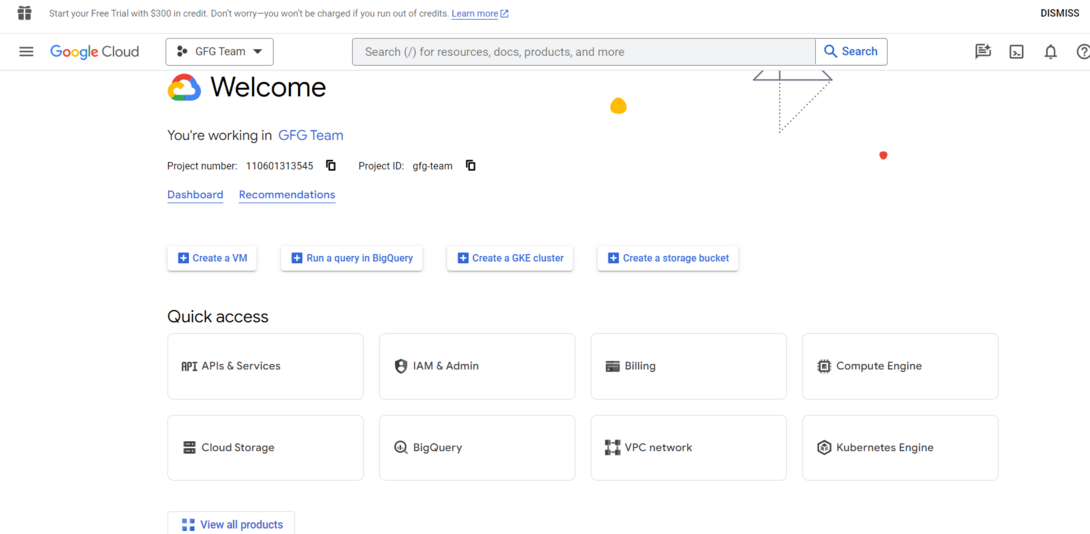
Navigate to the "**APIs & Services" > "**Dashboard" and click on on the "**+ ENABLE APIS AND SERVICES" button.
Search for "Monitoring API" and enable it.
Step 2: Create a Monitoring Workspace
In the Google Cloud Console, navigate to "**Monitoring" > "Dashboards."
Click on "**Create Dashboard."
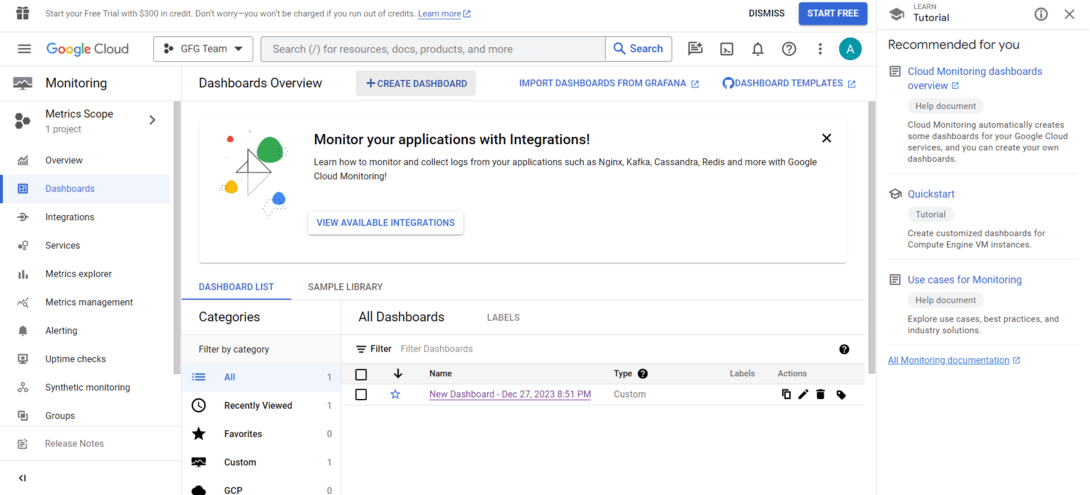
Click on Create Dashboard
Add **charts and widgets in your dashboard based totally to your monitoring requirements.
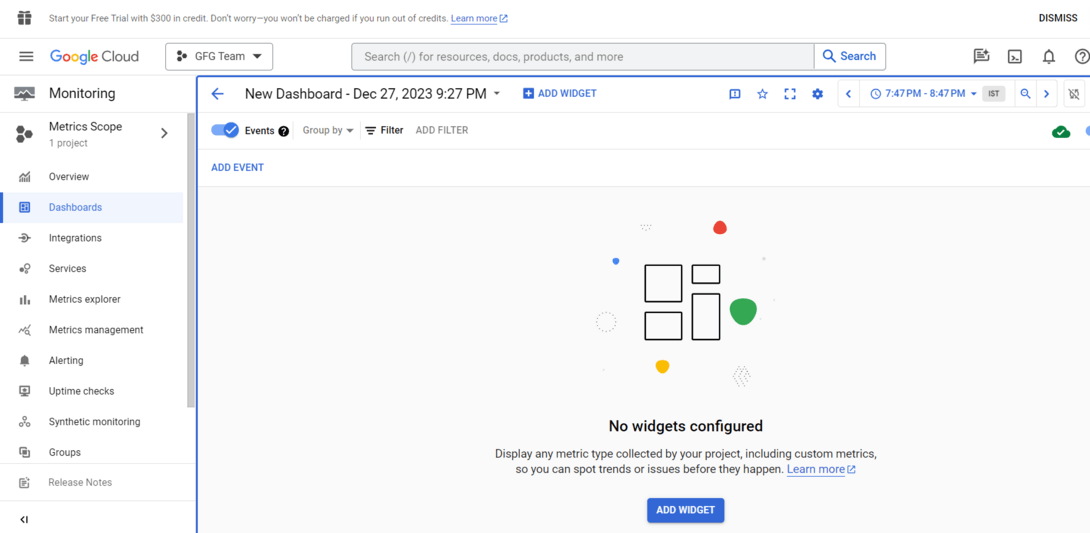
Add widgets and Chart
Step 3: Set Up Monitoring Alerts
In the Google Cloud Console, navigate to "**Monitoring" > "**Alerting."
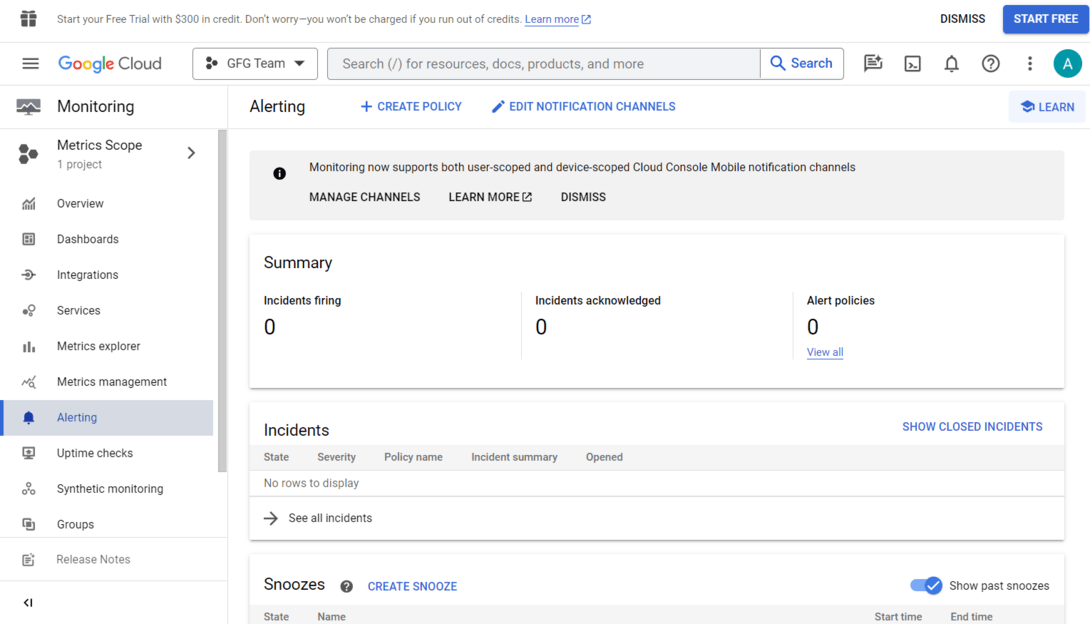
navigate to alerting
Click on "**Create Policy."
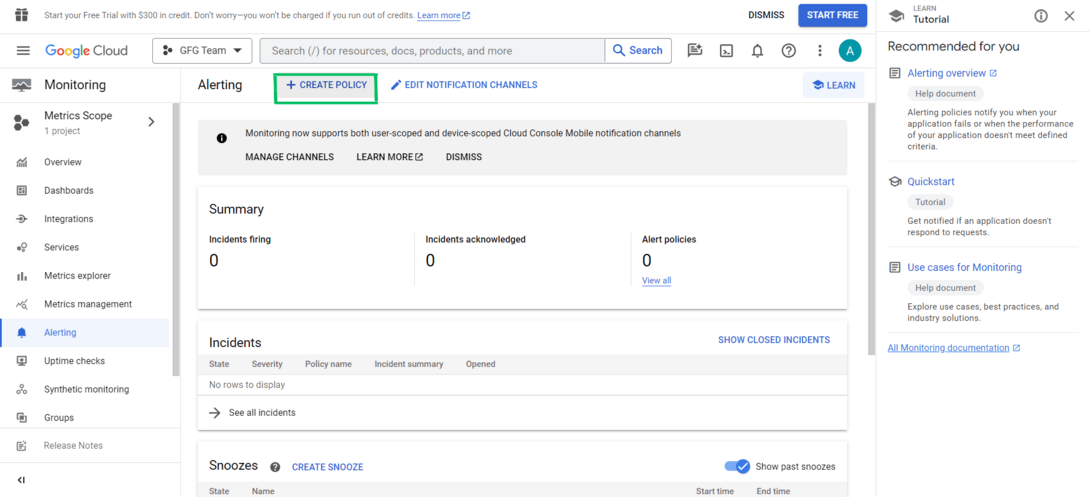
click on create policy
Configure the conditions in your alert (e.g., metric threshold).
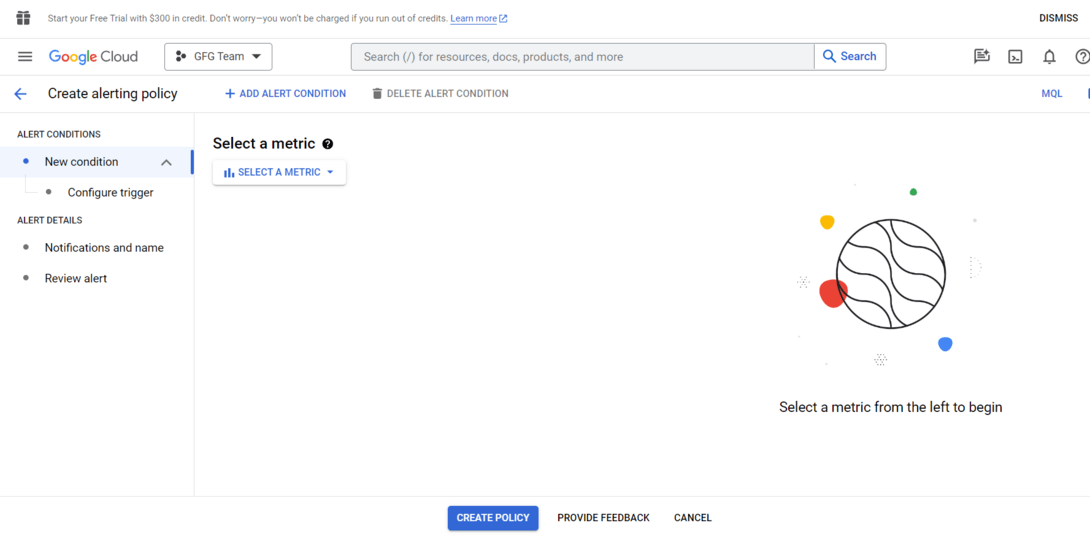
Configure the conditions in your alert
Set up notification channels (e.g., email, SMS, or Pub/Sub) for alert notifications.
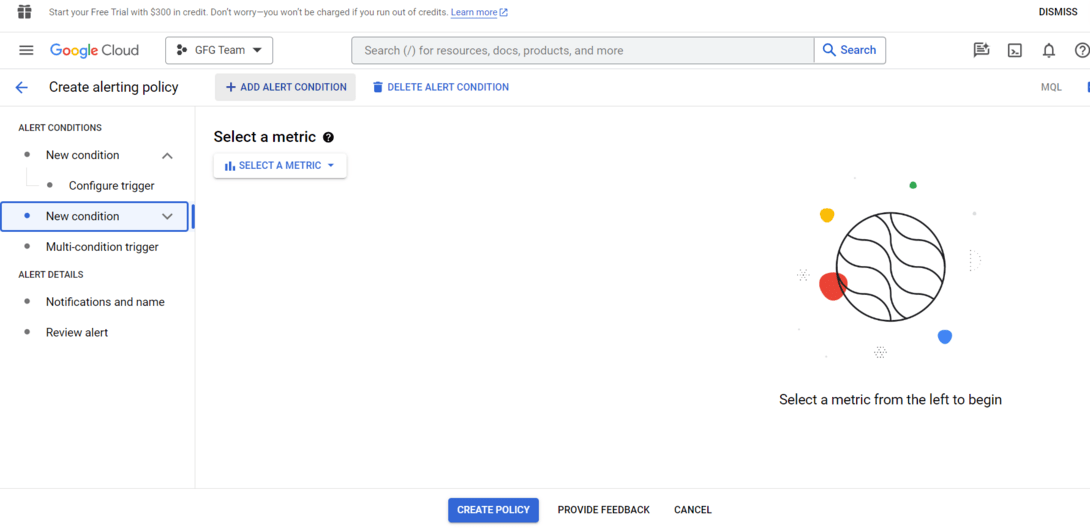
Add Alert Condition
Google Cloud Logging
Google Cloud Logging is a log management service that collects, stores, and analyzes logs from Google Cloud services and applications. Logs capture detailed system events that help with troubleshooting, auditing, and security monitoring. The service provides centralized log management and integrates with monitoring tools for better observability.
- **Centralized Log Management: Collects logs from multiple GCP services in a single location.
- **Advanced Filtering & Search: Use Logs Explorer to filter logs by time, severity, resource type, and metadata.
- **Log Export: Export logs to Cloud Storage, BigQuery, or Pub/Sub for storage, analytics, or streaming.
- **Monitoring Integration: Works with Cloud Monitoring to correlate logs with system metrics and diagnose issues faster.
Google Cloud Logging (Step-by-Step Guide)
Step 1: Enable Logging API
In the Google Cloud Console, go to "**APIs & Services" > "**Dashboard."
Click on "**+ ENABLE APIS AND SERVICES."
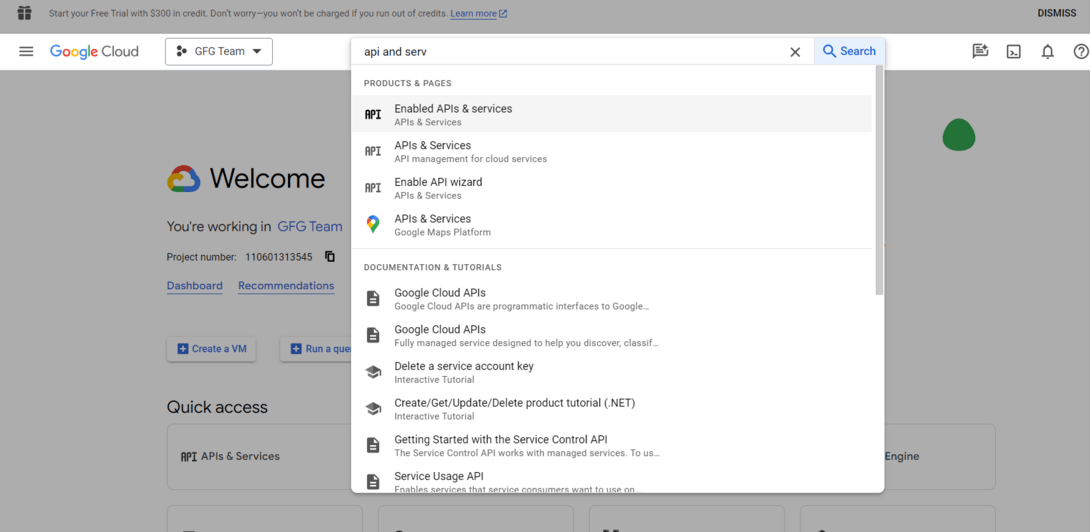
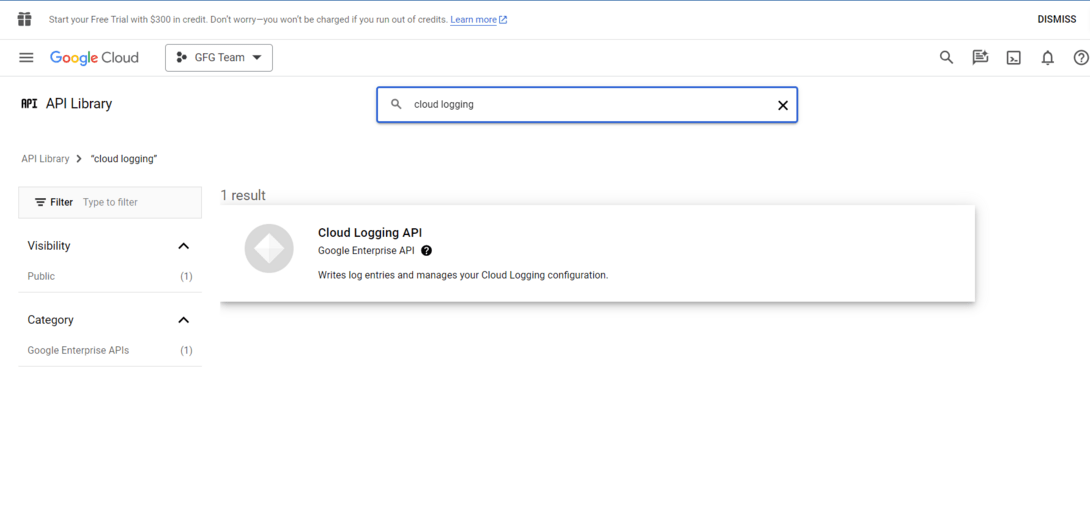
Search for "**Cloud Logging API" and enable it.
Enable Cloud Logging API
Step 2: View Logs inside the Console
In the Google Cloud Console, navigate to "**Logging" > "**Logs Explorer."
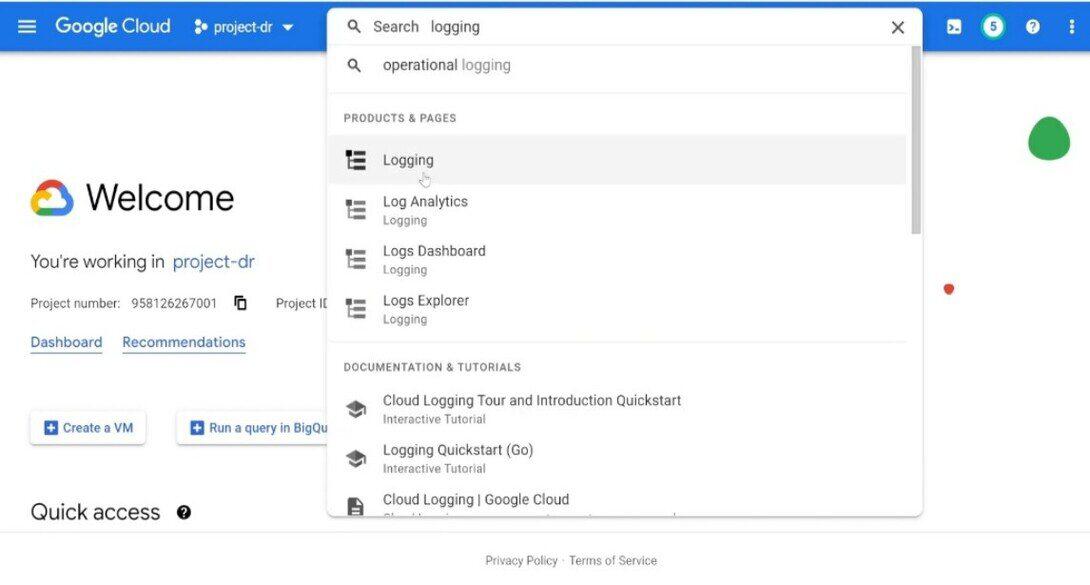
Navigate to "Logging"
Use the Logs Explorer to search, filter out, and examine logs generated by way of your GCP resources.
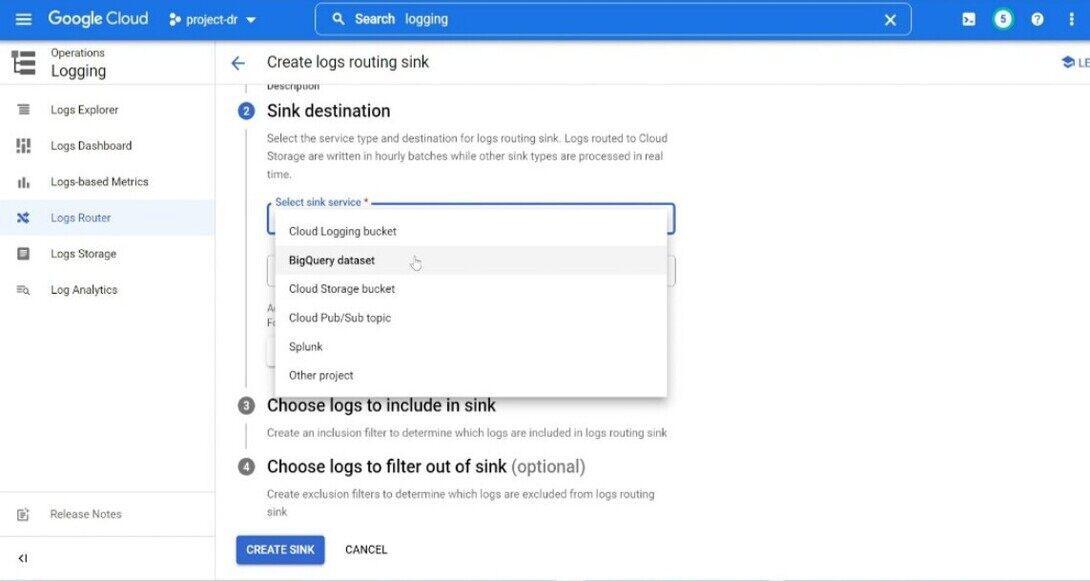
Step 3: Configure Log Exports
In the Google Cloud Console, go to "**Logging" > "**Exports."Click on "**Create Export."Choose the log entries that you want to export and pick out a destination (for e.g., Cloud Storage, BigQuery).
Step 4: Use Logging in Code
Integrate logging into your application using your selected programming language. For example, in Python, you may use the google-cloud-logging library:
Python `
from google.cloud import logging
client = logging.Client() logger = client.logger('my-log')
logger.log_text('Hello, this is a log message.')
`
Real-World Example: Monitoring a Web Application
Consider a web application running on Google Cloud with the following architecture:
- Compute Engine running backend services
- Cloud SQL database
- Cloud Load Balancer
- Cloud Storage
Using Google Cloud Monitoring and Logging:
- Monitoring tracks CPU usage, request latency, and traffic patterns.
- Logging records application errors and API requests.
- Alerts notify administrators when CPU usage exceeds a defined threshold.
- Logs help developers debug errors quickly.
This approach ensures high availability and system reliability.
Use Cases and Examples
- **Performance Optimization: Monitor software performance to identify bottlenecks and optimize code or infrastructure.
- **Anomaly Detection: Implement anomaly detection to routinely discover unusual conduct or deviations from the norm.
- **Security Incident Response: Use logs to investigate security incidents and set up a timeline of activities for powerful incident response.
- **Resource Scaling: Utilize tracking metrics to dynamically scale sources primarily based on demand, ensuring ideal overall performance and price efficiency.
- **Fault Detection and Diagnostics: Quickly detect faults by putting in alerts for critical errors and using logs for specific diagnostics at some stage in troubleshooting.
- **ServiceNow Integration: Integrate Google Cloud Monitoring and Logging with ServiceNow for streamlined incident management and backbone.
- **PagerDuty Integration: Integrate with PagerDuty to enhance alert notifications and incident response abilities.
- **Grafana Integration: Use Grafana for advanced visualization and information analysis, integrating it with Google Cloud Monitoring for a greater complete dashboard.
- **ELK Stack Integration: Integrate Elasticsearch, Logstash, and Kibana (ELK Stack) for effective log evaluation and visualization abilities.
- **Prometheus Integration: Leverage the compatibility of Google Cloud Monitoring with Prometheus for a robust monitoring and alerting solution.
Best Practices for Monitoring and Logging
- **Define Clear Objectives: Clearly define the goal of your tracking and logging method. Understand what metrics and logs are important for your specific use case.
- **Granular Alerting: Implement granular alerting to receive notifications for particular conditions. Avoid unnecessary alerts to save you from alert fatigue.
- **Regularly Review and Update: Regularly evaluate and replace your monitoring and logging configurations. Systems and applications evolve, and so should your observability strategy.
- **Utilize Custom Metrics and Logs: Take gain of custom metrics and logs to seize application-specific statistics. Tailor your monitoring to the specific traits of your system.