Create a Heatmap in R Programming heatmap() Function (original) (raw)
Last Updated : 26 Mar, 2024
A **heatmap() function in **R Programming Language is used to plot a heatmap. A heatmap is defined as a graphical representation of data using colors to visualize the value of the matrix. In this to represent more common values or higher activities brighter colors reddish colors are used and to less common or activity values darker colors are preferred. Heatmap is also defined by the name of the shading matrix.
R - heatmap() Function
**Syntax: heatmap(data)
**Parameters:
- **data: It represent matrix data, such as values of rows and columns
**Return: This function draws a heatmap.
Create a Heatmap in R Programming Language
r `
Set seed for reproducibility
set.seed(110)
Create example data
data <- matrix(rnorm(100, 0, 5), nrow = 10, ncol = 10)
Column names
colnames(data) <- paste0("col", 1:10) rownames(data) <- paste0("row", 1:10)
Draw a heatmap
heatmap(data)
`
**Output:
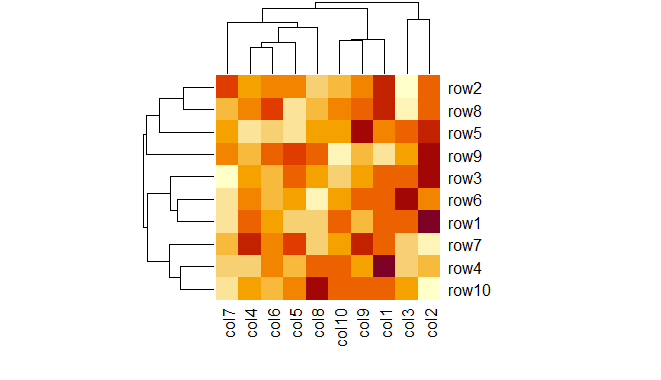
Heatmap in R Programming
Here, in the above example number of rows and columns are specified to draw heatmap with a given function.
Create heatmap in R using colorRampPalette
r `
Set seed for reproducibility
set.seed(110)
Create example data
data <- matrix(rnorm(100, 0, 5), nrow = 10, ncol = 10)
Column names
colnames(data) <- paste0("col", 1:10) rownames(data) <- paste0("row", 1:10)
Remove dendrogram
Manual color range
my_colors <- colorRampPalette(c("cyan", "darkgreen"))
Heatmap with manual colors
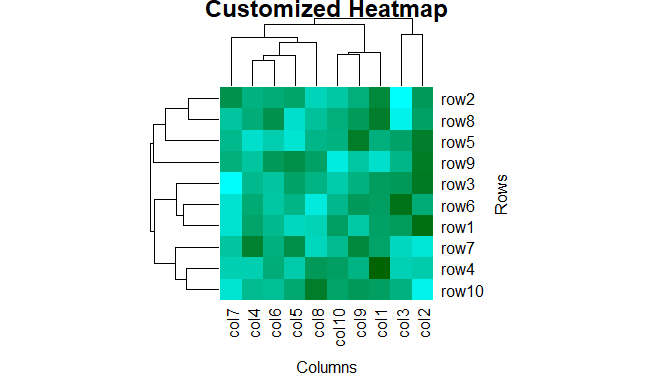
heatmap(data, col = my_colors(100))
`
**Output:

Heatmap in R Programming
In the above example heat map is drawn by using colorRampPalette to merge two different colors.
Heatmap in R with Title and Axis Labels
R `
Set seed for reproducibility
set.seed(110)
Create example data
data <- matrix(rnorm(100, 0, 5), nrow = 10, ncol = 10)
Column names
colnames(data) <- paste0("col", 1:10) rownames(data) <- paste0("row", 1:10)
Remove dendrogram
Manual color range
my_colors <- colorRampPalette(c("cyan", "darkgreen"))
Heatmap with manual colors
heatmap(data, col = my_colors(100), main = "Customized Heatmap", xlab = "Columns", ylab = "Rows")
`
**Output:
Heatmap in R Programming
Margins Around the Heatmap Plot
R `
Set seed for reproducibility
set.seed(110)
Create example data
data <- matrix(rnorm(100, 0, 5), nrow = 10, ncol = 10)
Column names
colnames(data) <- paste0("col", 1:10) rownames(data) <- paste0("row", 1:10)
Remove dendrogram
Manual color range
my_colors <- colorRampPalette(c("cyan", "darkgreen"))
Heatmap with margins around the plot
heatmap(data, col = my_colors(100), main = "Customized Heatmap", xlab = "Columns", ylab = "Rows", margins = c(5, 10))
`
**Output:
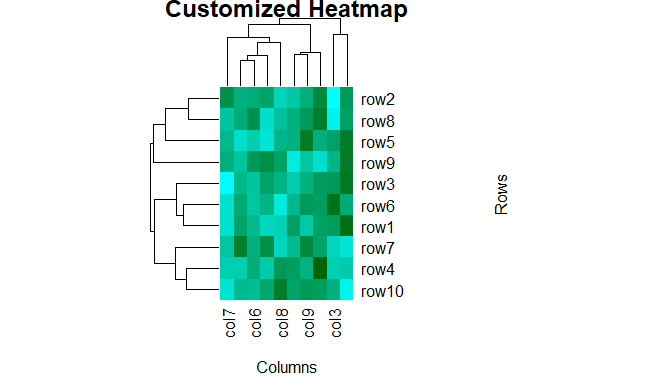
Heatmap in R Programming
Heatmap in R without Dendrogram
R `
Set seed for reproducibility
set.seed(110)
Create example data
data <- matrix(rnorm(100, 0, 5), nrow = 10, ncol = 10)
Column names
colnames(data) <- paste0("col", 1:10) rownames(data) <- paste0("row", 1:10)
Remove dendrogram
Manual color range
my_colors <- colorRampPalette(c("cyan", "darkgreen"))
Heatmap with margins around the plot
heatmap(data, col = my_colors(100), main = "Customized Heatmap", xlab = "Columns", ylab = "Rows", margins = c(5, 10),Colv = NA, Rowv = NA)
`
**Output:
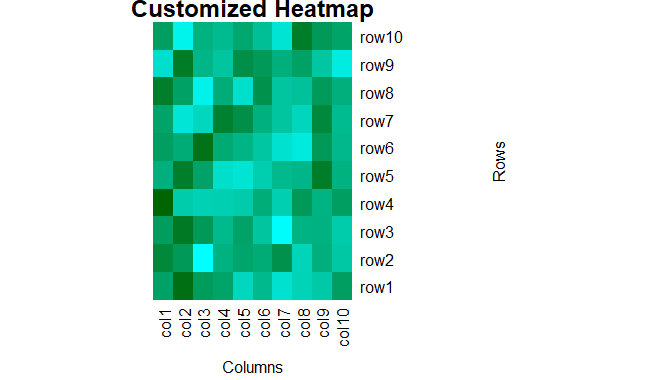
Heatmap in R Programming
Conclusion
Creating a heatmap in R provides a powerful visual representation of data patterns, allowing for easy identification of trends, clusters, and variations. Through the flexibility of the heatmap function and additional customization options, users can tailor the appearance of the heatmap to effectively communicate insights.