BSplines using Scipy (original) (raw)
B-Splines using Scipy
Last Updated : 4 Jul, 2025
B-splines, or basis splines, are an important tool in numerical analysis and computer graphics for curve fitting and data smoothing. They offer a flexible way to represent curves and surfaces through piecewise polynomial functions.
What are B-Splines?
A B-spline is a type of spline function that provides minimal support with respect to a given degree, smoothness, and domain partition. In simpler terms, they are piecewise polynomial functions defined over a sequence of intervals known as knots.
Mathematical Foundation of B-Splines
B-splines are defined by their degree n, a set of control points, and a knot vector. The degree of the spline determines the degree of the polynomial pieces that make up the spline. The knot vector is a sequence of parameter values that determine where and how the control points affect the B-spline curve.
The general form of a B-spline can be expressed as:
S(x) = \sum_{j=0}^{n-1} c_j B_{j,k;t}(x)
where
- B_{j,k;t}(x) are the B-spline basis functions of degree k
- t is the knot vector
- c_j are the coefficients.
Characteristics of B-Splines
- **Local Control: Changes to one part of a B-spline curve do not affect the entire curve. This property is due to the local support nature of B-spline basis functions.
- **Smoothness: The smoothness of a B-spline is determined by its degree and the multiplicity of its knots. For instance, cubic B-splines (k=3) provide continuous first and second derivatives.
- **Flexibility: B-splines can represent complex shapes with fewer control points compared to other types of splines.
Implementing B-Splines with SciPy
Python's SciPy library provides robust tools for working with B-splines. Here, we explore how to create and manipulate B-splines using SciPy's interpolate module.
To create a B-spline in SciPy, you need to define your knot vector, coefficients, and spline degree. Here's an example:
Python `
import numpy as np from scipy.interpolate import BSpline import matplotlib.pyplot as plt
Define knot vector, coefficients, and degree
t = [0, 1, 2, 3, 4, 5] c = [-1, 2, 0, -1] k = 2
Create a BSpline object
spl = BSpline(t, c, k)
Evaluate the spline at multiple points
x = np.linspace(1.5, 4.5, 50) y = spl(x)
plt.plot(x, y) plt.title('B-Spline Curve') plt.xlabel('x') plt.ylabel('S(x)') plt.grid(True) plt.show()
`
**Output:
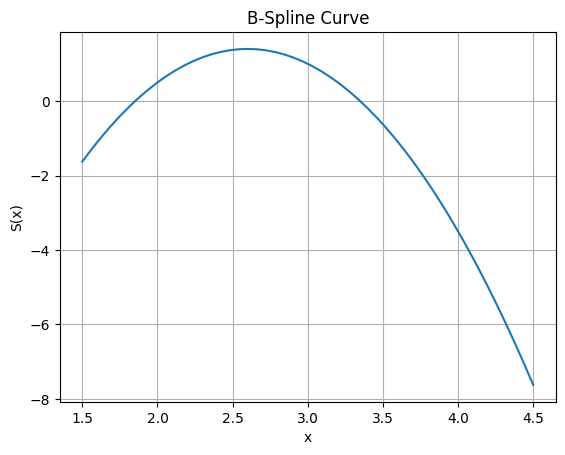
B-Splines with SciPy
This code snippet demonstrates how to define a simple quadratic B-spline using SciPy's BSpline class.
Evaluating and Visualizing B-Splines
To evaluate a spline at given points or visualize it:
- Use splev for evaluating splines at specific points.
- Use splrep to find the spline representation of data.
Here's an example using splrep and splev:
Python `
from scipy.interpolate import splrep, splev
Sample data
x = np.linspace(0, 10, 10) y = np.sin(x)
Find spline representation
tck = splrep(x, y)
Evaluate spline at new points
xnew = np.linspace(0, 10, 200) ynew = splev(xnew, tck)
Plotting
plt.plot(xnew, ynew) plt.scatter(x, y) plt.title('Spline Interpolation') plt.xlabel('x') plt.ylabel('S(x)') plt.show()
`
**Output:

B-Splines with SciPy
This example shows how to interpolate data using cubic splines.
Advanced Topics in B-Splines
1. Parametric Representation
In some cases, it's beneficial to represent curves parametrically using arc-length parameterization. This approach ensures uniform sampling along the curve's length:
Python `
from scipy.interpolate import splprep
Define parametric data
x = np.array([87., 98., 100., 95., 100., 108., 110., 118., 120., 117., 105., 100., 92., 90.]) y = np.array([42., 35., 32., 25., 18., 20., 27., 27., 35., 46., 45., 48., 55., 51.])
Create parametric spline representation
spline_params = splprep([x, y], s=0)[0]
Evaluate spline at equal arc-length intervals
points = splev(np.linspace(0, len(x), num=100), spline_params)
plt.plot(points[0], points[1]) plt.scatter(x, y) plt.title('Parametric Spline') plt.xlabel('x') plt.ylabel('y') plt.show()
`
**Output:

B-Splines with SciPy
This example demonstrates how to create parametric splines using equal arc-length intervals.
2. Smoothing Splines
Smoothing splines are used when you want to fit a curve that balances between fitting the data closely and maintaining smoothness:
Python `
from scipy.interpolate import UnivariateSpline
Sample noisy data
x = np.linspace(-3, 3, 50) y = np.exp(-x**2) + np.random.normal(0, .1, x.size)
Fit smoothing spline
spl = UnivariateSpline(x, y)
Plotting
xs = np.linspace(-3, 3, 1000) plt.plot(xs, spl(xs), 'r', lw=2) plt.scatter(x,y) plt.title('Smoothing Spline') plt.xlabel('x') plt.ylabel('S(x)') plt.show()
`
**Output:
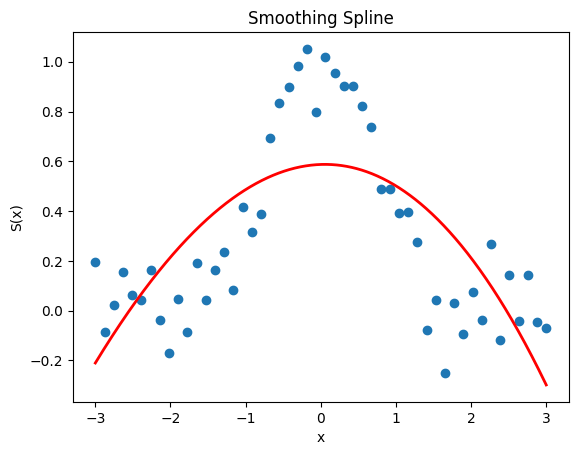
B-Splines with SciPy
This code illustrates how smoothing splines can be used for noise reduction while fitting data smoothly.
Applications of B-Splines
B-splines have numerous applications across various domains:
- **Data Smoothing: They can smooth noisy data while preserving essential trends.
- **Curve Fitting: Used in computer graphics for modeling complex shapes with precision.
- **Feature Selection: In machine learning for dimensionality reduction by capturing essential data patterns