Confidence and Prediction Intervals with Statsmodels (original) (raw)
Last Updated : 23 Jul, 2025
In statistical analysis, particularly in linear regression, understanding the uncertainty associated with predictions is crucial. **Confidence intervals and prediction intervals are two essential tools for quantifying this uncertainty. Confidence intervals provide a range within which the mean of the population is likely to lie, while prediction intervals give a range within which a new observation is likely to fall. This article delves into the technical aspects of these intervals using the Statsmodels library in Python.
Table of Content
- Introduction to Confidence and Prediction Intervals
- Visualizing Confidence and Prediction Intervals with Statsmodels
- Practical Considerations and Tips
Introduction to Confidence and Prediction Intervals
1. Confidence Intervals
A confidence interval for the mean provides a range of values within which the true population mean is likely to lie. It is constructed using the estimated mean and the standard error of the mean. The width of the interval is determined by the sample size, the variability of the data, and the desired confidence level.
For example, a 95% confidence interval means that if we were to take 100 different samples and compute a confidence interval for each sample, we would expect about 95 of the intervals to contain the true parameter value.
2. Prediction Intervals
A prediction interval, on the other hand, provides a range within which a new observation is likely to fall. It is constructed using the estimated mean and the standard error of the prediction.
The prediction interval is always wider than the confidence interval because it accounts for the variability of individual observations in addition to the variability of the mean.
Obtaining Confidence and Prediction Intervals with Statsmodels
Before we dive into the computations, let's set up our Python environment. We will need numpy, pandas, matplotlib, and statsmodels.
Python `
import numpy as np import pandas as pd import matplotlib.pyplot as plt import statsmodels.api as sm from statsmodels.sandbox.regression.predstd import wls_prediction_std
`
Building a Linear Regression Model
Let's create a simple linear regression model using synthetic data.
Python `
Generate synthetic data
np.random.seed(0) n = 100 x = np.linspace(0, 10, n) e = np.random.normal(size=n) y = 1 + 0.5 * x + 2 * e
Add a constant term for the intercept
X = sm.add_constant(x)
Fit the OLS model
model = sm.OLS(y, X).fit() print(model.summary())
`
Output:
OLS Regression Results ==============================================================================
Dep. Variable: y R-squared: 0.290
Model: OLS Adj. R-squared: 0.283
Method: Least Squares F-statistic: 40.09
Date: Wed, 07 Aug 2024 Prob (F-statistic): 7.34e-09
Time: 10:24:55 Log-Likelihood: -211.62
No. Observations: 100 AIC: 427.2
Df Residuals: 98 BIC: 432.5
Df Model: 1
Covariance Type: nonrobust
coef std err t P>|t| [0.025 0.975] const 1.4169 0.403 3.518 0.001 0.618 2.216
x1 0.4405 0.070 6.332 0.000 0.302 0.579
Omnibus: 0.397 Durbin-Watson: 1.841
Prob(Omnibus): 0.820 Jarque-Bera (JB): 0.556
Skew: -0.036 Prob(JB): 0.757
Kurtosis: 2.642 Cond. No. 11.7
Calculating Confidence Intervals
To calculate the confidence intervals for the model parameters, we can use the conf_int method provided by statsmodels.
Python `
Confidence intervals for the model parameters
conf_intervals = model.conf_int() print(conf_intervals)
`
Output:
[[0.6177732 2.21611259]
[0.3024626 0.57860665]]
For the fitted values, we can use the get_prediction method and then call summary_frame to get a DataFrame that includes the confidence intervals.
Python `
Get prediction results
pred = model.get_prediction(X) pred_summary = pred.summary_frame(alpha=0.05) # 95% confidence intervals
Extract confidence intervals
ci_lower = pred_summary['mean_ci_lower'] ci_upper = pred_summary['mean_ci_upper'] print(ci_lower) print(ci_upper)
`
Output:
0 0.617773
1 0.674288
2 0.730738
3 0.787121
4 0.843432
...
95 4.892791
96 4.925476
97 4.958091
98 4.990637
99 5.023119
Name: mean_ci_lower, Length: 100, dtype: float64
0 2.216113
1 2.248595
2 2.281141
3 2.313756
4 2.346441
...
95 6.395800
96 6.452111
97 6.508494
98 6.564944
99 6.621459
Name: mean_ci_upper, Length: 100, dtype: float64
Calculating Prediction Intervals
Prediction intervals can also be obtained using the get_prediction method. The summary_frame method will include columns for the prediction intervals.
Python `
Extract prediction intervals
pi_lower = pred_summary['obs_ci_lower'] pi_upper = pred_summary['obs_ci_upper'] print(pi_lower) print(pi_upper)
`
Output:
0 -2.687467
1 -2.640646
2 -2.593871
3 -2.547142
4 -2.500459
...
95 1.548899
96 1.591214
97 1.633482
98 1.675703
99 1.717879
Name: obs_ci_lower, Length: 100, dtype: float64
0 5.521353
1 5.563529
2 5.605751
3 5.648019
4 5.690333
...
95 9.739691
96 9.786374
97 9.833103
98 9.879878
99 9.926699
Name: obs_ci_upper, Length: 100, dtype: float64
Plotting Confidence and Prediction Intervals
Let's visualize the confidence and prediction intervals along with the data and the fitted regression line.
Python `
Plot the data
plt.scatter(x, y, label='Data')
plt.plot(x, model.fittedvalues, color='red', label='Fitted Line') plt.fill_between(x, ci_lower, ci_upper, color='red', alpha=0.3, label='95% CI') plt.fill_between(x, pi_lower, pi_upper, color='blue', alpha=0.2, label='95% PI')
plt.xlabel('X') plt.ylabel('Y') plt.legend() plt.show()
`
Output:
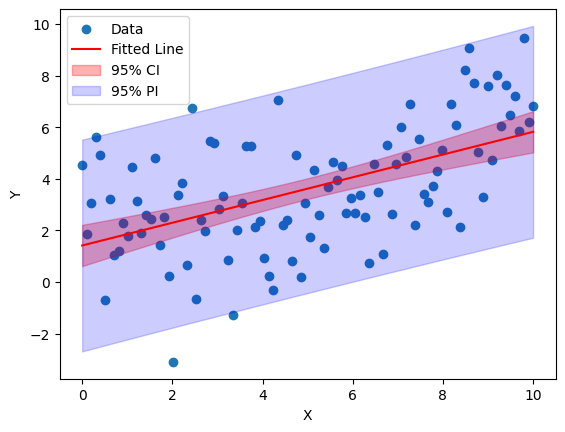
Confidence and Prediction Intervals
Practical Considerations and Tips
1. Choosing Alpha
The alpha parameter in the summary_frame method determines the significance level for the intervals. For a 95% interval, alpha should be set to 0.05. Adjust this parameter according to your needs.
2. Interpreting Intervals
- **Confidence Interval: Indicates where the true regression line lies with a certain level of confidence.
- **Prediction Interval: Indicates where a new observation is likely to fall, considering both the uncertainty in the regression line and the variability in the data.
3. Model Assumptions
Both confidence and prediction intervals rely on the assumptions of the linear regression model, including linearity, homoscedasticity, and normality of errors. Violations of these assumptions can lead to inaccurate intervals.
4. Handling Outliers
Outliers can significantly affect the width of the intervals. Consider using robust regression techniques if your data contains outliers.
Conclusion
In this article, we have demonstrated how to compute and interpret confidence and prediction intervals using the statsmodels library in Python. These intervals are essential tools for understanding the uncertainty in your predictions and making informed decisions based on your model.