Panel Data Analysis in StatsModels (original) (raw)
Last Updated : 30 Jun, 2025
Panel data (also known as longitudinal or cross-sectional time-series data) consists of observations on multiple entities (such as individuals, firms, or states) tracked over time. This data structure allows analysts to:
- Control for unobserved individual multiplicity.
- Study dynamic behaviors and trends
- Improve the efficiency of econometric estimates
Panel data analysis is widely used in economics, social sciences, and business research for its ability to provide richer information compared to purely cross-sectional or time-series data.
**Types of Panel Data Models
The main models used in panel data analysis are:
- **Pooled OLS Regression: Ignores the panel structure, treats all observations as independent.
- **Fixed Effects Model (FE): Controls for time-invariant characteristics by using entity-specific intercepts.
- **Random Effects Model (RE): Assumes entity-specific effects are random and uncorrelated with regressors.
Panel Data Analysis with StatsModels
While StatsModels does not have a dedicated high-level panel data API, it supports panel analysis through:
- **Pooled OLS: Standard OLS regression
- **Fixed Effects: By including entity/time dummies or using the MixedLM (Mixed Linear Model) class
- **Random Effects: Using MixedLM for random intercepts
**Step-by-Step Implementation
**1. Import Required Libraries
- import pandas as pd : For data manipulation and DataFrame operations.
- import numpy as np : For numerical operations and random number generation.
- import statsmodels.api as sm : For core statistical models (like OLS regression).
- import statsmodels.formula.api as smf : For formula-based statistical models (like MixedLM). Python `
import pandas as pd import numpy as np import statsmodels.api as sm import statsmodels.formula.api as smf
`
**2. Simulate Panel Data
A balanced panel is created dataset with 5 states and 10 years each, including income (independent variable) and violent (dependent variable):
Python `
np.random.seed(0) states = ['A', 'B', 'C', 'D', 'E'] years = list(range(2000, 2010)) data = []
for state in states: for year in years: income = np.random.normal(50000, 5000) # Add a state effect and a small effect of income on violent violent = np.random.normal(100, 10) + 0.001 * income + (states.index(state) * 5) data.append([state, year, income, violent])
df = pd.DataFrame(data, columns=['state', 'year', 'income', 'violent'])
`
**3. Set Panel Structure
Set a multi-index for the panel structure,organizes data for panel analysis(not strictly required for modeling, but good practice):
Python `
df = df.set_index(['state', 'year'])
`
**4. Pooled OLS Regression (Baseline)
This model ignores the panel structure and treats all observations as independent:
Python `
X = sm.add_constant(df['income']) y = df['violent'] model_pooled = sm.OLS(y, X) results_pooled = model_pooled.fit() print("Pooled OLS Results:") print(results_pooled.summary())
`
**Output
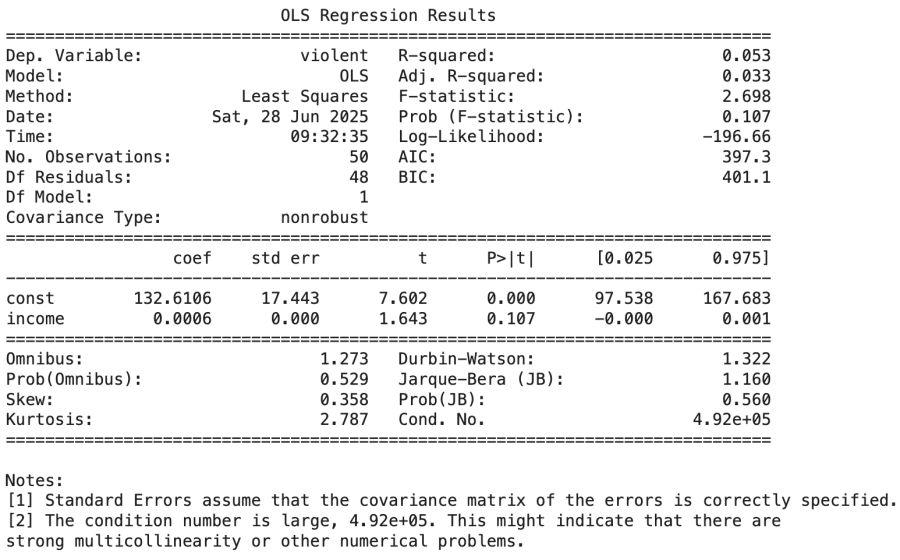
Pooled OLS Regression
**5. Fixed Effects Model (Entity Dummies Approach)
This model controls for unobserved, time-invariant differences between entities(states) by adding state dummies:
Python `
df_reset = df.reset_index()
Create dummy variables for state (excluding the first to avoid multicollinearity)
df_fe = pd.get_dummies(df_reset, columns=['state'], drop_first=True) X_fe = sm.add_constant(df_fe[['income'] + [col for col in df_fe.columns if col.startswith('state_')]]) y_fe = df_fe['violent'] model_fe = sm.OLS(y_fe, X_fe) results_fe = model_fe.fit() print("\nFixed Effects (State Dummies) Results:") print(results_fe.summary())
`
**Output

Fixed Effects Model
**6. Random Effects Model (Mixed Linear Model)
This model treats state effects as random variables across states, assuming these effects are uncorrelated with the regressors:
Python `
md = smf.mixedlm("violent ~ income", df_reset, groups="state") mdf = md.fit() print("\nRandom Effects (MixedLM) Results:") print(mdf.summary())
`
**Output
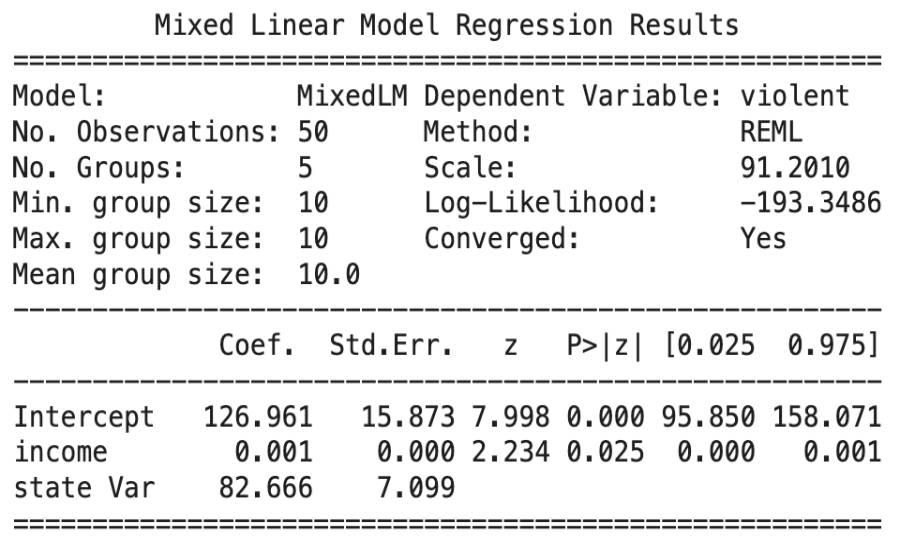
Random Effects Model
**You can download the complete source code from here : Panel Data Analysis in StatsModels