Exploring Data Distribution | Set 1 (original) (raw)
Last Updated : 21 Mar, 2024
Whenever we work in data science and machine learning, our approach of handling the data and finding something useful out of it is based on the distribution of the data. Distribution means that how data can be present in different possible ways, the percentage of specific data, identifying the outliers. So, data distribution is the way of using graphical methods to organize and display useful information.Terms related to Exploration of Data Distribution
-> Boxplot -> Frequency Table -> Histogram -> Density Plot
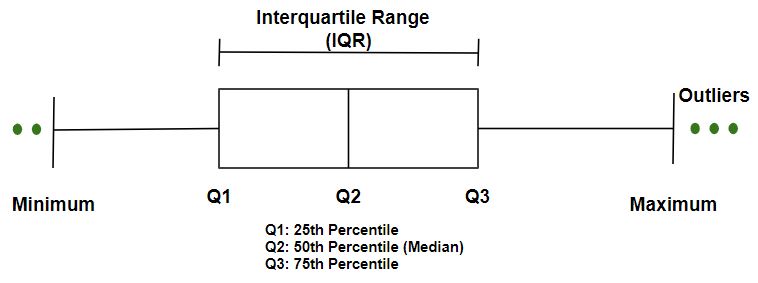
- Boxplot : It is based on the percentiles of the data as shown in the figure below. The top and bottom of the boxplot are 75th and 25th percentile of the data. The extended lines are known as whiskers that includes the range of rest of the data.
 Code #1 : Loading Libraries Python3 1==
 import numpy as np import pandas as pd import seaborn as sns import matplotlib.pyplot as pltCode #2: Loading Data Python3 1== `
data = pd.read_csv("../data/state.csv")
Adding a new column with derived data
data['PopulationInMillions'] = data['Population']/1000000
print (data.head(10))**Output :** 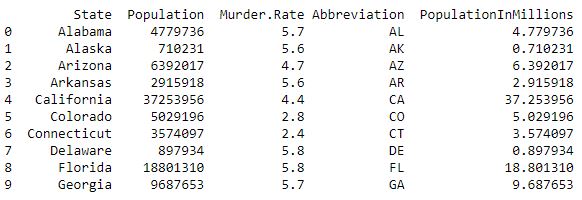 **Code #3 :** BoxPlot Python3 1==
BoxPlot Population In Millions
fig, ax1 = plt.subplots()
fig.set_size_inches(9, 15)
ax1 = sns.boxplot(x = data.PopulationInMillions, orient ="v")
ax1.set_ylabel("Population by State in Millions", fontsize = 15)
ax1.set_title("Population - BoxPlot", fontsize = 20)
` Output : 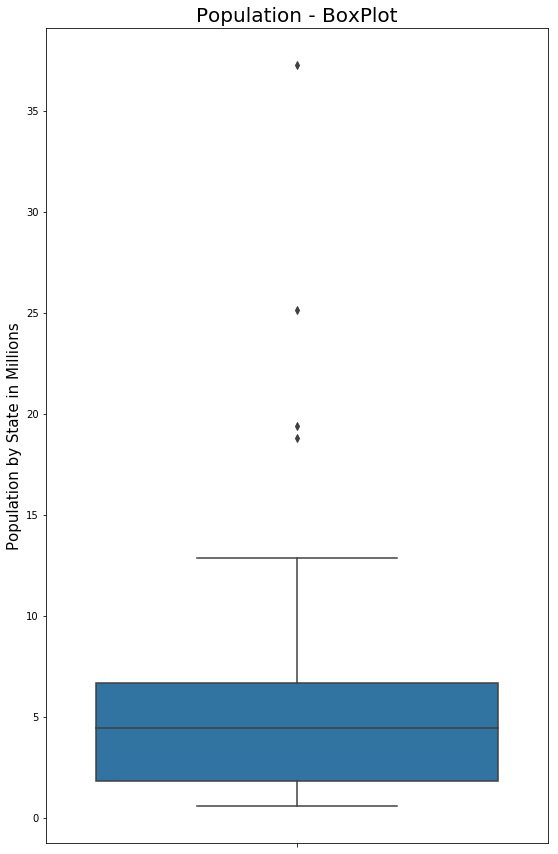
- Frequency Table : It is a tool to distribute the data into equally spaced ranges, segments and tells us how many values fall in each segment.Code #1: Adding a column to perform crosstab and groupby functionality. Python3 1== `
Perform the binning action, the bins have been
chosen to accentuate the output for the Frequency Table
data['PopulationInMillionsBins'] = pd.cut(
data.PopulationInMillions, bins =[0, 1, 2, 5, 8, 12, 15, 20, 50])
print (data.head(10))**Output :** 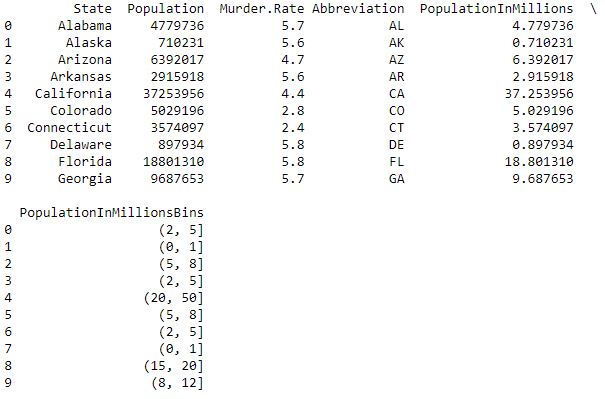 **Code #2:** Cross Tab - a type of Frequency Table Python3 1==
Cross Tab - a type of Frequency Table
pd.crosstab(data.PopulationInMillionsBins, data.Abbreviation, margins = True)**Output :** 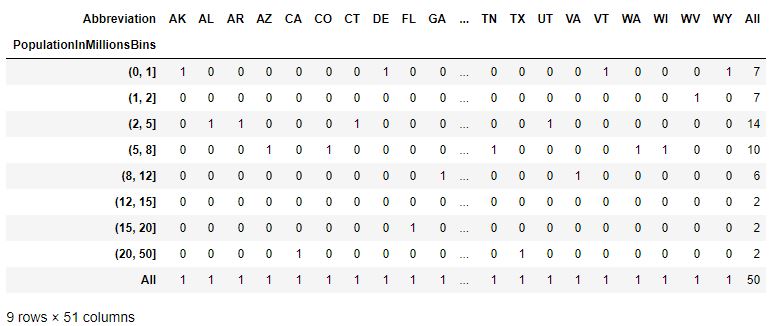 **Code #3:** GroupBy - a type of Frequency Table Python3 1==
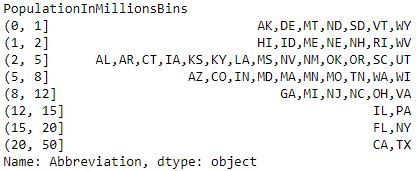
Groupby - a type of Frequency Table
data.groupby(data.PopulationInMillionsBins)['Abbreviation'].apply(', '.join)
` Output :