Partition Value | Quartiles, Deciles and Percentiles (original) (raw)
Last Updated : 30 Jul, 2025
Partition values are statistical measures that divide a dataset into equal parts to help in understanding the distribution and spread of data by indicating where certain percentages of the data fall. The most commonly used partition values are quartiles, deciles, and percentiles.
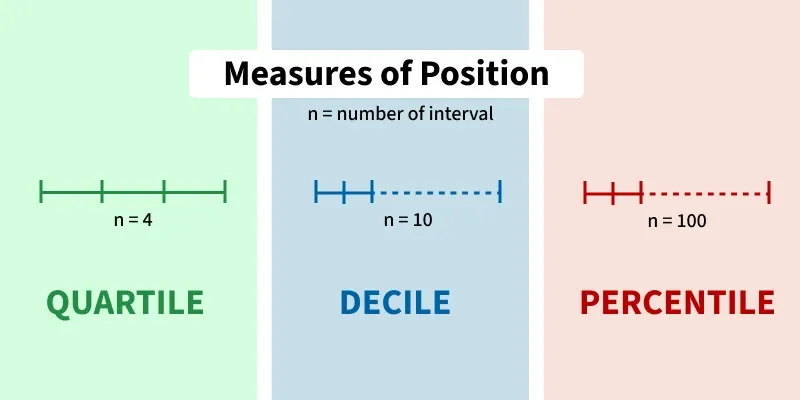
Quartiles, deciles, and Percentiles of partition values represent various perspectives on the same subject. To put it another way, these are values that partition the same collection of observations in several ways. As a result, it can divide these into many equal parts.
- Each quartile splits the total area into **4 equal parts (0.25 each).
- Each decile splits the total area into **10 equal parts (0.10 each).
- Each percentile splits the total area into **100 equal parts (0.01 each).
Quartiles
Quartiles divide a dataset into **four equal parts, each containing 25% of the data.
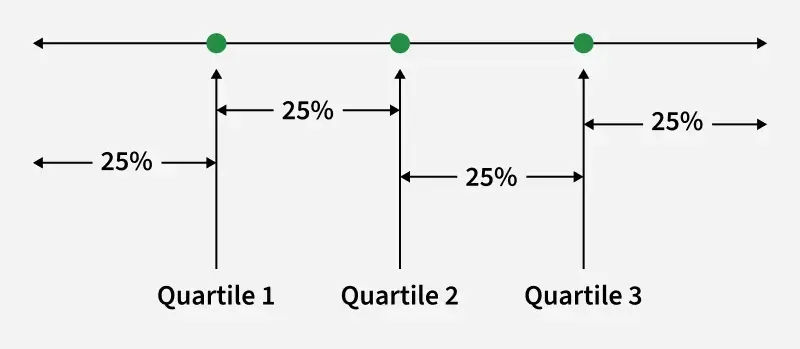
The three quartiles are:
- **Q1 (First Quartile/ Lower Quartile): 25% of the data fall below this value.
- **Q2 (Second Quartile / Median): 50% of the data fall below this value.
- **Q3 (Third Quartile / Upper Quartile): 75% of the data fall below this value.
The general equation to find the position of the Quartile is:
Q_k=\frac{k(N+1)}{4},for \:k=1,2, and \: 3.
When we put the values we get,
Q_{1}=[\frac{N+1}{4}]^{th}~item
Q_{2}=[\frac{N+1}{2}]^{th}~item
Q_{3}=[\frac{3(N+1)}{4}]^{th}~item
where, n is the total number of observations, Q1 is First Quartile, Q2 is Second Quartile, and Q3 is Third Quartile.
Example 1:
Calculate the lower and upper quartiles of the following weights in the family: 25, 17, 32, 11, 40, 35, 13, 5, and 46.
| Age (in years) | Number of Employees |
|---|---|
| 500 - 600 | 10 |
| 600 - 700 | 12 |
| 700 - 800 | 16 |
| 800 - 900 | 14 |
| 900 - 1000 | 8 |
Solution:
Age (in years) Number of Employee Cumulative 500 - 600 10 10 600 - 700 12 22****(m)** 700 - 800 16 (**f) 38 800 - 900 14 52 900 - 1000 8 60 First of all organise the numbers in ascending order. 5, 11, 13, 17, 25, 32, 35, 40, 46
Lower quartile, Q_{1}=[\frac{N+1}{4}]^{th}~item
Q_{1}=[\frac{9+1}{4}]^{th}~item
Q1 = 2.5th term
As per the quartile formula;
Q1 = 2nd term + 0.5(3rd term - 2nd term)
Q1 = 11 + 0.5(13 - 11) = 12
**Q 1 **= 12
Upper Quartile, Q_{3}=[\frac{3(N+1)}{4}]^{th}~item
Q_{3}=[\frac{3(9+1)}{4}]^{th}~item
Q3 = 7.5th item
Q3 = 7th term + 0.5(8th term - 7th term)
Q3 = 35 + 0.5(40 - 35) = 37.5
**Q 3 = 37.5
Example 2:
Calculate Q1 and Q3 for the data related to the age in years of 99 members in a housing society.
| Age (in years) | Number of Members |
|---|---|
| 10 | 20 |
| 18 | 5 |
| 25 | 10 |
| 35 | 30 |
| 40 | 20 |
| 45 | 14 |
**Solution:
Age (in years) Number of Members Cumulative Frequency 10 20 20 18 5 **25 25 10 35 35 30 **65 40 20 85 45 14 99 Q_{1}=[\frac{N+1}{4}]^{th}~item
Q_{1}=[\frac{99+1}{4}]^{th}~item
Q1 = 25th item
Now, the 25th item falls under the cumulative frequency of 25 and the age against this cf value is 18.
**Q 1 **= 18 years
Q_{3}=[\frac{3(N+1)}{4}]^{th}~item
Q_{3}=[\frac{3(99+1)}{4}]^{th}~item
Q3 = 75th item
Now, the 75th item falls under the cumulative frequency of 85 and the age against this cf value is 40.
**Q 3 = 40 years
**Example 3:
Determine the quartiles Q1 and Q3 for the company's salaries listed below.
| Salaries(per day in ₹) | Number of Employees |
|---|---|
| 500 - 600 | 10 |
| 600 - 700 | 12 |
| 700 - 800 | 16 |
| 800 - 900 | 14 |
| 900 - 1000 | 8 |
**Solution:
Salaries(per day in ₹) Number of Employee Cumulative Frequency 500 - 600 10 10(m1) 600 - 700 12(f1) 22 700 - 800 16 38(m2) 800 - 900 14(f2) 52 900 - 1000 8 60 Q_{1}~Class=\frac{N}{4}
Q_{1}~Class=\frac{60}{4}
= 15th item
Now, the 15th item falls under the cumulative frequency 22 and the salary against this cf value lies in the group 600-700.
Q_{1}=l_{1}+\frac{\frac{N}{4}-m_{1}}{f_{1}}\times{c_{1}}
Q_{1}=600+\frac{\frac{60}{4}-10}{12}\times{100}
Q1 = ₹641.67
Q_{3}~Class=\frac{3N}{4}
Q_{3}~Class=\frac{180}{4}
Q3 = 45th item
Now, the 45th item falls under the cumulative frequency 52 and the salary against this cf value lies in the group 800-900.
Q_{3}=l_{1}+\frac{\frac{3N}{4}-m_{3}}{f_{3}}\times{c_{3}}
Q_{3}=800+\frac{\frac{180}{4}-38}{14}\times{100}
Q_{3}=800+\frac{7}{14}\times{100}
Q_{3}=800+50
Deciles
The deciles involve dividing a dataset into ten equal parts based on numerical values, each containing 10% of the data.
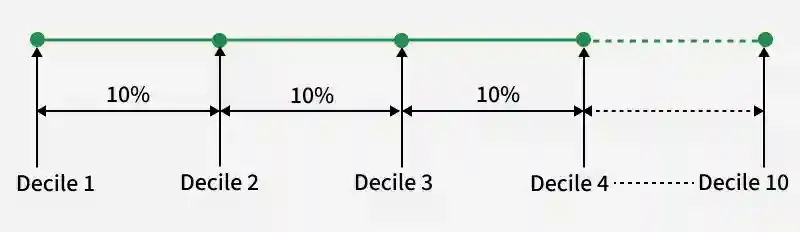
The three quartiles are:
- **D1 (First Decile): 10% of the data.
- **D5 (Fifth Decile / Median): 50% of the data fall below this value.
- **D9 (Ninth Decile): 90% of the data fall below this value.
The general equation to find the position of the Quartile is:
D_k=\frac{k(N+1)}{10},for \:k=1,2, \dots 9.
When substituting for each, we get,
D_{1}=[\frac{N+1}{10}]^{th}~item
D_{2}=[\frac{2(N+1)}{10}]^{th}~item
\dots
D_{9}=[\frac{9(N+1)}{10}]^{th}~item
where, n is the total number of observations, D1 is First Decile, D2 is Second Decile, ... D9 is Ninth Quartile.
**Example 1: Calculate the D1 and D5 from the following weights in a family: 25, 17, 32, 11, 40, 35, 13, 5, and 46.
**Solution:
First of all, organise the numbers in ascending order.
5, 11, 13, 17, 25, 32, 35, 40, 46
D_{1}=[\frac{N+1}{10}]^{th}~item
D_{1}=[\frac{9+1}{10}]^{th}~item
**D 1 = 1 st item = 5
D_{5}=[\frac{5(N+1)}{10}]^{th}~item
D_{1}=[\frac{5(9+1)}{10}]^{th}~item
**D 5 = 5 th item = 25
**Example 2: Calculate D2 and D6 for the data related to the age (in years) of 99 members in a housing society.
| Age (in years) | Number of Members |
|---|---|
| 10 | 20 |
| 18 | 5 |
| 25 | 10 |
| 35 | 30 |
| 40 | 20 |
| 45 | 14 |
**Solution:
Age (in years) Number of Members Cumulative Frequency 10 20 20 18 5 **25 25 10 35 35 30 **65 40 20 85 45 14 99 D_{2}=[\frac{2(N+1)}{10}]^{th}~item
D_{2}=[\frac{2(99+1)}{10}]^{th}~item
D2 = 20th item
Now, the 20th item falls under the cumulative frequency of 25 and the age against this cf value is 18.
**D 2 = 18 years
Similarly D_{6}=[\frac{6(N+1)}{10}]^{th}~item
D_{6}=[\frac{6(99+1)}{10}]^{th}~item
D6 = 60th item
Now, the 60th item falls under the cumulative frequency of 65 and the age against this cf value is 35.
**D 6 = 35 years
**Example 3: Determine D4 for the company's salary listed below.
| Salaries(per day in ₹) | Number of Employees |
|---|---|
| 500 - 600 | 10 |
| 600 - 700 | 12 |
| 700 - 800 | 16 |
| 800 - 900 | 14 |
| 900 - 1000 | 8 |
**Solution:
Salaries(per day in ₹) Number of Employee Cumulative Frequency 500 - 600 10 10 600 - 700 12 22****(m)** 700 - 800 16****(f)** 38 800 - 900 14 52 900 - 1000 8 60 In case N is an even number, the following formula is used:
D_{4}=[\frac{4N}{10}]^{th}~item
D_{4}=[\frac{4(60)}{10}]^{th}~item
D4 = 24th item
Now, the 24th item falls under the cumulative frequency 22 and the salary against this cf value lies in the group 700-800.
D_{4}=l+\frac{\frac{4(N)}{10}-m}{f}\times{c}
D_{4}=700+\frac{\frac{4(60)}{10}-22}{16}\times{100}
**D 4 = ₹712.5
Percentiles
_Centiles are another term for _percentiles. Percentiles divide a dataset into **100 equal parts, with each percentile representing the value below which a certain percentage of the data falls. These percentiles are commonly denoted as **P1, P2, P3, ..., P99.1, P2, P3,..P99.
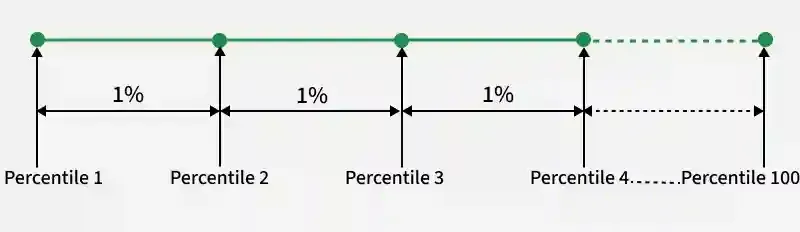
**For example:
- **P1: 1% of the data is less than or equal to this value.
- **P50: 50% of the data is less than or equal to this value (also called the **median).
- **P90: 90% of the data is less than or equal to this value (commonly used in performance benchmarking).
The Three Quartiles (special percentiles)
- **P25: 25th percentile (also known as **Q1) – 25% of the data is below this value.
- **P50: 50th percentile (also known as **Q2 or the **median) – 50% of the data is below this value.
- **P75: 75th percentile (also known as **Q3) – 75% of the data is below this value.
The general equation to find the position of the Quartile is:
P_k=\frac{k(N+1)}{100},for \:k=1,2, \dots 99.
When substituting for each, we get,
P_{1}=[\frac{N+1}{100}]^{th}~item
P_{2}=[\frac{2(N+1)}{100}]^{th}~item
\dots
D_{99}=[\frac{99(N+1)}{100}]^{th}~item
where, n is the total number of observations, P1 is First Percentile, P2 is Second Percentile, ... P99 is Ninety Ninth Percentile.
**Example 1: Calculate the P20 and P90 from the following weights in the family: 25, 17, 32, 11, 40, 35, 13, 5, and 46.
Solution:
First of all, organise the numbers in ascending order.
5, 11, 13, 17, 25, 32, 35, 40, 46
P_{20}=[\frac{20(N+1)}{100}]^{th}~item
P_{20}=[\frac{20(9+1)}{100}]^{th}~item
P20 = 2nd item
**P 20 = 11
P_{90}=[\frac{90(N+1)}{100}]^{th}~item
P_{90}=[\frac{90(9+1)}{100}]^{th}~item
P90 = 9th item
**P 90 = 40
**Example 2: Calculate P10 and P75 for the data related to the age (in years) of 99 members in a housing society.
| Age (in years) | Number of Members |
|---|---|
| 10 | 20 |
| 18 | 5 |
| 25 | 10 |
| 35 | 30 |
| 40 | 20 |
| 45 | 14 |
**Solution:
P_{10}=[\frac{10(N+1)}{100}]^{th}~item
P_{10}=[\frac{10(99+1)}{100}]^{th}~item
P10 = 10th item
Now, the 10th item falls under the cumulative frequency of 20 and the age against this cf value is 10.
**P 10 = 10 years
P_{75}=[\frac{75(N+1)}{100}]^{th}~item
P_{75}=[\frac{75(99+1)}{100}]^{th}~item
P75 = 75th item
Now, the 75th item falls under the cumulative frequency of 85 and the age against this cf value is 40.
**P 75 **= 40 years
**Example 3: Determine the value of P50 for the company's salary listed below.
| Salaries(per day in ₹) | Number of Employees |
|---|---|
| 500 - 600 | 10 |
| 600 - 700 | 12 |
| 700 - 800 | 16 |
| 800 - 900 | 14 |
| 900 - 1000 | 8 |
**Solution:
Salaries(per day in ₹) Number of Employee 500 - 600 10 600 - 700 12 700 - 800 16 800 - 900 14 900 - 1000 8 In case N is an even number, the following formula is used:
P_{50}=[\frac{50(N)}{100}]^{th}~item
P_{50}=[\frac{50(60)}{100}]^{th}~item
P50 = 30th item
Now, the 30th item falls under the cumulative frequency 38 and the salary against this cf value lies between 700-800.
P_{50}=l+\frac{\frac{50(N)}{100}-m}{f}\times{c}
P_{50}=700+\frac{\frac{50(60)}{100}-22}{16}\times{100}
P_{50}=700+\frac{30-22}{16}\times{100}
**P 50 = ₹750
Related Articles
Practice Questions on Quartiles, Deciles, and Percentiles
**Question 1: Given the dataset: 5, 7, 8, 12, 15, 16, 18, 20, 22, 25, find the quartiles Q1, Q2, and Q3.
**Question 2: Consider the dataset: 30, 35, 40, 45, 50, 55, 60, 65, 70, 75, 80, 85, 90. Calculate the deciles D3, D5, and D7.
Question 3: Given the dataset: 10, 20, 30, 40, 50, 60, 70, 80, 90, 100, determine the 25th percentile P25 and the 75th percentile P75
**Question 4: Using the dataset: 1, 4, 7, 8, 10, 12, 14, 15, 18, 20, 22, find the 40th percentile P40 and the 90th percentile P90.