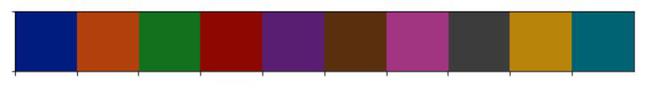
Seaborn Color Palette (original) (raw)
In this article, We are going to see seaborn color_palette(), which can be used for coloring the plot. Using the palette we can generate the point with different colors.
**Example:
Python `
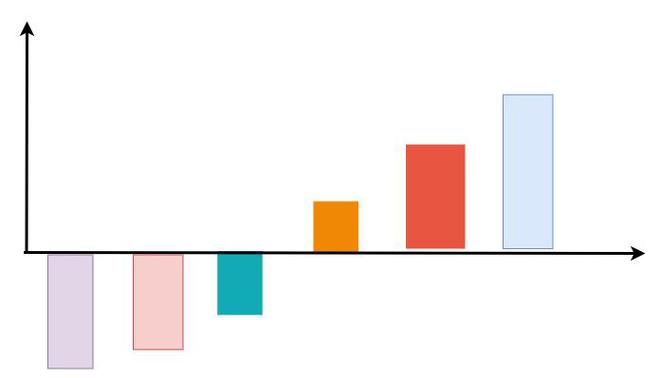
import seaborn as sns import matplotlib.pyplot as plt
Set a Seaborn color palette
sns.set_palette("Set2")
Create some example data
data = [3, 5, 7, 9, 2, 4, 6, 8]
Create a simple bar plot using the set color palette
sns.barplot(x=range(len(data)), y=data)
plt.show()
`
**Output:
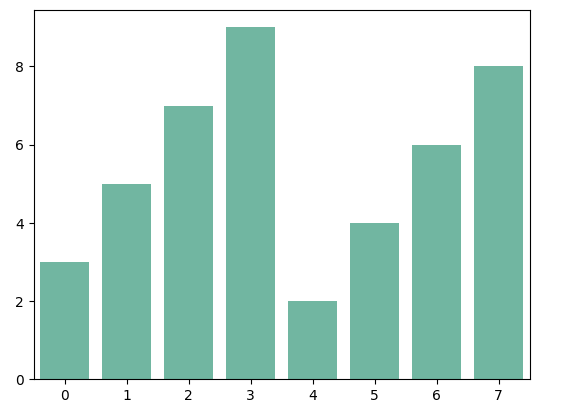
Color Palette
**Explanation:
- **sns.set_palette("Set2"): This sets the color palette to "Set2", one of Seaborn's predefined color palettes.
- **sns.barplot(): This creates a bar plot using the data with the selected color palette.
- **plt.show(): This displays the plot.
**Syntax:
seaborn.color_palette( palette=None , n_colors=None , desat=None)
Parameters:
- palette: Name of palette or None to return current palette.
- n_colors: Number of colors in the palette.
- desat: Proportion to desaturate each color.
Returns: list of RGB tuples or matplotlib.colors.Colormap
Seaborn Color Palette Types
Seaborn offers several predefined color palettes that can be broadly classified into different categories based on their intended use and the types of visualization.
**We can classify the different ways for using color_palette() types −
- Qualitative
- Sequential
- Diverging
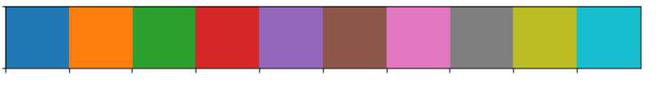
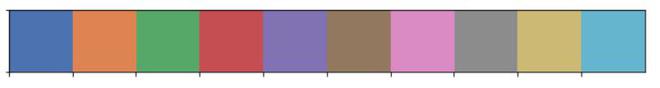
**1. Qualitative
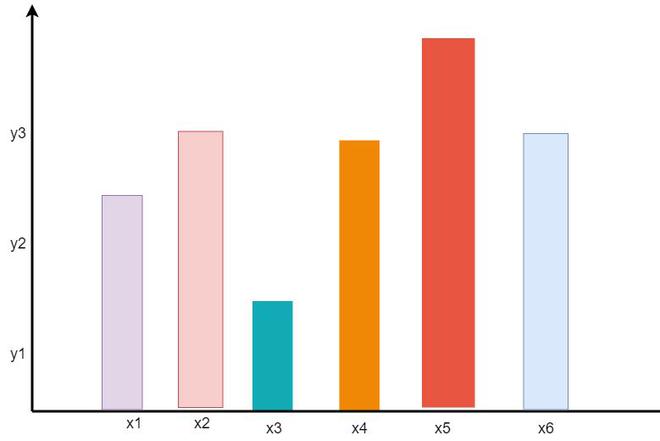
A qualitative palette is used when the variable is categorical in nature, the color assigned to each group need to be distinct. Each possible value of the variable is assigned one color from a qualitative palette within a plot as shown in figure.
Python `
from matplotlib import pyplot as plt import seaborn as sns
cp = sns.color_palette() sns.palplot(cp) plt.show()
`
Output:
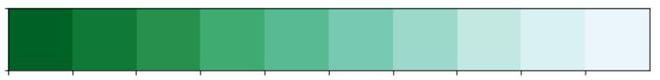
**2. Sequential
In sequential palettes color moved sequentially from a lighter to a darker. When the variable assigned to be colored is numeric or has inherently ordered values, then it can be depicted with a sequential palette as shown in figure.
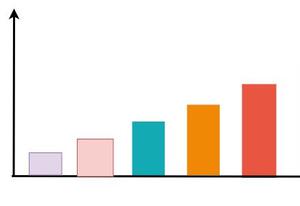
Python `
from matplotlib import pyplot as plt import seaborn as sns
sns.palplot(sns.color_palette("Greys")) plt.show()
`
Output:

**3. Diverging
When we work on mixed value like +ve and -ve(low and high values) then diverging palette is the best suit for visualization.
Python `
from matplotlib import pyplot as plt import seaborn as sns
sns.palplot(sns.color_palette("terrain_r", 7)) plt.show()
`
Output:

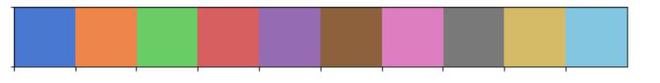
**Let's understand this with some examples:
In the below example we have used sns.color_palette() to construct a colormap and sns.palplot() to display the colors present in the colormap with "deep" attributes.
Python `
import pandas as pd import seaborn as sns
sns.palplot(sns.color_palette("deep", 10))
`
Output:
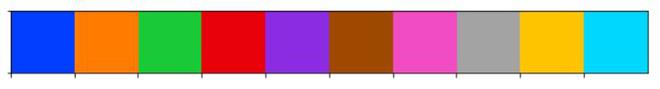
**Example 2: In this example, we have used sns.color_palette() to construct a colormap and sns.palplot() to display the colors present in the colormap with "muted" attributes.
Python `
import pandas as pd import seaborn as sns
sns.palplot(sns.color_palette("muted", 10))
`
Output:
**Example 3: In this example, we have used sns.color_palette() to construct a colormap and sns.palplot() to display the colors present in the colormap with "bright" attributes.
Python `
import pandas as pd import seaborn as sns
sns.palplot(sns.color_palette("bright", 10))
`
Output:
**Example 4: In this example, we have used sns.color_palette() to construct a colormap and sns.palplot() to display the colors present in the colormap with "dark" attributes.
Python `
import pandas as pd import seaborn as sns
sns.palplot(sns.color_palette("dark", 10))
`
Output:
In this example, we have used sns.color_palette() to construct a colormap and sns.palplot() to display the colors present in the colormap with "BuGn_r" attributes.
Python `
import pandas as pd import seaborn as sns
sns.palplot(sns.color_palette("BuGn_r", 10))
`
Output:
If we want to create our own color palette and set it as the current color palette , we can do as following:
Python `
import pandas as pd import seaborn as sns
color = ["green", "White", "Red", "Yellow", "Green", "Grey"] sns.set_palette(color) sns.palplot(sns.color_palette())
`