Signal Filtering with scipy (original) (raw)
Last Updated : 23 Jul, 2025
Signal filtering is a fundamental technique in signal processing used to enhance, clean or isolate specific components of a signal by removing unwanted noise or frequencies. It plays an important role in domains like audio processing, biomedical engineering, communications and data analysis. With Python's SciPy library, particularly scipy.signal module provides a robust set of tools to design and apply various digital filters.
Signal Filtering Techniques
1. Butterworth Low pass Filter
- Butterworth Low pass Filter removes high frequency noise by allowing frequencies below the cutoff (100 Hz) to pass smoothing the signal.
- A noisy signal is created by combining sinusoids and random noise and a Butterworth low pass filter removes frequencies above 100 Hz using zero phase filtering then the original and filtered signals are plotted for comparison. Python `
import numpy as np import matplotlib.pyplot as plt from scipy.signal import butter, filtfilt
fs = 1000 t = np.linspace(0, 1, fs, endpoint=False) signal = np.sin(2np.pi50t) + np.sin(2np.pi120t) + 0.5*np.random.randn(fs)
def butter_lowpass_filter(data, cutoff, fs, order=4): nyq = 0.5 * fs normal_cutoff = cutoff / nyq b, a = butter(order, normal_cutoff, btype='low') return filtfilt(b, a, data)
cutoff = 100
filtered = butter_lowpass_filter(signal, cutoff, fs)
plt.figure(figsize=(10,4)) plt.plot(t, signal, label='Original Signal') plt.plot(t, filtered, label='Low-pass Filtered', color='blue') plt.title('Butterworth Low-pass Filter') plt.xlabel('Time [s]') plt.ylabel('Amplitude') plt.legend() plt.show()
`
**Output:
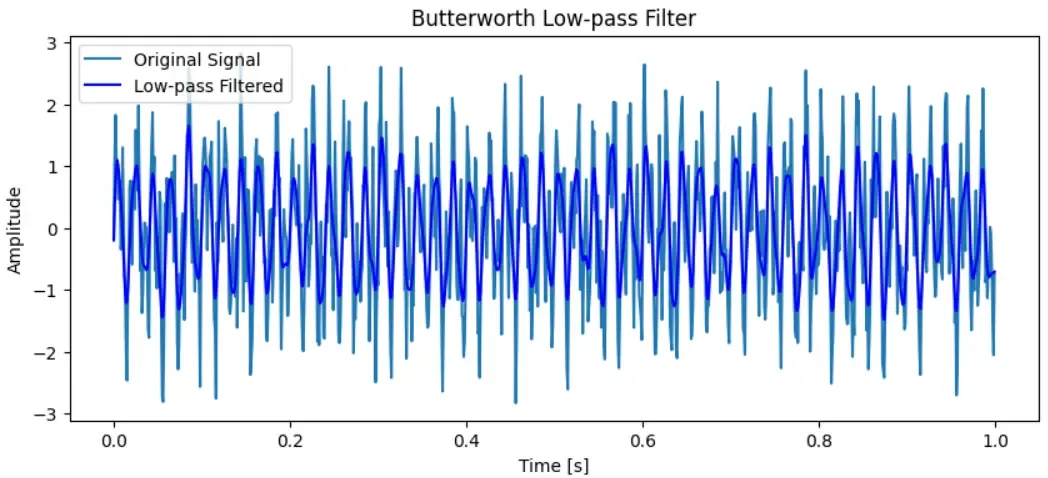
Output of Butterworth Low pass Filter
2. Butterworth High pass Filter
- Butterworth High pass Filter removes low frequency components below the cutoff (100 Hz) highlighting higher frequency details.
- A Butterworth high pass filter is applied to remove frequencies below 100 Hz from the signal. The filtfilt function ensures zero phase distortion during filtering. The filtered signal is plotted alongside the original to show the high frequency components retained. Python `
def butter_highpass_filter(data, cutoff, fs, order=4):
nyq = 0.5 * fs
normal_cutoff = cutoff / nyq
b, a = butter(order, normal_cutoff, btype='high')
return filtfilt(b, a, data)
cutoff = 100
filtered = butter_highpass_filter(signal, cutoff, fs)
plt.figure(figsize=(10,4)) plt.plot(t, signal, label='Original Signal') plt.plot(t, filtered, label='High-pass Filtered', color='red') plt.title('Butterworth High-pass Filter') plt.xlabel('Time [s]') plt.ylabel('Amplitude') plt.legend() plt.show()
`
**Output:
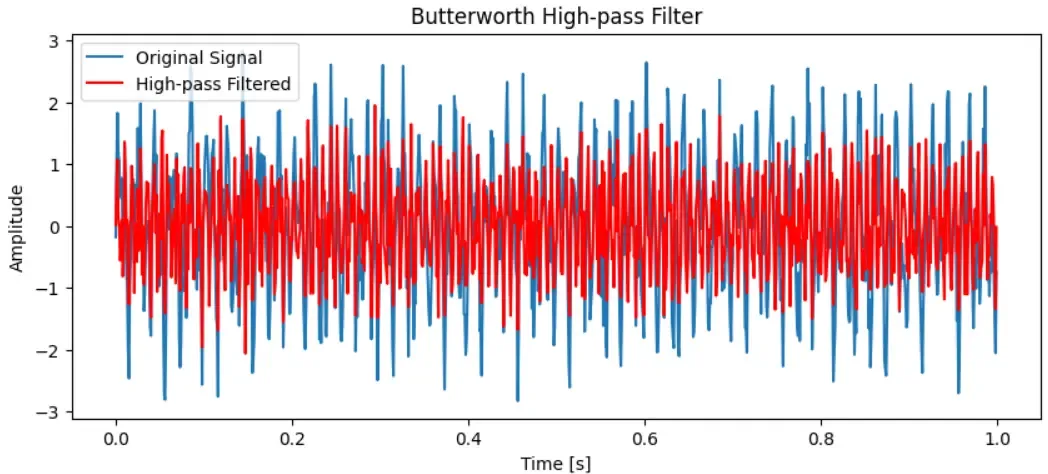
Output of Butterworth High pass Filter
3. Butterworth Band pass Filter
- Butterworth Band pass Filter passes frequencies within a specified range filtering out frequencies outside this band.
- A Butterworth band pass filter passes frequencies between 40 Hz and 130 Hz removing components outside this range. The filtfilt function ensures zero phase distortion. The plot shows the original and band pass filtered signals for comparison. Python `
def butter_bandpass_filter(data, lowcut, highcut, fs, order=4): nyq = 0.5 * fs low = lowcut / nyq high = highcut / nyq b, a = butter(order, [low, high], btype='band') return filtfilt(b, a, data)
lowcut = 40 highcut = 130 filtered = butter_bandpass_filter(signal, lowcut, highcut, fs)
plt.figure(figsize=(10,4)) plt.plot(t, signal, label='Original Signal') plt.plot(t, filtered, label='Band-pass Filtered', color='green') plt.title('Butterworth Band-pass Filter') plt.xlabel('Time [s]') plt.ylabel('Amplitude') plt.legend() plt.show()
`
**Output:
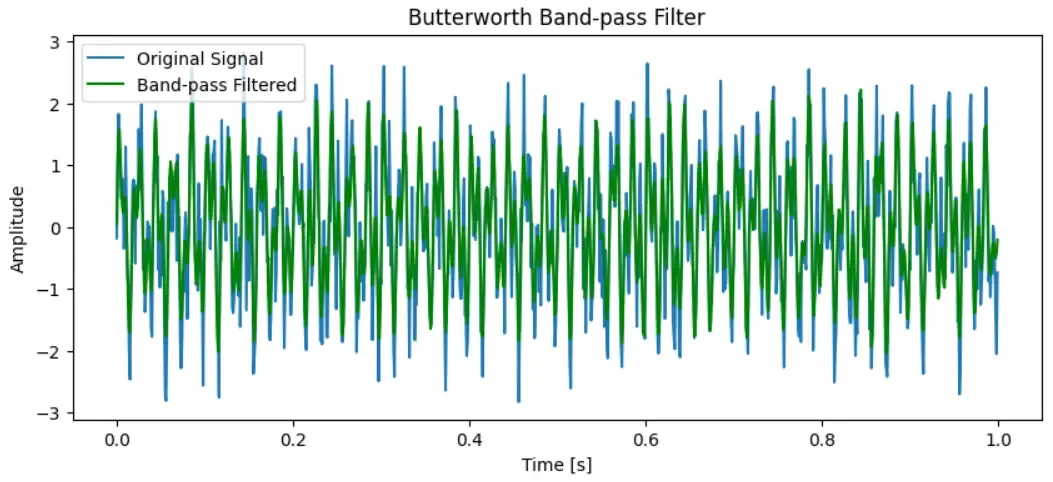
Output of Butterworth Band pass Filter
4. Butterworth Band stop Filter
- Butterworth Band stop Filter removes frequencies within a narrow band often used to eliminate specific noise like powerline interference.
- A Butterworth band stop (notch) filter removes frequencies between 55 Hz and 65 Hz from the signal. The filtfilt function applies the filter with zero phase distortion. The plot compares the original and notch filtered signals. Python `
def butter_bandstop_filter(data, lowcut, highcut, fs, order=4): nyq = 0.5 * fs low = lowcut / nyq high = highcut / nyq b, a = butter(order, [low, high], btype='bandstop') return filtfilt(b, a, data)
lowcut = 55 highcut = 65 filtered = butter_bandstop_filter(signal, lowcut, highcut, fs)
plt.figure(figsize=(10,4)) plt.plot(t, signal, label='Original Signal') plt.plot(t, filtered, label='Band-stop Filtered', color='purple') plt.title('Butterworth Band-stop Filter (Notch)') plt.xlabel('Time [s]') plt.ylabel('Amplitude') plt.legend() plt.show()
`
**Output:
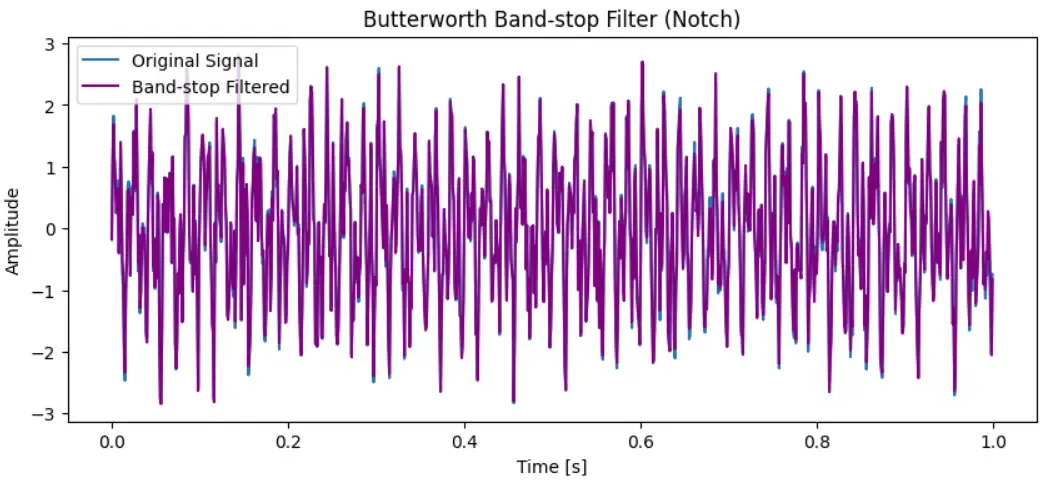
Output of Butterworth Band stop Filter
5. Median Filter
- Median Filter reduces impulsive noise by replacing each point with the median of neighbouring values, preserving edges better than linear filters.
- A median filter with a kernel size of 5 is applied to the signal to reduce noise especially impulsive noise. It replaces each point with the median of neighbouring values preserving edges better than linear filters. The plot shows the original and median filtered signals for comparison. Python `
from scipy.signal import medfilt kernel_size = 5 filtered = medfilt(signal, kernel_size=kernel_size)
plt.figure(figsize=(10,4)) plt.plot(t, signal, label='Original Signal') plt.plot(t, filtered, label='Median Filtered', color='orange') plt.title('Median Filter') plt.xlabel('Time [s]') plt.ylabel('Amplitude') plt.legend() plt.show()
`
**Output:
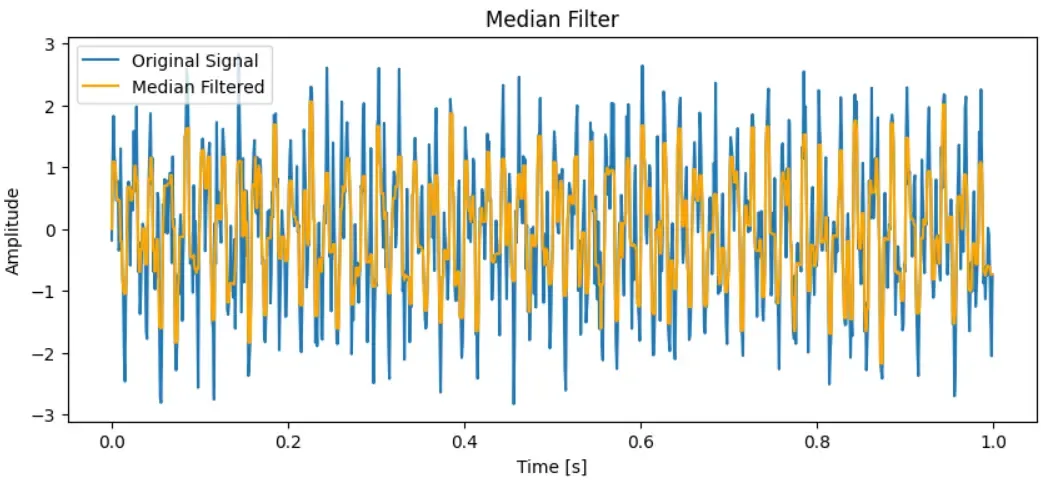
Output of Median Filter
6. Savitzky Golay Filter
- Savitzky Golay Filter smooths the signal by fitting polynomials within a moving window, preserving signal features like peaks while reducing noise.
- The Savitzky Golay filter smooths the signal using a polynomial fit within a moving window of length 11 and polynomial order 3. This preserves features like peaks while reducing noise. The plot compares the original and smoothed signals. Python `
from scipy.signal import savgol_filter window_length = 11 polyorder = 3 filtered = savgol_filter(signal, window_length=window_length, polyorder=polyorder) plt.figure(figsize=(10,4)) plt.plot(t, signal, label='Original Signal') plt.plot(t, filtered, label='Savitzky-Golay Filtered', color='brown') plt.title('Savitzky-Golay Filter') plt.xlabel('Time [s]') plt.ylabel('Amplitude') plt.legend() plt.show()
`
**Output:
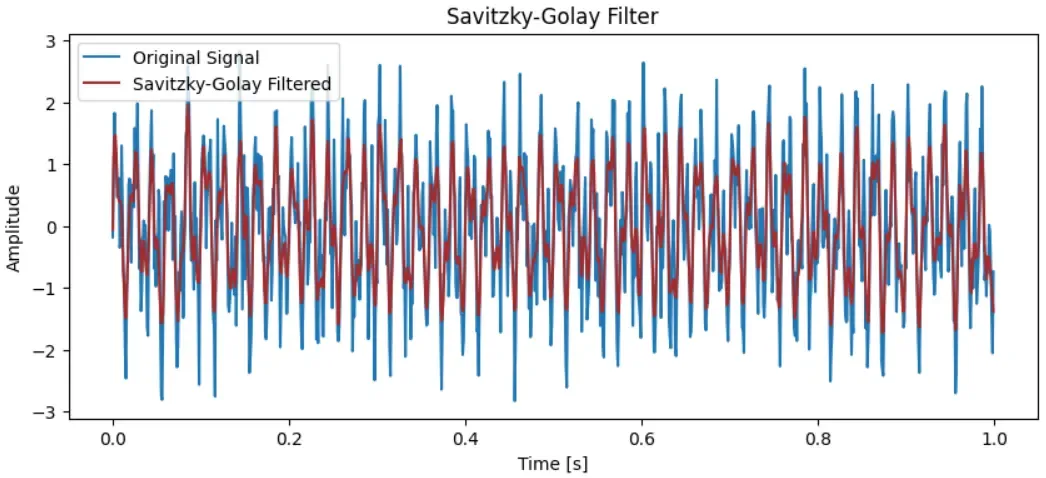
Output of Savitzky Golay Filter
Need of Signal Filtering
- **Noise Reduction: All signals are contaminated by unwanted noise and this noise can come from environmental interference, electronic components or transmission errors. Filtering helps clean the signal preserving the important information and discarding the irrelevant fluctuations.
- **Improved Analysis and Feature Detection: Noisy data can make it difficult to detect features such as peaks, troughs or edges. Filtering helps make these features more apparent and accurate which is critical for Peak detection, Edge detection etc.
- **Data Pre processing: Before feeding signals into algorithms it’s essential to pre process the data to remove distortions. Filters ensure the input is clean and relevant which improves model performance and stability.
- **Eliminating Sensor Errors and Artifacts: Sensor readings often suffer from sudden spikes, dropouts or drifts due to environmental factors, hardware limitations or calibration issues. Filters can smooth out these anomalies and make the data more reliable for decision making.