Signal Smoothing with scipy (original) (raw)
Last Updated : 23 Jul, 2025
Signal smoothing is the process of reducing this noise to reveal the true behaviour of the signal. It acts like a lens that clarifies the picture helping highlight patterns, peaks or trends that might otherwise go unnoticed. Python’s SciPy library along with NumPy and Matplotlib offers powerful tools to apply various smoothing techniques efficiently. From simple moving averages to more advanced filters like Gaussian and Savitzky Golay which provide flexible options to clean up 1D signals with minimal effort.
Signal Smoothing techniques
1. Savitzky Golay Filter
- Savitzky Golay Filter fits local polynomials to data windows, preserving important features like peaks while smoothing noise
- This code uses the Savitzky Golay filter to smooth the noisy signal
yby fitting a 3rd degree polynomial over a window of 11 points. It preserves features like peaks better than a simple moving average. Python `
from scipy.signal import savgol_filter
smoothed = savgol_filter(y, window_length=11, polyorder=3) plt.plot(x, y, label='Noisy Signal') plt.plot(x, smoothed, label='Savitzky-Golay', color='green') plt.legend() plt.show()
`
**Output:

Output Savitzky Golay Filter
2. Gaussian Filter
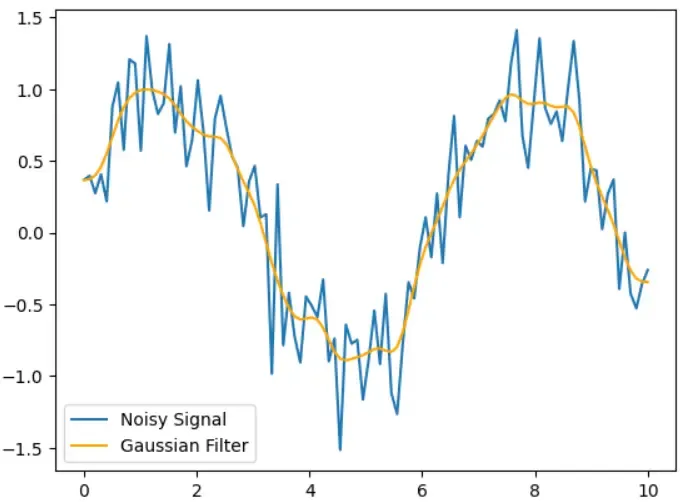
- Gaussian Filters applies a weighted average with a Gaussian kernel giving more emphasis to nearby points for gentle smoothing.
- This code applies a Gaussian filter to the noisy signal using gaussian_filter1d which smooths data by averaging with a Gaussian kernel. The sigma controls the degree of smoothing as higher values result in smoother curves. Python `
from scipy.ndimage import gaussian_filter1d
smoothed = gaussian_filter1d(y, sigma=2) plt.plot(x, y, label='Noisy Signal') plt.plot(x, smoothed, label='Gaussian Filter', color='orange') plt.legend() plt.show()
`
**Output:
Output of Gaussian Filter
3. Butterworth Low pass Filter
- Butterworth Low pass Filter is a frequency based filter that removes high frequency noise while maintaining signal integrity with minimal distortion.
- This code defines and applies a Butterworth low pass filter to remove high frequency noise from the signal y. It uses butter to create the filter coefficients and filtfilt for zero phase filtering, preserving signal shape without phase shift. Python `
from scipy.signal import butter, filtfilt
def butter_lowpass_filter(data, cutoff, fs, order=4): nyq = 0.5 * fs normal_cutoff = cutoff / nyq b, a = butter(order, normal_cutoff, btype='low', analog=False) return filtfilt(b, a, data)
fs = 100
cutoff = 2.0
smoothed = butter_lowpass_filter(y, cutoff=cutoff, fs=fs)
plt.plot(x, y, label='Noisy Signal') plt.plot(x, smoothed, label='Butterworth Filter', color='purple') plt.legend() plt.show()
`
**Output:

Output of Butterworth Low pass Filter
Need of signal smoothing
- **Reduces Noise and Unwanted Fluctuations: Real world signals often contain random variations or noise due to sensor inaccuracies, environmental interference or measurement errors. Smoothing helps suppress these fluctuations making the signal cleaner.
- **Reveals Underlying Trends and Patterns: Raw signals can be erratic hiding the true behavior or trend. Smoothing highlights the fundamental structure helping to understand the core dynamics of the data.
- **Improves Accuracy of Signal Analysis: Many analysis techniques like peak detection, classification or forecasting perform better on smooth data since noise can cause false positives or misleading results.
- **Enhances Visualization Clarity: Smoothed signals are easier to interpret visually as noise and jagged edges are minimized allowing for clearer presentation and communication of findings.