Wavelet Transforms (original) (raw)
Last Updated : 8 May, 2025
A Wavelet Transform (WT) is a mathematical technique that transforms a signal into different frequency components, each analyzed with a resolution that matches its scale. Wavelets are small waves with limited duration and they possess both time and frequency localization, which means they can capture both high-frequency and low-frequency information simultaneously.
The basic idea of wavelet analysis is to represent a function or signal in terms of a set of basis functions known as wavelets, which are derived from a single mother wavelet by translation and scaling.
Types of Wavelet Transforms
1. Continuous Wavelet Transform (CWT)
- Provides a continuous mapping of the signal in time and frequency.
- Suitable for detailed analysis and visualization of signals.
2. Discrete Wavelet Transform (DWT)
- Provides a compact representation of signals using wavelet coefficients.
- Used extensively in image and signal compression.
3. Stationary Wavelet Transform (SWT)
- A variant of DWT that is shift-invariant.
- Ideal for feature extraction and denoising applications.
4. Multiresolution Analysis (MRA)
- Decomposes signals into different resolution levels.
- Provides a hierarchical view of signal components.
Continuous Wavelet Transform (CWT)
The Continuous Wavelet Transform (CWT) of a signal x(t) is defined as:
C(a, b) = \int_{-\infty}^{\infty} f(t) \frac{1}{\sqrt{|a|}} \psi\left( \frac{t - b}{a} \right) dt
**Where:
- W(a,b) is the wavelet coefficient.
- a is the scale parameter that dilates or compresses the wavelet.
- b is the translation parameter that shifts the wavelet.
- ψa,b∗(t) is the conjugate of the mother wavelet ψ(t).
Discrete Wavelet Transform (DWT)
The Discrete Wavelet Transform (DWT) is a sampled version of the CWT where the scale and translation parameters are discretized. It is defined as:
W(j, k) = \sum_{n=0}^{N-1} x(n) \psi_{j, k}(n)
**Where:
- j represents the scale index.
- k is the translation index.
- ψj,k[n] is the discrete wavelet obtained by scaling and shifting the mother wavelet.
The DWT decomposes a signal into approximation and detail coefficients, which represent low and high-frequency components, respectively.
Commonly Used Wavelets
**1. Haar Wavelet:
- Simplest and most intuitive wavelet.
- Suitable for step-like signals.
**2. Daubechies Wavelets (db):
- Provides smooth and compactly supported wavelets.
- Widely used in data compression and denoising.
**3. Symlets:
- A modified version of Daubechies wavelets.
- Exhibits better symmetry properties.
**4. Coiflets:
- Designed to have better approximation properties.
**5. Morlet Wavelet:
- Combines a sinusoidal wave with a Gaussian window.
- Ideal for time-frequency analysis.
Wavelet Transform Implementation in Python
Python `
import pywt import numpy as np import matplotlib.pyplot as plt
Generate a sample signal
t = np.linspace(0, 1, 1024) signal = np.sin(2 * np.pi * 5 * t) + np.sin(2 * np.pi * 20 * t)
Perform Discrete Wavelet Transform
wavelet = 'db4' coeffs = pywt.wavedec(signal, wavelet, level=4)
Plot the original signal and wavelet coefficients
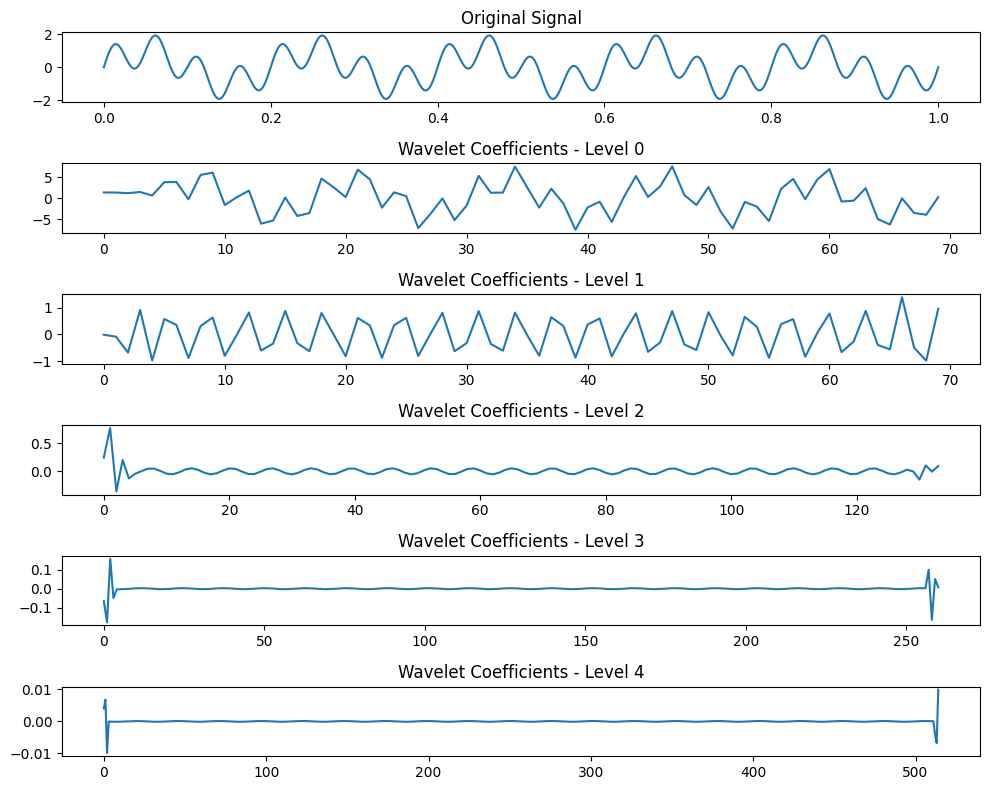
plt.figure(figsize=(10, 8)) plt.subplot(5, 1, 1) plt.plot(t, signal) plt.title("Original Signal")
for i, coeff in enumerate(coeffs): plt.subplot(5, 1, i + 2) plt.plot(coeff) plt.title(f"Wavelet Coefficients - Level {i}")
plt.tight_layout() plt.show()
`
**Output:
Wavelets
- **Original Signal: The original time-domain signal that contains multiple frequency components.
- **Wavelet Coefficients: Decomposed coefficients at different levels representing details and approximations.
- Higher levels correspond to lower frequency components, capturing smooth variations.
- Lower levels capture finer details and high-frequency components.
Applications of Wavelet Transforms
- **Denoising and Signal Processing: DWT is used to remove noise from signals while preserving essential details.
- **Medical Signal Analysis: EEG, ECG and MRI data analysis benefit from wavelet techniques.
- **Feature Extraction: Wavelets provide features useful for classification in machine learning models.
- **Anomaly Detection: Time-series anomaly detection uses wavelet decomposition to capture patterns.