Python Bokeh Plotting a Scatter Plot on a Graph (original) (raw)
Last Updated : 10 Jul, 2020
Bokeh is a Python interactive data visualization. It renders its plots using HTML and JavaScript. It targets modern web browsers for presentation providing elegant, concise construction of novel graphics with high-performance interactivity. Bokeh can be used to plot a scatter plot on a graph. Plotting squares on a graph can be done using the scatter() method of the plotting module.
plotting.figure.scatter()
Syntax : scatter(parameters)Parameters :
- x : x-coordinates of the center of the glyphs
- y : y-coordinates of the center of the glyphs
- marker : signifies the type of the glyph Returns : an object of class
GlyphRenderer
Example 1 : In this example we will be using the default values for plotting the graph.
Python3 `
importing the modules
from bokeh.plotting import figure, output_file, show
file to save the model
output_file("gfg.html")
instantiating the figure object
graph = figure(title = "Bokeh Scatter Graph")
the points to be plotted
x = [1, 2, 3, 4, 5] y = [1, 2, 3, 4, 5]
plotting the graph
graph.scatter(x, y)
displaying the model
show(graph)
`
Output : 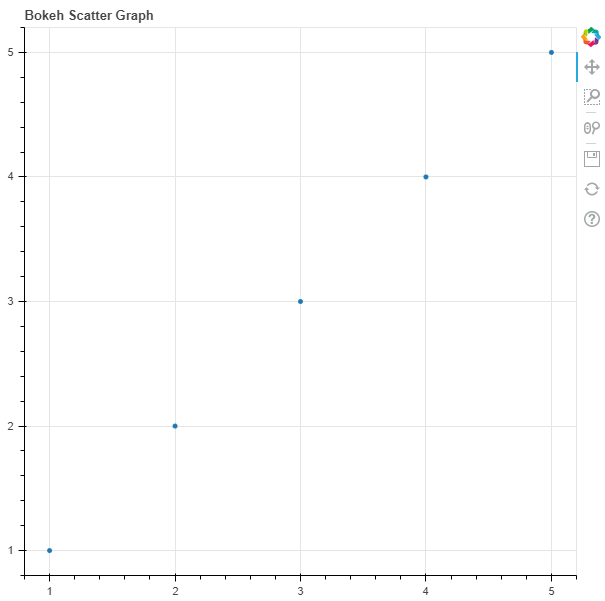 Example 2 : In this example we will be plotting multiple scatter points with various other parameters
Python3 `
importing the modules
from bokeh.plotting import figure, output_file, show from bokeh.palettes import magma import random
file to save the model
output_file("gfg.html")
instantiating the figure object
graph = figure(title = "Bokeh Scatter Graph")
name of the x-axis
graph.xaxis.axis_label = "x-axis"
name of the y-axis
graph.yaxis.axis_label = "y-axis"
points to be plotted
x = [n for n in range(256)] y = [random.random() + 1 for n in range(256)] size = 10
color value of the scatter points
color = magma(256)
plotting the graph
graph.scatter(x, y, size = size, color = color)
displaying the model
show(graph)
`
Output : 