Flight Delay Prediction using Deep Learning (original) (raw)
Last Updated : 9 Sep, 2024
Air travel has become an important part of our lives, and with this comes the problem of flights being delayed. Deep learning models can automatically learn hierarchical representations from data, making them best for flight delay prediction. In the article, we will build a flight delay predictor using TensorFlow framework.
How can we use deep learning to build a flight delay predictor?
- Deep learning is a subset of artificial intelligence that can learn complex patterns and make decisions. Deep learning has many applications like natural language processing, image recognition(computer vision), predictive modelling and many more.
- Deep learning has the ability to learn hierarchical representations of data. This ability of deep learning makes it suitable for tasks with very large columns of data and for tasks that need spatial datasets.
- In the context of flight delay prediction, deep learning can use information about the flight's total distance and the total time and predict by how many minutes that flight can be delayed. Additionally, deep learning can learn from new data making it perfect for our scenario.
Building a Flight Delay Predictor
We will use the US Domestic Flights Delay Prediction(2013-2018) dataset. The dataset will be used for training and testing the model. It has various features like flight date, origin, destination, scheduled departure time, distance, arrival time and many more. Now let's load the dataset into our Kaggle notebook and look into a few data points.
Python `
import pandas as pd import numpy as np import plotly.express as px import matplotlib.pyplot as plt import seaborn as sns from sklearn.preprocessing import LabelEncoder from sklearn.model_selection import train_test_split from sklearn.preprocessing import StandardScaler from tensorflow.keras.models import Sequential from tensorflow.keras.layers import Dense, Dropout
data = pd.read_csv('/kaggle/input/us-domestic-flights-delay-prediction-2013-2018/flight_delay_predict.csv') data.head()
`
**Output:
is_delay Year Quarter Month DayofMonth DayOfWeek FlightDate Reporting_Airline Origin OriginState Dest DestState CRSDepTime Cancelled Diverted Distance DistanceGroup ArrDelay ArrDelayMinutes AirTime
0 1.0 2014 1 1 1 3 2014-01-01 UA LAX CA ORD IL 900 0.0 0.0 1744.0 7 43.0 43.0 218.0
1 0.0 2014 1 1 1 3 2014-01-01 AA IAH TX DFW TX 1750 0.0 0.0 224.0 1 2.0 2.0 50.0
2 1.0 2014 1 1 1 3 2014-01-01 AA LAX CA ORD IL 1240 0.0 0.0 1744.0 7 26.0 26.0 220.0
3 1.0 2014 1 1 1 3 2014-01-01 AA DFW TX LAX CA 1905 0.0 0.0 1235.0 5 159.0 159.0 169.0
4 0.0 2014 1 1 1 3 2014-01-01 AA DFW TX CLT NC 1115 0.0 0.0 936.0 4 -13.0 0.0 108.0
EDA(Exploratory Data Analysis) and Model Building
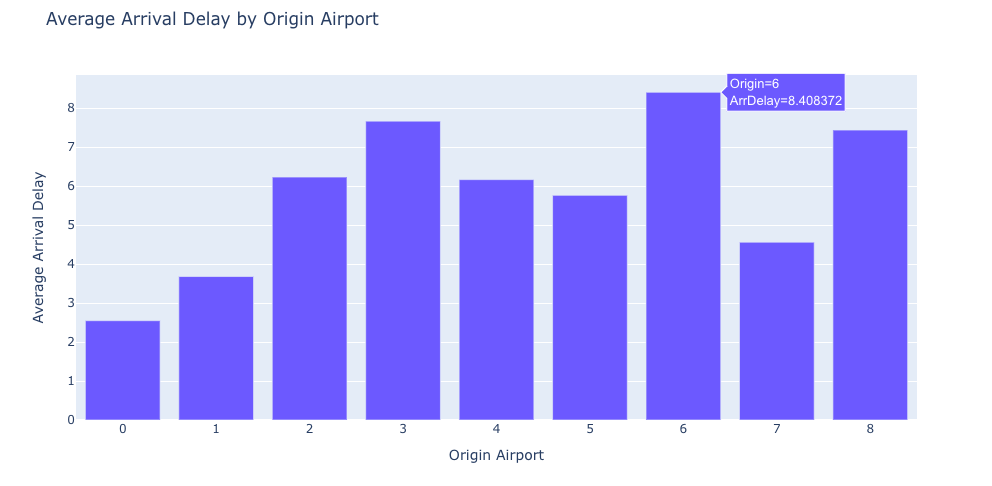
EDA is a very important step in understanding the data. It helps us understand the structure, distribution, and relationships within the dataset. One important step of EDA is visualizing the dataset. We can visualize the average arrival delays at different origin and destination airports.
Python `
avg_delay_by_origin = data.groupby('Origin')['ArrDelay'].mean().reset_index()
bar_plot = px.bar(avg_delay_by_origin, x='Origin', y='ArrDelay', title='Average Arrival Delay by Origin Airport') bar_plot.update_layout(xaxis_title='Origin Airport', yaxis_title='Average Arrival Delay')
bar_plot.show()
`
**Output:
OUTPUT
Python `
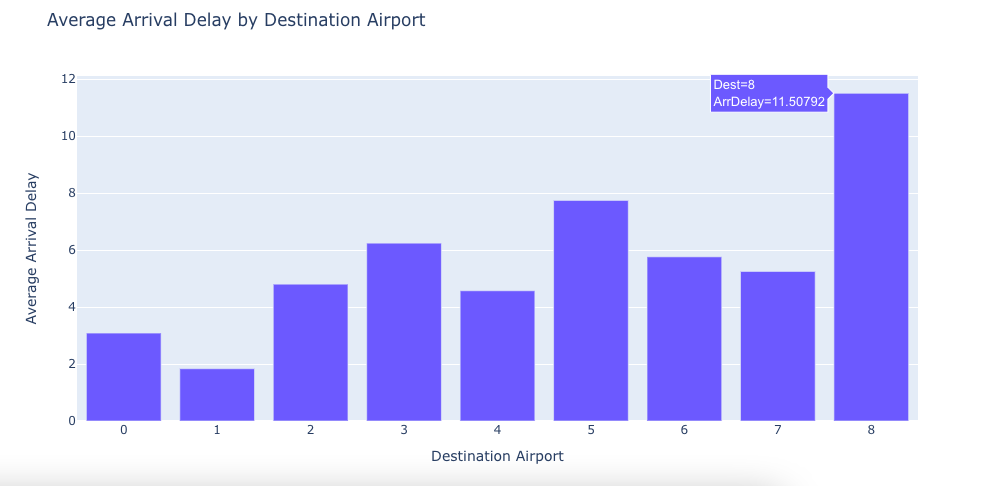
avg_delay_by_dest = data.groupby('Dest')['ArrDelay'].mean().reset_index()
bar_plot_dest = px.bar(avg_delay_by_dest, x='Dest', y='ArrDelay', title='Average Arrival Delay by Destination Airport') bar_plot_dest.update_layout(xaxis_title='Destination Airport', yaxis_title='Average Arrival Delay')
bar_plot_dest.show()
`
**Output:
OUTPUT
Python `
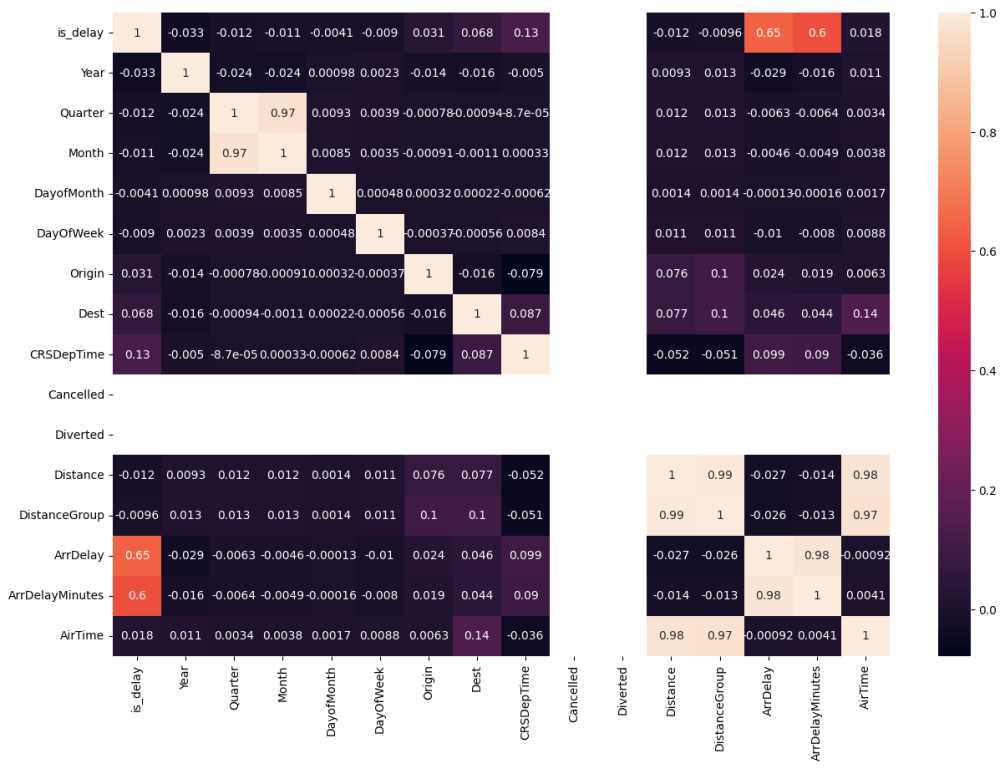
numeric_data = data.select_dtypes(include=['number'])
corr_matrix = numeric_data.corr()
plt.figure(figsize=(15, 10)) sns.heatmap(corr_matrix, annot = True)
`
**Output:
OUTPUT
Python `
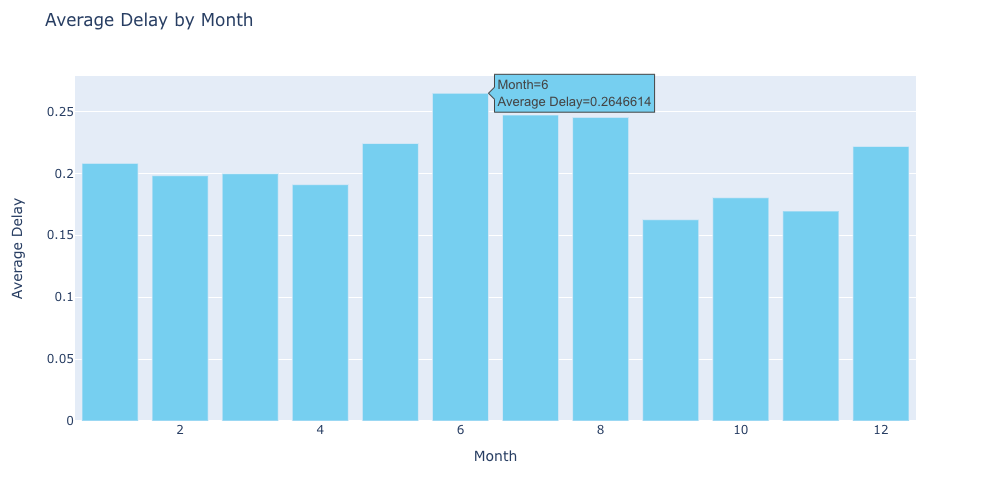
data['FlightDate'] = pd.to_datetime(data['FlightDate'])
avg_delay_month = data.groupby(data['FlightDate'].dt.month)['is_delay'].mean().reset_index() fig = px.bar(avg_delay_month, x='FlightDate', y='is_delay', labels={'FlightDate': 'Month', 'is_delay': 'Average Delay'}, title='Average Delay by Month') fig.update_traces(marker_color='skyblue') fig.show()
`
**Output:
OUTPUT
Splitting the Data
Now, let's get into the main part of this blog which is the model building. First, we will assign the features and the target variables to X and y respectively. Then we will split the dataset with 80% of the data for training and the rest 20% for testing. Then we will scale the features using the StandardScaler method from sklearn.
Python `
Splitting the data into training and testing sets
X = data[['AirTime', 'Distance']] y = data[['ArrDelayMinutes', 'is_delay']] X_train, X_test, y_train, y_test = train_test_split(X, y, test_size=0.2, random_state=42)
Scaling the data
scaler = StandardScaler() X_train = scaler.fit_transform(X_train) X_test = scaler.transform(X_test)
`
Model Building
Now, we will define the architecture of our model using the Sequential model from TensorFlow.Keras. We will use three dense layers using relu activation function. Then we will compile the model using mean squared error as a loss function and an Adam Optimizer. Finally, we will train the model using the fit() function and save the model into our working directory.
Python `
model = Sequential() model.add(Dense(64, input_dim=X_train.shape[1], activation='relu')) model.add(Dropout(0.5)) model.add(Dense(32, activation='relu')) model.add(Dropout(0.5)) model.add(Dense(2, activation='linear'))
model.compile(loss='mean_squared_error', optimizer='adam', metrics=['accuracy'])
model.fit(X_train, y_train, epochs=5, batch_size=32, verbose=1) score, accuracy = model.evaluate(X_test, y_test, verbose=0)
model.save('/kaggle/working/model.h5')
`
**Output:
Epoch 1/5
40890/40890 ━━━━━━━━━━━━━━━━━━━━ 68s 2ms/step - accuracy: 0.9959 - loss: 793.4816
Epoch 2/5
40890/40890 ━━━━━━━━━━━━━━━━━━━━ 66s 2ms/step - accuracy: 1.0000 - loss: 803.0837
Epoch 3/5
40890/40890 ━━━━━━━━━━━━━━━━━━━━ 66s 2ms/step - accuracy: 1.0000 - loss: 781.1000
Epoch 4/5
40890/40890 ━━━━━━━━━━━━━━━━━━━━ 66s 2ms/step - accuracy: 1.0000 - loss: 751.3886
Epoch 5/5
40890/40890 ━━━━━━━━━━━━━━━━━━━━ 82s 2ms/step - accuracy: 1.0000 - loss: 777.7186
Test loss: 729.39306640625
Test accuracy: 1.0
Now, we will take input from the user, preprocess it and predict the output.
Python `
Real-time Prediction
air_time = float(input("Enter Air Time in minutes: ")) distance = float(input("Enter Distance in miles: ")) user_input = np.array([[air_time, distance]]) user_input_scaled = scaler.transform(user_input) predictions = model.predict(user_input_scaled) if predictions[0][1] >= 0.5: print(f"The flight is delayed by {predictions[0][0]} minutes.") else: print("The flight is not delayed.")
`
1/1 ━━━━━━━━━━━━━━━━━━━━ 0s 56ms/step
The flight is delayed by 75.59285736083984 minutes.
**Get the complete notebook link here:
**Colab Link : **click here.
**Dataset Link : **click here.
Conclusion
In this blog, you have learned about the critical issues of flight delays and how they can impact both passengers and airlines. Through hands-on experience, we learned how to preprocess data, build a deep learning mode, and integrate it into a web application using Flask.
Key Takeaways
- Flight delay is a critical issue impacting both passengers and airlines, leading to inconvenience and financial losses.
- Deep Learning is used to predict the flight delay accurately using the Sequential Model from TensorFlow.keras.
- Data Preprocessing and Exploratory Data Analysis (EDA) are important steps in understanding the structure and relationships in the dataset.
- We can use Flask to integrate the trained model with the front end.