Prediction of Wine type using Deep Learning (original) (raw)
Last Updated : 6 Oct, 2025
Deep learning is commonly used to analyze large datasets but to understand its core concepts it’s helpful to start with smaller, more manageable datasets. One such dataset is the Wine Quality dataset which includes information about the chemical properties of wines and their quality ratings.
In this article, we’ll explore how deep learning can be applied to predict wine quality based on its chemical composition. But before loading the data it is important to understand its features. The dataset consists of 12 variables. Here are a few of them:
- **Fixed Acidity: This refers to the non-volatile acids in the wine, which contribute to the wine's tartness.
- **Volatile Acidity: This refers to acetic acid content which can contribute to a vinegar-like taste in wine.
- **Citric Acid: Citric acid is one of the fixed acids in wine.
- **Residual Sugar: This is the sugar that remains after fermentation stops.
- **Chlorides: Chlorides can contribute to saltiness in wine.
- **Free Sulfur Dioxide: This is the sulfur dioxide that is added to wine.
- **Total Sulfur Dioxide: This is the sum of bound and free sulfur dioxide.
1. **Importing Required Libraries
We will be importing numpy, pandas, matplotlib, scikit learn and keras for model building.
Python `
import matplotlib.pyplot as plt import pandas as pd import numpy as np from sklearn.model_selection import train_test_split from keras.models import Sequential from keras.layers import Dense
`
2. **Loading and Preprocessing Data
We will be loading dataset from provided URL. After that we will preprocess it so that model can use this cleaned dataset for training and making prediction.
- **type : is added to distinguish between red and white wine: 1 for red wine and 0 for white wine.
- **pd.concat(): using this two datasets (red and white) are concatenated into a single data frame wine.
- **dropna(): Any rows with missing values are dropped using this to ensure clean data for training the model.
Red wine dataset can be downloaded from here.
White wine dataset can be downloaded from here.
Python `
red = pd.read_csv("redwinequality.csv", sep=';') white = pd.read_csv("whitewinequality.csv", sep=';')
red['type'] = 1 white['type'] = 0
wines = pd.concat([red, white], ignore_index=True) wines.dropna(inplace=True)
`
3. **Plotting Distribution of Alcohol
We will use matplotlib to create a visual representation of the distribution of alcohol content for red and white wines. We will create a histogram for each wine type (red and white) with a specified number of bins (10).
Python `
fig, ax = plt.subplots(1, 2, figsize=(10, 5)) ax[0].hist(wines[wines['type'] == 1].alcohol, bins=10, facecolor='red', alpha=0.5, label='Red wine') ax[1].hist(wines[wines['type'] == 0].alcohol, bins=10, facecolor='white', edgecolor='black', lw=0.5, alpha=0.5, label='White wine')
for a in ax: a.set_ylim([0, 1000]) a.set_xlabel('Alcohol in % Vol') a.set_ylabel('Frequency')
ax[0].set_title('Alcohol Content in Red Wine') ax[1].set_title('Alcohol Content in White Wine')
fig.suptitle('Distribution of Alcohol by Wine Type') plt.tight_layout() plt.show()
`
**Output:
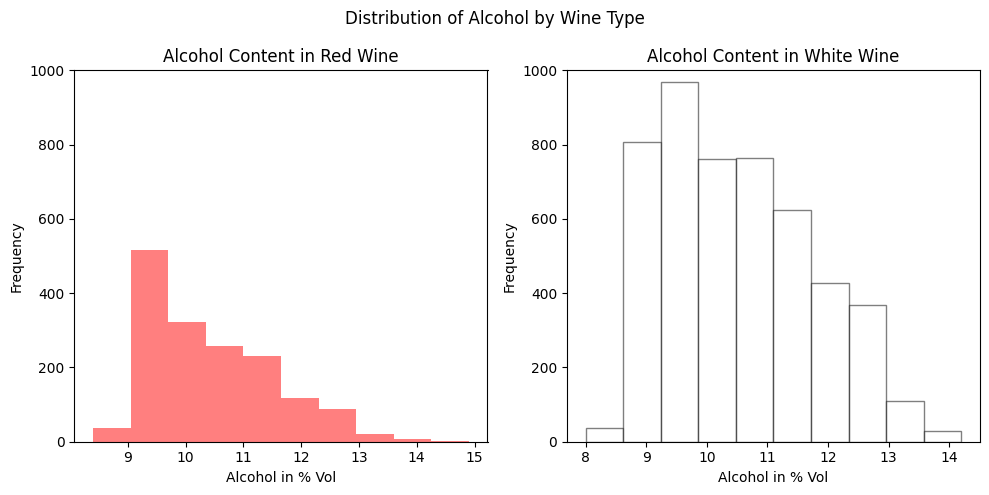
Alcohol Distribution Graph
4. **Splitting Data into Training and Testing Sets
We will split our dataset into training and testing.
- X contains all columns except the target variable (type), which is represented by y.
- **train_test_split(): splits the dataset into training (66%) and testing (34%) sets.
- **random_state=45: ensures that the split is reproducible. Python `
X = wines.iloc[:, :-1] y = wines['type'] X_train, X_test, y_train, y_test = train_test_split(X, y, test_size=0.34, random_state=45)
`
5. **Creating Neural Network Model
The function **Sequential() defines a neural network with 3 layers:
- **Input layer: Dense(12) with 12 neurons and ReLU activation function where input_dim=12 matches the number of features (columns) in the input data.
- **Hidden layer: Dense(9) with 9 neurons and ReLU activation.
- **Output layer: Dense(1) with a single neuron and a sigmoid activation function since this is a binary classification problem (predicting red or white wine).
- The model is compiled using the binary crossentropy loss function and the Adam optimizer. Python `
model = Sequential() model.add(Dense(12, activation='relu', input_dim=12)) model.add(Dense(9, activation='relu')) model.add(Dense(1, activation='sigmoid')) model.compile(loss='binary_crossentropy', optimizer='adam', metrics=['accuracy'])
`
6. **Training the Model
We train the model using the training data (X_train, y_train) for 3 epochs with a batch size of 1.
Python `
model.fit(X_train, y_train, epochs=3, batch_size=1, verbose=1)
`
**Output:
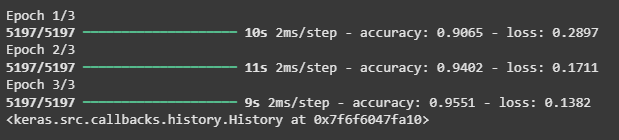
Training the Model
**7. Making Predictions
We make predictions using the trained model on the test data (X_test) and get the predicted probabilities for each wine sample. We then convert these probabilities into binary labels (1 for Red wine, 0 for White wine) and display the wine type prediction for the first 12 samples.
Python `
y_pred = model.predict(X_test)
y_pred_labels = (y_pred >= 0.5).astype(int)
for prediction in y_pred_labels[:12]: wine_type = "Red wine" if prediction == 1 else "White wine" print(f"Prediction: {wine_type}")
`
**Output:
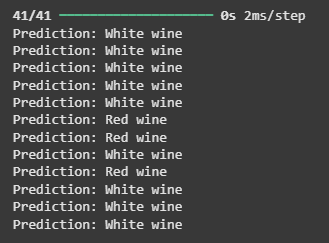
Making Predictions
You can download source code from here.