Region Proposal Object Detection with OpenCV, Keras, and TensorFlow (original) (raw)
Last Updated : 29 Mar, 2023
In this article, we'll learn how to implement Region proposal object detection with OpenCV, Keras and TensorFlow.
Install all the dependencies
Use the pip command for installing all the dependencies
pip install tensorflow keras imutils pip install opencv-contrib-python
Note: Make sure about installing the above OpenCV package otherwise you might face import errors.
Step 1: Read the image and Apply the selective search method of OpenCV
In this step, we'll read the image and apply the selective search method from OpenCV to it. This method will return as a list of rectangles which are basically the region of interest. OpenCV provides us with two different methods for this selective search, one is the "FASTER" method and the other is the "Accurate" method, you have to decide which to use depending on your use case.
Now that we have the rectangles before we go further let's try to visualize what regions of interest it returns.
Python3 `
import numpy as np import cv2
this is the model we'll be using for
object detection
from tensorflow.keras.applications import Xception
for preprocessing the input
from tensorflow.keras.applications.xception import preprocess_input from tensorflow.keras.applications import imagenet_utils from tensorflow.keras.preprocessing.image import img_to_array from imutils.object_detection import non_max_suppression
read the input image
img = cv2.imread('Assets/img2.jpg')
instantiate the selective search
segmentation algorithm of opencv
search = cv2.ximgproc.segmentation.createSelectiveSearchSegmentation()
set the base image as the input image
search.setBaseImage(img)
since we'll use the fast method we set it as such
search.switchToSelectiveSearchFast()
you can also use this for more accuracy:
search.switchToSelectiveSearchQuality()
rects = search.process() # process the image
roi = img.copy() for (x, y, w, h) in rects:
# Check if the width and height of
# the ROI is atleast 10 percent
# of the image dimensions and only then
# show it
if (w / float(W) < 0.1 or h / float(H) < 0.1):
    continue

# Let's visualize all these ROIs
cv2.rectangle(roi, (x, y), (x + w, y + h),
              (0, 200, 0), 2)
roi = cv2.resize(roi, (640, 640)) final = cv2.hconcat([cv2.resize(img, (640, 640)), roi]) cv2.imshow('ROI', final) cv2.waitKey(0)
`
Output:
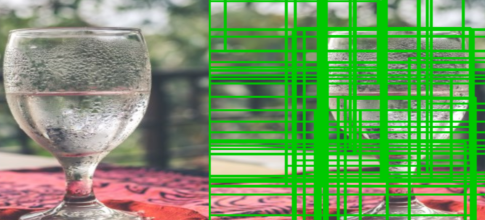
These are all the Region of Interest that our function receives after filtering out the ROIs which are not sufficiently large, that is to say if the ROI has less than 10% of width or height than that of the image than we won't consider it.
Step 2: Create a List of Final Input Arrays and Bounding boxes using ROI
We'll create two separate lists which contain the image in RGB format and another list will have the bounding box coordinates. These lists will be used for prediction and creating bounding boxes respectively. We'll also make sure that we only make predictions on sufficiently large ROI, say which have at least 20% width or height of our image.
Python3 `
rois = [] boxes = [] (H, W) = img.shape[:2] rois = [] boxes = [] (H, W) = img.shape[:2]
for (x, y, w, h) in rects:
# check if the ROI has atleast
# 20% the size of our image
if w / float(W) < 0.2 or h / float(H) < 0.2:
    continue

# Extract the Roi from image
roi = img[y:y + h, x:x + w]

# Convert it to RGB format
roi = cv2.cvtColor(roi, cv2.COLOR_BGR2RGB)

# Resize it to fit the input requirements of the model
roi = cv2.resize(roi, (299, 299))

# Further preprocessing
roi = img_to_array(roi)
roi = preprocess_input(roi)

# Append it to our rois list
rois.append(roi)

# now let's store the box co-ordinates
x1, y1, x2, y2 = x, y, x + w, y + h
boxes.append((x1, y1, x2, y2))
`
Now that we have our region of interests which we have filtered and also preprocessed, let's use them to create predictions using our model.
Step 3: Generate Predictions using Model
We're using the ResNet50 model from the Keras pre-trained models, mainly because it's not heavy on the machine and also has a high accuracy. So, first, we'll create our model instance and then pass in our input -> List of ROIs and generate predictions.
In code it would look like this:
# ------------ Model--------------- #
model = Xception(weights='imagenet')
# Convert ROIS list to arrays for predictions
input_array = np.array(rois)
print("Input array shape is ;" ,input_array.shape)
#---------- Make Predictions -------#
preds = model.predict(input_array)
preds = imagenet_utils.decode_predictions(preds, top=1)
Now, that we have predictions let's s show the result on the image.
Step 4: Create Objects Dictionary
In this step, we'll create a new dictionary that basically contains the label as the key as the bounding box, and probability as the values. This we'll easily let us access the predictions for each label and apply non_max_suppression to them. We can do this by looping through the predictions and filtering out the predictions with more than 90% confidence( you can change it to your needs). Let's see the code:
Python3 `
Initiate the dictionary
objects = {} for (i, pred) in enumerate(preds):
# extract the prediction tuple
# and store it's values
 iD = pred[0][0]
label = pred[0][1]
 prob = pred[0][2]
if prob >= 0.9:
    # grab the bounding box associated
    # with the prediction and
    # convert the coordinates
    box = boxes[i]

    # create a tuple using box and probability
    value = objects.get(label, [])

    # append the value to the list for the label
    value.append((box, prob))

     # Add this tuple to the objects
    # dictionary that we initiated
    objects[label] = value
`
Output:
{'img': [((126, 295, 530, 800), 0.5174897), ((166, 306, 497, 613), 0.510667), ((176, 484, 520, 656), 0.56631094), ((161, 304, 499, 613), 0.55209666), ((161, 306, 504, 613), 0.6020483), ((161, 306, 499, 613), 0.54256636), ((140, 305, 499, 800), 0.5012991), ((144, 305, 516, 800), 0.50028765), ((162, 305, 499, 642), 0.84315413), ((141, 306, 517, 800), 0.5257749), ((173, 433, 433, 610), 0.56347036)], 'matchstick': [((169, 633, 316, 800), 0.56465816), ((172, 633, 313, 800), 0.7206488), ((333, 639, 467, 800), 0.60068905), ((169, 633, 314, 800), 0.693922), ((172, 633, 314, 800), 0.70851576), ((167, 632, 314, 800), 0.6374499), ((172, 633, 316, 800), 0.5995729), ((169, 640, 307, 800), 0.67480534)], 'guillotine': [((149, 591, 341, 800), 0.59910816), ((149, 591, 338, 800), 0.7370558), ((332, 633, 469, 800), 0.5568006), ((142, 591, 341, 800), 0.6165994), ((332, 634, 468, 800), 0.63907826), ((332, 633, 468, 800), 0.57237893), ((142, 590, 321, 800), 0.6664309), ((331, 635, 467, 800), 0.5186203), ((332, 634, 467, 800), 0.58919555)], 'water_tower': [((144, 596, 488, 800), 0.50619787)], 'barber_chair': [((165, 465, 461, 576), 0.5565266)]}
As you can see it's a dictionary where the label, 'rocking chair', is the key and we have a list of tuple which have bounding boxes and probabilities stored for this label as values.
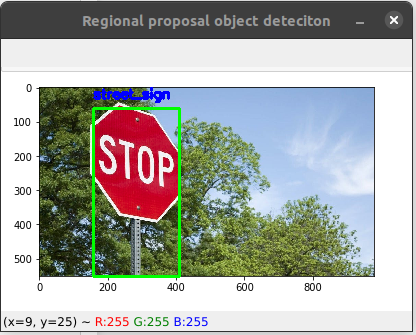
Step 5: Show the Detected object on the Image
Look at the objects dictionary again if you don't already know, we have multiple bounding boxes for a single label, so won't there be a cluster in the image if directly show it on the image?
Therefore, we need to use the non_max_suppression method which we'll solve this problem for us. But to use this function we need an array of bounding boxes and an array of probabilities, and it returns us an array of bounding boxes.
Python3 `
Loop through the labels
for each label apply the non_max_suppression
for label in objects.keys():
# clone the original image
# so that we can draw on it
img_copy = img.copy()
boxes = np.array([pred[0] for pred in objects[label]])
proba = np.array([pred[1] for pred in objects[label]])
boxes = non_max_suppression(boxes, proba)

# Now unpack the co-ordinates of the bounding box
(startX, startY, endX, endY) = boxes[0]

# Draw the bounding box
cv2.rectangle(img_copy, (startX, startY),
              (endX, endY), (0, 255, 0), 2)
y = startY - 10 if startY - 10 > 10 else startY + 10

# Put the label on the image
cv2.putText(img_copy, label, (startX, y),
            cv2.FONT_HERSHEY_SIMPLEX, 0.45, (255, 0), 2)

# Show the image
cv2.imshow("Regional proposal object detection", img_copy)
cv2.waitKey(0)
`
Below is the complete implementation:
Python3 `
import the packages
import numpy as np import cv2
this is the model we'll be using for
object detection
from tensorflow.keras.applications import Xception
for preprocessing the input
from tensorflow.keras.applications.xception import preprocess_input from tensorflow.keras.applications import imagenet_utils from tensorflow.keras.preprocessing.image import img_to_array from imutils.object_detection import non_max_suppression
read the input image
img = cv2.imread('/content/img4.jpg')
instantiate the selective search
segmentation algorithm of opencv
search = cv2.ximgproc.segmentation.createSelectiveSearchSegmentation()
set the base image as the input image
search.setBaseImage(img) search.switchToSelectiveSearchFast()
you can also use this for more accuracy ->
search.switchToSelectiveSearchQuality()
rects = search.process() # process the image
rois = [] boxes = [] (H, W) = img.shape[:2] for (x, y, w, h) in rects:
# check if the ROI has atleast
# 20% the size of our image
if w / float(W) < 0.1 or h / float(H) < 0.1:
    continue

# Extract the Roi from image
roi = img[y:y + h, x:x + w]

# Convert it to RGB format
roi = cv2.cvtColor(roi, cv2.COLOR_BGR2RGB)

# Resize it to fit the input requirements of the model
roi = cv2.resize(roi, (299, 299))

# Further preprocessing
roi = img_to_array(roi)
roi = preprocess_input(roi)

# Append it to our rois list
rois.append(roi)

# now let's store the box co-ordinates
x1, y1, x2, y2 = x, y, x + w, y + h
boxes.append((x1, y1, x2, y2))
------------ Model---------------
model = Xception(weights='imagenet')
Convert ROIS list to arrays for predictions
input_array = np.array(rois) print("Input array shape is ;", input_array.shape)
#---------- Make Predictions -------# preds = model.predict(input_array) preds = imagenet_utils.decode_predictions(preds, top=1)
Initiate the dictionary
objects = {} for (i, pred) in enumerate(preds):
# extract the prediction tuple
# and store it's values
iD = pred[0][0]
label = pred[0][1]
prob = pred[0][2]

if prob >= 0.9:

    # grab the bounding box associated
    # with the prediction and
    # convert the coordinates
    box = boxes[i]

    # create a tuble using box and probability
    value = objects.get(label, [])

    # append the value to the list for the label
    value.append((box, prob))

    # Add this tuple to the objects dictionary
    # that we initiated
    objects[label] = value
Loop through the labels
for each label apply the non_max_suppression
for label in objects.keys():
# clone the original image so that we can
# draw on it
img_copy = img.copy()
boxes = np.array([pred[0] for pred in objects[label]])
proba = np.array([pred[1] for pred in objects[label]])
boxes = non_max_suppression(boxes, proba)

# Now unpack the co-ordinates of the bounding box
(startX, startY, endX, endY) = boxes[0]

# Draw the bounding box
cv2.rectangle(img_copy, (startX, startY),
              (endX, endY), (0, 255, 0), 2)
y = startY - 10 if startY - 10 > 10 else startY + 10

# Put the label on the image
cv2.putText(img_copy, label, (startX, y),
            cv2.FONT_HERSHEY_SIMPLEX, 0.45, (255, 0), 2)

# Show the image
cv2.imshow("Regional proposal object detection", img_copy)
cv2.waitKey(0)
`
Output: