Prometheus Blackbox Exporter (original) (raw)
Last Updated : 30 Apr, 2026
Prometheus Blackbox Exporter is a versatile monitoring tool that checks endpoints over multiple network protocols.
- It monitors the availability and operational status of services from an external perspective, making it a key part of the observability pyramid
- Designed to test the availability and responsiveness of endpoints across different network protocols
- Supports probing via HTTP/HTTPS, TCP, ICMP (Ping), and DNS
- Enables teams to detect outages, network failures, certificate issues, and slow response times before users are impacted
- Provides external endpoint monitoring to ensure services are accessible and performing as expected
Blackbox Exporter Working
Unlike traditional exporters that expose internal metrics, the Blackbox Exporter actively tests endpoints.
**Step-by-step process:
- Prometheus sends a request to the
/probeendpoint. - The Blackbox Exporter executes a configured module.
- The module probes the target (e.g., website or API).
- Metrics are returned to Prometheus.
- Prometheus stores and evaluates the results.
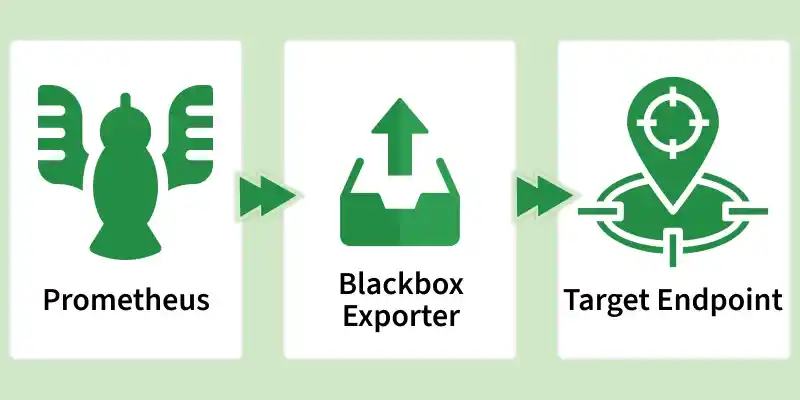
Blackbox Exporter Working
Core Concepts
Module
A module defines how a probe should be executed. Each module specifies timeouts, protocols, and validation rules.
Examples include:
http_2xx→ verifies successful HTTP responsesicmp→ checks network reachabilitytcp_connect→ validates port accessibility
Probe
A probe is a test or check functionality carried out by the Blackbox Exporter to gather metrics from a specified endpoint. These checks can be initiated using different protocols, like HTTP, HTTPS, TCP, DNS, ICMP, and so on
- Response time
- Status codes
- SSL validity
- Packet loss
Target
The endpoint being monitored — such as a website, API, load balancer, or DNS server.
It can be:
- A website →
https://google.com - An API →
https://api.myapp.com/health - A TCP service →
db:5432 - A server →
192.168.1.10
Primary Terminologies
- **Prometheus: Prometheus is an open-source system and alerting toolkit developed initially at SoundCloud. It scrapes and stores metrics as time-series data and offers a query language (PromQL) for obtaining those metrics.
- **Exporter: An exporter is software that pulls out metrics from a certain system and presents the same in a form that Prometheus can grasp. Exporters are useful in collecting data from third-party systems.
- **Blackbox Exporter: The Blackbox Exporter is a Prometheus exporter that runs probes towards the endpoints to collect metrics related to availability, latency, and performance over different protocols.
- **Metrics: Metrics are the fundamental data gathered through Prometheus. They often take the form of simple numerical figures that express different characterization of system performance, including response time, errors, and system’s throughput.
Step-by-Step Process to Install Prometheus Blackbox Exporter
1. Installation and Setup
**Prerequisites:
- A working Prometheus server.
- Docker installed on the monitoring server (may not be necessary but much simpler for ease of deployment).
**Installation using Docker
To deploy the Blackbox Exporter using Docker, you can use the following command:
docker run -d \
--name=blackbox_exporter \
-p 9115:9115 \
prom/blackbox-exporter
**Manual Installation: If you prefer a manual setup, go to the GitHub repository and download the latest version where you will find steps to install and run the exporter.
2. Configuration
The Blackbox Exporter requires a configuration file to define the probes. Create a blackbox.yml file with the following content:
modules:
http_2xx:
prober: http
timeout: 5s
http:
valid_http_versions: ["HTTP/1.1", "HTTP/2"]
valid_status_codes: [] # Defaults to 2xx
method: GET
no_follow_redirects: false
3. Integrating with Prometheus
Update your Prometheus configuration (prometheus.yml) to scrape metrics from the Blackbox Exporter:
scrape_configs:
- job_name: 'blackbox'
metrics_path: /probe
params:
module: [http_2xx] # Module defined in blackbox.yml
static_configs:- targets:
- http://example.com/
relabel_configs:
- http://example.com/
- source_labels: [address]
target_label: __param_target - source_labels: [__param_target]
target_label: instance - target_label: address
replacement: 127.0.0.1:9115 # Blackbox exporter address
- targets:
4. Running the Blackbox Exporter
Start the Blackbox Exporter using the configuration file:
./blackbox_exporter --config.file=blackbox.yml
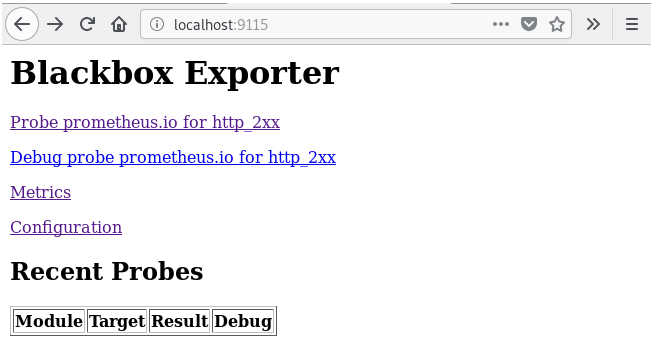
Ensure it is running correctly by accessing http://localhost:9115/probe?target=http://example.com/&module=http\_2xx in your browser. You should see metrics related to the probe.
Installing the Blackbox Exporter for Prometheus
To get started, you'll need to download the latest version of the Blackbox exporter for Prometheus.
Downloading the Blackbox Exporter
**Step 1: Go to the Prometheus downloads page.
-(1).png)
Prometheus downloads page
**Step 2: Filter the results by selecting Linux as the operating system.
**Step 3: Scroll down to find the Blackbox exporter executable, located just below the Alert Manager section.
**Step 4: At the time of this tutorial, the Blackbox exporter is at version 0.14.0. Click on the archive to download it. Alternatively, if you prefer using wget, copy the link and execute the following command:
**Step 5: Once the archive is downloaded, extract it with:
$ tar xvzf blackbox_exporter-0.14.0.linux-amd64.tar.gz
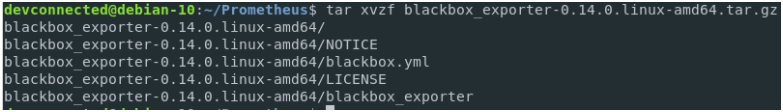
Extracting archive
**Step 6: The extracted archive will contain:
- **blackbox_exporter: The executable for the Blackbox exporter.
- **blackbox.yml: The configuration file for the Blackbox exporter.
**Step 7: For documentation on the blackbox_exporter executable, run:
$ cd blackbox_exporter-0.14.0.linux-amd64
$ ./blackbox_exporter -h
.png)
documentation
Creating a Service File for the Blackbox Exporter
As a system administrator, it's best practice to define service files for your executables rather than running them from your home directory.
**Step 1: Move the executable to a directory accessible to your user:
$ sudo mv blackbox_exporter /usr/local/bin
**Step 2: Create configuration folders for the Blackbox exporter:
$ sudo mkdir -p /etc/blackbox
$ sudo mv blackbox.yml /etc/blackbox
**Step 3: Create a user account for the Blackbox exporter:
$ sudo useradd -rs /bin/false blackbox
**Step 4: Set ownership and permissions:
$ sudo chown blackbox:blackbox /usr/local/bin/blackbox_exporter
$ sudo chown -R blackbox:blackbox /etc/blackbox/*
**Step 5: Create the service file:
$ cd /lib/systemd/system
$ sudo touch blackbox.service
**Step 6: Edit the service file:
$ sudo nano blackbox.service
Paste the following content:
[Unit]
Description=Blackbox Exporter Service
Wants=network-online.target
After=network-online.target
[Service]
Type=simple
User=blackbox
Group=blackbox
ExecStart=/usr/local/bin/blackbox_exporter \
--config.file=/etc/blackbox/blackbox.yml \
--web.listen-address=":9115"
Restart=always
[Install]
WantedBy=multi-user.target
**Step 7: Enable and start the service:
$ sudo systemctl enable blackbox.service
$ sudo systemctl start blackbox.service
**Step 8: Verify that the service is running:
$ curl http://localhost:9115/metrics
localhost
Binding the Blackbox Exporter with Prometheus
To bind the Blackbox exporter with Prometheus, add it as a scrape target in the Prometheus configuration file:
**Step 1: Edit the Prometheus configuration file located at /etc/prometheus/prometheus.yml:
$ sudo nano /etc/prometheus/prometheus.yml
**Step 2: Add the Blackbox exporter as a scrape target:
global:
scrape_interval: 15s
evaluation_interval: 15s
scrape_configs:
- job_name: 'prometheus'
static_configs:- targets: ['localhost:9090', 'localhost:9115']
**Step 3: Reload the Prometheus configuration by sending a SIGHUP signal to the Prometheus process:
$ ps aux | grep prometheus
Identify the PID and send the signal:
$ sudo kill -HUP
-(Custom)-(1).png)
Targets
**Step 4: Verify that Prometheus is scraping the Blackbox exporter by checking the target configuration at http://localhost:9090/targets.
Monitoring HTTPS Endpoints with the Blackbox Exporter
**Step 1: Edit the Blackbox configuration file to create a module for monitoring HTTPS endpoints:
modules:
http_prometheus:
prober: http
timeout: 5s
http:
valid_http_versions: ["HTTP/1.1", "HTTP/2"]
method: GET
fail_if_ssl: false
fail_if_not_ssl: true
tls_config:
insecure_skip_verify: true
basic_auth:
username: "username"
password: "password"
**Step 2: Check the configuration file for correctness:
$ blackbox_exporter --config.check
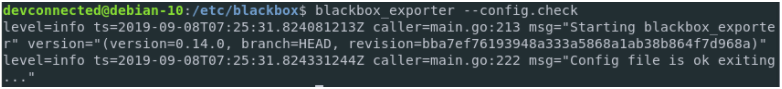
config.check
**Step 3: Reload the Blackbox exporter configuration by sending a SIGHUP signal:
$ ps aux | grep blackbox
Identify the PID and send the signal:
$ sudo kill -HUP
**Step 4: Bind the Blackbox Exporter module in Prometheus by editing the configuration file:
scrape_configs:
...
- job_name: 'blackbox'
metrics_path: /probe
params:
module: [http_prometheus]
static_configs:- targets:
- https://127.0.0.1:1234
relabel_configs:
- https://127.0.0.1:1234
- source_labels: [address]
target_label: __param_target - source_labels: [__param_target]
target_label: instance - target_label: address
replacement: 127.0.0.1:9115
- targets:
**Step 5: Reload the Prometheus configuration:
$ sudo kill -HUP
**Step 6: Verify the setup by checking the Prometheus graph endpoint with the following PromQL query:
probe_success{instance="https://127.0.0.1:1234", job="blackbox"}
Visualizing HTTP Metrics on Grafana
**Step 1: Install Grafana on your Linux host following the Grafana installation tutorial.
**Step 2: Import an existing Grafana dashboard:
- Click on the “Plus” icon on the left menu, and select “Import”.
- Enter the dashboard ID 7587 in the Grafana.com dashboard option.
- Select Prometheus as the data source, and click “Import”.
**Step 3: Your dashboard should now be visible, showing metrics about your HTTPS endpoints, including status, SSL status, expiry date, latencies, and DNS lookup times.
-(Custom)-(1).png)
dashboard
Congratulations! You have successfully installed the Blackbox Exporter with Prometheus, and you have visualized your metrics on Grafana.
Examples and Use Cases
1. HTTP Endpoint Monitoring
Supervising an HTTP endpoint is a typical scenario here. For extra parameters in the Blackbox Exporter, the target will be probed and metrics such as the response time, proper status code, and any error observed will be taken.
**Example Metrics
- probe_success: Indicates if the probe was successful (1) or not (0).
- probe_duration_seconds: Time taken for the probe to complete.
- probe_http_status_code: HTTP status code returned by the probe.
2. ICMP Ping Monitoring
Add a new module into blackbox.yml for the management of network latency and availability with the help of ICMP ping:
icmp:
prober: icmp
timeout: 5s
Update prometheus. yml to include the ICMP probe:
scrape_configs:
- job_name: 'blackbox_icmp'
metrics_path: /probe
params:
module: [icmp]
static_configs:- targets:
- 8.8.8.8 # Example target
relabel_configs:
- 8.8.8.8 # Example target
- source_labels: [address]
target_label: __param_target - source_labels: [__param_target]
target_label: instance - target_label: address
replacement: 127.0.0.1:9115
- targets:
3. DNS Monitoring
To monitor DNS resolution times, add a DNS module:
dns:
prober: dns
timeout: 5s
dns:
query_name: example.com
query_type: A
Update prometheus.yml:
scrape_configs:
- job_name: 'blackbox_dns'
metrics_path: /probe
params:
module: [dns]
static_configs:- targets:
- example.com
relabel_configs:
- example.com
- source_labels: [address]
target_label: __param_target - source_labels: [__param_target]
target_label: instance - target_label: address
replacement: 127.0.0.1:9115
- targets:
Best Practices for Setting Up the Blackbox Exporter
- **Modular Configuration: It is better to use different and recyclable modules in blackbox.yml for various types of probes, since it will make it easy to manage the probe type and maintain clarity.
- **Selective Probing: Make sure that you are questioning only most significant endpoints and do not waste time and resources in the further investigation of senseless endpoints.
- **Security Measures: There should be limitations made towards the Blackbox Exporter or otherwise its functionality should be encrypted to prevent unauthorized users to access it or compromise important information by communicating over the network in plain HTTP.
- **Resource Monitoring: It is critical to continuously assess and adjust such resources in the management of the exporting organization in a bid to avoid having this resource limiting the performance of the firm.
- **Enable Logging: Enabling the specification of fine-grained logs and monitoring of exporter health metrics help to reduce servicing difficulties.
Troubleshooting Issues
- **Check Configuration: Make sure that blackbox.yml and prometheus.yml configurations are correct, modules presented are defined properly and targets to be scraped are defined correctly.
- **Network Verification: Check to ensure that there are no network related problems that is making the Blackbox Exporter unable to access the target end points.
- **Adjust Timeouts: If the target endpoints take some time to respond then, it will help to increase probe timeouts so that probing is not aborted quickly.
- **Reduce Probe Frequency: To lower the resource usage and balance the load, it should reduce the number of probes it performs.
- **Access Control: The Blackbox Exporter setup must be guarded by isolation on the ports used and all traffic on these ports must be encrypted.