Prometheus Collector Registry (original) (raw)
Last Updated : 30 Apr, 2026
Prometheus has emerged as a cornerstone in monitoring and alerting for modern cloud-native applications and is the preferred choice for developers and operations teams due to its capabilities and ecosystem.
- Offers robust monitoring and alerting functionality
- Adapts to various metric types and structures
- Provides extensive integrations and tools for comprehensive monitoring solutions
- Trusted by operations and development teams for cloud-native infrastructure monitoring
- Enables effective tracking and alerting on application and system health
Features of Prometheus
**1. Time Series Database
- **Definition: All data in Prometheus is stored as time series. Each time series can be identified by means of a metric name and labels combination. It is a sequence of timestamped data points.
- **Labels: These are key-value pairs tied down to metrics. Their use allows Prometheus to distinguish dimensions for a specific metric, e.g., http_requests_total that may be separated into method (GET, POST) or status_code (200, 404).
- **Storage: Prometheus stores its data within a local time series database. Every data point comprises of a timestamp, label, metric name, and value. Prometheus can also integrate with remote storage solutions in order to offload or back up their data.
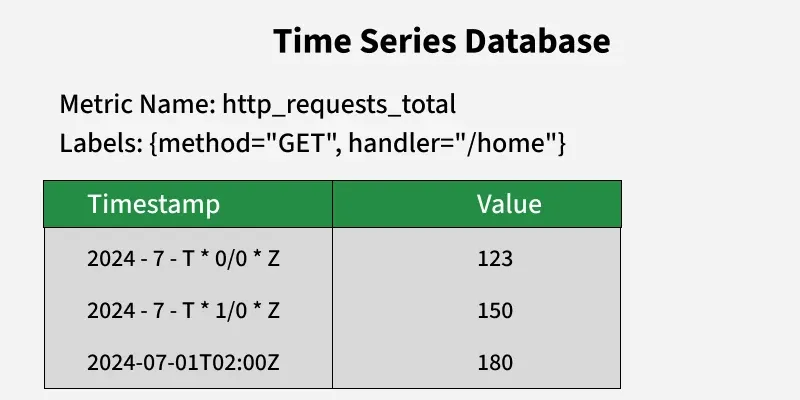
Time Series Database
2. The Pull Model
**Mechanism: Prometheus uses the pull model by scraping metrics from endpoints exposed through the monitored targets. Each target has a metrics endpoint (e.g., /metrics) that is queried by Prometheus at periods specified.
**Advantages:
- **Dynamic Service Discovery: Targets can be dynamically discovered by Prometheus through integrations with systems such as Consul, Kubernetes or directly mentioned in configuration files.
- **Reduced Load: The pull model reduces the burden on monitored applications as Prometheus controls the scrape frequency.
**Target Configuration: Prometheus configuration file specifies targets under scrape_configs section. Each target has parameters like job_name, scrape_interval and static_configs or service_discovery_configs.
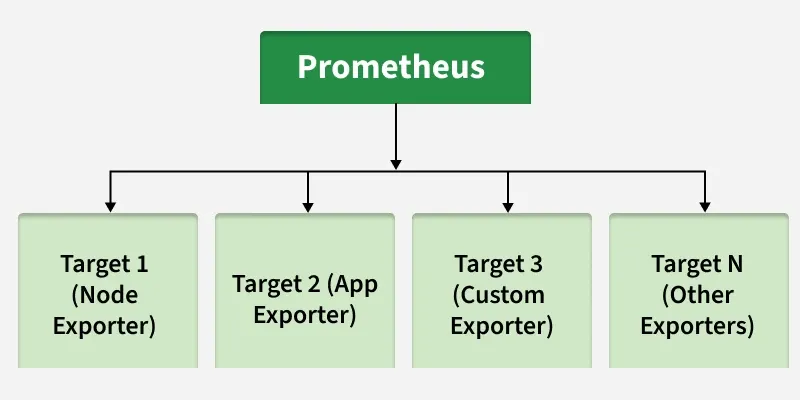
Prometheus target configuration
3. PromQL
**Purpose: Use of PromQL to request and analyze time series data stored in Prometheus enabling selection and aggregation.
**Features:
- **Selectors: They are used to filter metrics based on their labels just like {job="api-server"} selects all the metrics from the api-server job.
- **Operators: support for arithmetic (for instance +, -), comparison (for example >, <) as well as logical (and, or) operations.
- **Functions: It has rich functions for aggregation which include sum, avg), rate calculations such as rate, irate and so much more.
**Examples:
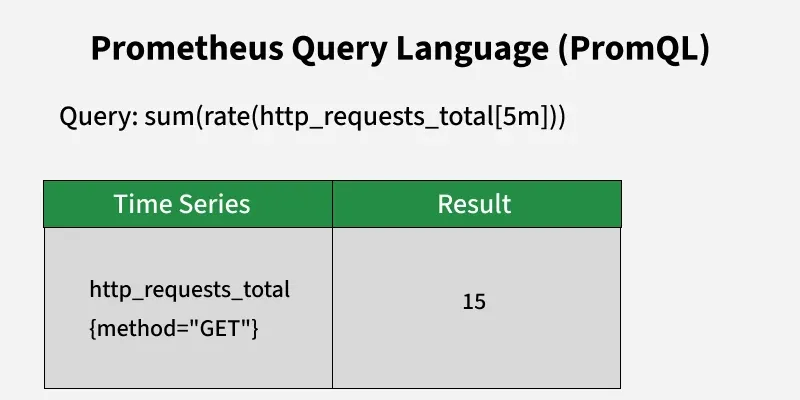
Prom QL
- **rate(http_requests_total[5m]): The number of http_requests_total per second during last 5 minutes
- **sum by (method) (rate(http_requests_total[1m])): Sum up request rates grouped by the method label.
Prometheus Client Libraries
**Role: Client libraries allow applications to serve internal metrics in a way that can be scraped by Prometheus.
**Features:
- **Metric Registration: Describe and create various kinds of forms (counters, gauges, histograms, summaries).
- **HTTP Endpoint: An APP makes available a/metrics endpoint; Prometheus scrapes the exported metrics.
- **Supported Languages: There are specifically official libraries for Go, Python, Java, Ruby and among the other languages.
**Example (Go):
package main
import ( "github.com/prometheus/client_golang/prometheus" "github.com/prometheus/client_golang/prometheus/promhttp" "net/http" )
var ( requestsTotal = prometheus.NewCounter(prometheus.CounterOpts{ Name: "http_requests_total", Help: "Total number of HTTP requests.", }) requestDuration = prometheus.NewHistogram(prometheus.HistogramOpts{ Name: "http_request_duration_seconds", Help: "Duration of HTTP requests in seconds.", Buckets: prometheus.DefBuckets, }) )
func init() { prometheus.MustRegister(requestsTotal) prometheus.MustRegister(requestDuration) }
func handler(w http.ResponseWriter, r *http.Request) { timer := prometheus.NewTimer(requestDuration) defer timer.ObserveDuration()
requestsTotal.Inc()
w.Write([]byte("Hello, World!"))
}
func main() { http.Handle("/metrics", promhttp.Handler()) http.HandleFunc("/", handler) http.ListenAndServe(":8080", nil) }
Collector Registry
**Definition: The collector registry is the central location of all collectors and metrics in an application.
**Usage:
- **Registration: All the metrics have to be registered at the registry before they are collected.
- **Default Registry: It is worth noting that the majority of client libraries have a default global registry to manage metrics.
- **Custom Registry: Not only can users create specific custom registries for metrics they want to exclude or for more detailed results.
**Example (Go):
var customRegistry = prometheus.NewRegistry() customRegistry.MustRegister(customMetric) http.Handle("/metrics", promhttp.HandlerFor(customRegistry, promhttp.HandlerOpts{}))
Collectors and Metric Types
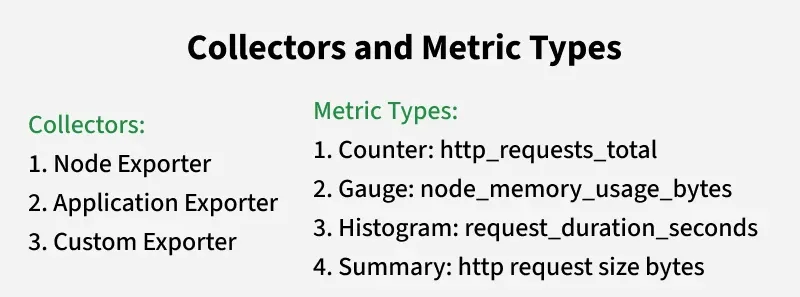
Collectors and Metrics Types
1. Counters:
- **Use Case: Best used for cases where the metric can only go up, such as the number of requests processed or the number of errors found.
- **Characteristics: Increasing only; its value can only be set at this initial value again when the application is off or closed.
**Example (Go):
var errors = prometheus.NewCounter(prometheus.CounterOpts{ Name: "errors_total", Help: "Total number of errors.", })
**2. Gauges:
- **Use Case: Best for values that can change, for example, current memory usage or the number of active sessions.
- **Characteristics: May be increased or decreased.
**Example (Go):
var temperature = prometheus.NewGauge(prometheus.GaugeOpts{ Name: "current_temperature", Help: "Current temperature in Celsius.", }) temperature.Set(25.5)
3. Histograms:
- **Use Case: Applied to track and classify patterns in values, like requests’ latencies, or response sizes.
- **Characteristics: Histograms take observations, tally them by an interval, hold a cumulative count, and sum measurements used in calculating averages.
**Example (Go):
var requestDuration = prometheus.NewHistogram(prometheus.HistogramOpts{ Name: "http_request_duration_seconds", Help: "Request duration in seconds.", Buckets: prometheus.DefBuckets, })
4. Summaries:
- **Use Case: Quantile estimates of observed values, like median, 90th percentile, can be obtained. It's applicable in the context such as latency or request size distributions.
- **Characteristics: Quantile calculation has configurable objectives.
**Example (Go):
var requestLatencies = prometheus.NewSummary(prometheus.SummaryOpts{ Name: "request_latencies_seconds", Help: "Request latency in seconds.", Objectives: map[float64]float64{0.5: 0.05, 0.9: 0.01, 0.99: 0.001}, })
Prometheus Collector Registry Demo
Step 1: Setting Up Prometheus
- Visit the Prometheus download page and download suitable file as per the operating system used.
.png)
Prometheus
**Extract Prometheus
**Note: All these commands are being run on Powershell. Users can also go for GitBash, Command Line Terminal.
tar -xvf prometheus-2.31.1.windows-amd64.tar.gz
.PNG)
Prometheus
Navigate to the Extracted Directory
cd $HOME\Downloads\prometheus-2.31.1.windows-amd64
Run Prometheus with default settings
.\prometheus.exe --config.file=prometheus.yml
Access Prometheus Web Interface
Open your web browser and go to http://localhost:9090.
.png)
Prometheus
Prometheus will start running on http://localhost:9090\.
Step 2: Installation Guide: Node Exporter
Node Exporter download page, download the Node Exporter binary.
.png)
Prometheus
To collect system metrics, extract and run the Node Exporter.
tar -xvf node_exporter-*.tar.gz
cd node_exporter-*
**Running Node Exporter
./node_exporter
Node Exporter will run on http://localhost:9100/metrics.
Best Practices
1. Maintain Uniform Naming
**Standard: Adopt snake_case concerning metric denominations and labels. This augments readability and uniformity among various metrics.
**Illustrations:
- **Metric denominations: http_requests_total, memory_usage_bytes.
- **Label denominations: job, instance, method, status_code.
2. Exploit Labels
- **Advisories: Employ labels to introduce dimensions to metrics, whilst circumventing high cardinality. Elevated cardinality (for instance, unique user identifiers) may induce performance and storage complications.
**Example (Go):
http_requests_total{method="GET", status_code="200"}
3. Monitor Performance
**Commence: Undertake regular supervision of the Prometheus server's operational performance and the consumption of resources.
**Metrics to Observe:
- **- prometheus_tsdb_head_series: Quantity of active time series.
- **- prometheus_tsdb_head_chunks: Count of in-memory chunks.
- **- prometheus_http_requests_total: Number of HTTP requests directed at the Prometheus server.
**Alert Mechanisms: Implement alert systems for essential performance metrics to facilitate prompt reactions to emergent issues.
4. Constrain Metric Volume
- **Avoidance: Refrain from high cardinality metrics and an overabundance of metrics to deter performance decline and excessive usage of storage.
- **Guidance: Where feasible, amalgamate like metrics and prioritize essential performance indicators.
- **Illustration: Employ sum or avg aggregations to lessen the detailedness of the collected data.
5. Utilize Aggregations:
**Objective: The reduction of stored metrics volume is facilitated by the aggregation of data, which aids in concentrating on elevated insights.
**Example (promql):
- **Aggregating request rates: sum(rate(http_requests_total[5m])) by (method)
- **Calculating average request duration: avg(rate(http_request_duration_seconds_sum[5m]) / rate(http_request_duration_seconds_count[5m]))
Examples and Use Cases
1. Infrastructure Monitoring
**Metrics:
- **node_cpu_seconds_total: CPU utilization decomposed by operational mode (user, system, idle).
- **node_memory_Active_bytes: Memory in active state measured in bytes.
- **node_filesystem_avail_bytes: Disk space available on filesystems measured in bytes.
2. Application Monitoring
**Metrics:
- **- http_requests_total: This metric gives you the total number of HTTP requests that your application has received. It's categorized by the method used (GET, POST, etc.) and the status code (200, 404, etc.).
- **- http_request_duration_seconds: This metric tells you how long it takes for your HTTP requests to complete, measured in seconds. It provides valuable insights into the overall performance of your application.
3. Alerting
- **Description: Setting up alerts for important stuff like high error rates or resource exhaustion.
- **Useful tools: Prometheus alerting rules and Alertmanager for notifications.
**Example Configuration (yaml file):
groups:
- name: example rules:
- alert: HighErrorRate expr: rate(http_requests_total{status="500"}[5m]) > 0.05 for: 5m labels: severity: critical annotations: summary: "High error rate detected" description: "More than 5% of requests are failing over the last 5 minutes."
4. Capacity Planning
- **Metrics: To do capacity planning we rely on certain metrics that give us insights into resource usage patterns. We look at historical data on CPU usage, memory utilization, and disk space. These metrics help us understand how our resources are being utilized and give us an idea of what to expect in the future.
- **Example: We can use metrics like "node_memory_MemAvailable_bytes" and "node_cpu_seconds_total" to gain insights into resource usage patterns. These metrics provide valuable information that helps us make informed decisions about resource allocation and scaling.