Block Diagram Reduction Control System (original) (raw)
Last Updated : 10 Mar, 2026
A control system may consist of several components. To show the function performed by each component in control engineering, we commonly use a diagram called the block diagram. A block diagram of a system is a pictorial representation of the functions performed by each component and of the flow of signals.
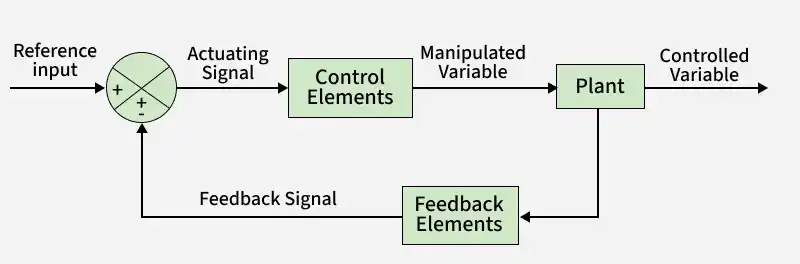
Block Diagram of Feedback Control System
A block diagram in control systems represents the functional relationships between components within a system. In a block diagram, all system variables are linked to each other through functional blocks. It uses blocks to represent various elements and arrows to indicate the flow of signals or information between these elements.
In a control system, a block diagram represents:
- An arrowhead pointing towards a block indicates the input, and the arrowhead leading away from the block represents the output. Such arrows are referred to as signals.
- The plus or minus at each arrowhead indicates whether the signal is to be added or subtracted.
- Summing points depict the summing or combining of signals.
- Take-off points indicate signals extracted for monitoring or feedback.
Concept
Block Diagram Reduction Technique in used to analyze and simplify the complex system represented by block diagram. A block diagram of a system is a pictorial representation of the the function performed by each component and of the flow of signals. Such a diagram depicts the inter relationships that exist the cause and effect. One of the important components of a control systems is the sensing device . The Block Diagram Reduction Technique involves manipulation of the block to get the easier and simpler representation of the systems. Our aim is to make the system simpler without changing its behavior. Reduction technique are important in control system for several reason
Objectives
Block diagram reduction is a technique used in control systems engineering to simplify complex interconnected systems represented by block diagrams. The main objectives of block diagram reduction include:
- **System Analysis : Block diagrams are used to represent the interconnections and relationships between various components or subsystems in a system. By shrinking the block diagram, engineers can analyze the entire system more efficiently and gain insight into its behavior, stability, and performance. Block diagrams are graphical representations of systems using interconnected blocks to represent various components or subsystems. Each block corresponds to a system element, and connections between blocks represent interdependencies. Block diagram analysis allows engineers to understand how different components interact and influence each other. This understanding is key to predicting and controlling the behavior of the entire system.
- **Simplification : Complex Systems in Real world systems can be very complex with many interconnected elements. Block diagram reduction simplifies these complex representations, making it easier to understand the basic properties of the system. Improved visualization in Simplifying the block diagram increases its visual clarity. Engineers can focus on the main components and relationships, making communication and understanding easier.
- **Design and synthesis : System Structure Modification during the design phase, engineers may need to modify the control system structure to meet specific requirements. Block diagram reduction allows engineers to easily manipulate the diagram, enabling iterative design processes. Engineers can use reduction techniques to optimize the system structure for desired performance metrics to ensure effective and efficient control.
- **Control system stability analysis : Stability is a critical aspect of control systems. Block diagram reduction helps in applying stability criteria to analyze system stability and ensures that the controlled system behaves predictably over time. Stability analysis guides controller design and helps engineers select appropriate control strategies to maintain stability under various operating conditions.
- **Troubleshooting and Debugging : When a control system behaves unexpectedly, engineers use block diagram reduction to isolate problematic components or connections. This process is essential for effective problem identification and resolution. Reduction allows engineers to iteratively analyze and modify the block diagram, helping them systematically approach and solve system failures.
A complicated block diagram involving many feedback loops can be simplified by a step-by-step rearrangement, using the rules of block diagram algebra. Some of these important rules are given.
Example of Block Diagram Reduction
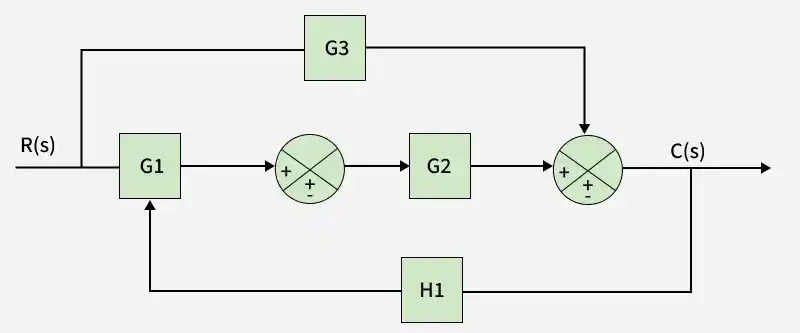
Example-of-block-diagram
**Step1: In the block diagram shown in Figure, move a takeoff point after a block
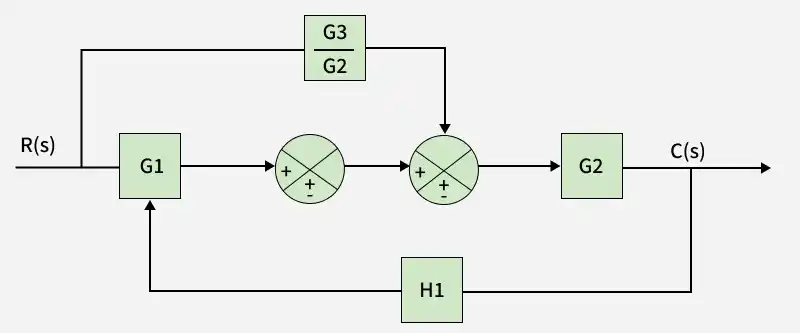
step 1
**Step2: Interchanging the summing points
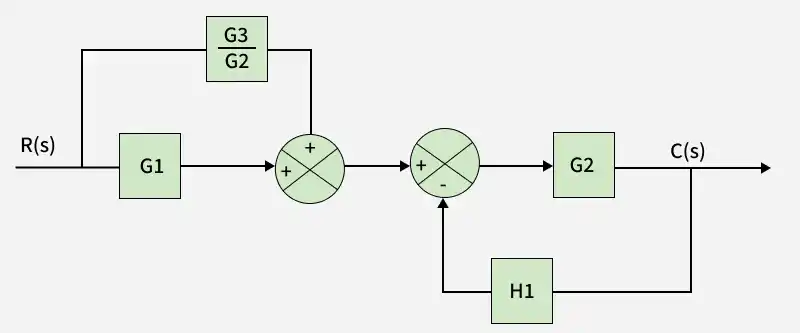
Step 2
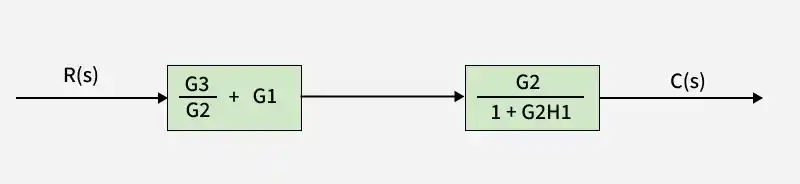
**Step 3: Combining G1 and G3/G2 into a gain of (G1+G3/G2) and simplifying the feedback arrangement into a single block the resultant block diagram is shown
Step 3
**Step 4: Combining the two blocks in Cascade into a single block the resultant block diagram is as shown in Figure:
\frac{C(s)}{R(s)} = G_3 + \frac{G_1 G_2}{1 + G_2 H_1}
Properties of Block Diagram Reduction
The block diagram reduction technique has several key properties that make it a powerful and versatile tool in control systems engineering. Here are some important features:
- **Linearity: Block diagram reduction techniques apply to linear time-invariant (LTI) systems. The property of linearity allows reduction methods to work effectively for systems described by linear equations.
- **Causality: Describes a principle where system output depends only on present and past inputs, not on future inputs. Block diagram reduction techniques maintain causality and ensure an accurate representation of cause–effect relationships within the system.
- **Block Diagram Rules: Block diagram reduction uses a set of systematic rules and transformations to simplify the overall structure. Common rules include series combination, parallel combination, and feedback reduction.
- **Algebraic Simplification: The reduction process involves algebraic manipulation of transfer functions and block diagram elements. Such manipulation allows engineers to combine and rearrange terms to obtain a simpler and more manageable representation.
- **Maintaining system dynamics: The reduction technique simplifies a block diagram without changing the basic dynamics of the system. Such simplification ensures an accurate representation of the behaviour of the original system.
- **Handling feedback: Block diagram reduction works effectively for handling feedback loops in a control system. Engineers apply suitable rules and techniques to simplify feedback structures while maintaining system stability and performance characteristics.
- **Educational tool: Reduction techniques in block diagrams serve as an educational tool for students to practice theoretical concepts in practical control system problems. Such learning improves understanding of system analysis and design.
Applications
- Hardware design can utilize block diagrams to represent component connections and system structure clearly.
- Electric system design can utilize block diagrams to show relationships between different electrical units and signal flow.
- Software design can use block diagrams to describe program structure and interaction between modules.
- Process flow diagrams can utilize block diagrams to represent step-by-step operation in an organized manner.
Advantages
- Functional operation of a system can be understood clearly through a block diagram representation.
- A block diagram provides useful information about overall system performance.
- Block diagram representation supports analysis and design of control systems.
- Construction of a block diagram becomes easier compared with analysing a large and complex system directly.
Disadvantages
- A block diagram representation of a system does not have a single unique form.
- Energy source present in a system does not appear in the block diagram representation.
- Block diagram reduction may cause omission of some important functions during simplification.
- Information about physical construction of a system does not appear in a block diagram.