How to Calculate Standard Deviation in Excel: Quick Guide (original) (raw)
Last Updated : 14 Apr, 2025
How to Find Standard Deviation in Excel
- Open MS Excel Spreadsheet >> Enter your Data
- Select the **Cell >>**Enter the Formula
- **For a sample: =STDEV.S(range)
- **For a population: =STDEV.P(range)
- Press Enter >>Verify your Result
Calculating the **standard deviation in Excel is a crucial step in data analysis, allowing you to measure the amount of variation or dispersion in a dataset. Whether you’re analyzing test scores, financial data, or any other set of values, understanding how to calculate **standard deviation can help you interpret the spread and reliability of your data.
In this guide, we’ll show you step-by-step how to calculate **standard deviation in Excel, and provide **standard deviation examples in Excel to help you apply this function in real-world scenarios. By the end of this article, you'll be able to confidently use Excel’s built-in functions to determine the standard deviation for your datasets.
Standard Deviation Formula
Standard deviation is a statistical measure that shows the spread or variability of a dataset around its mean. In Excel, the standard deviation can be calculated using formulas designed for sample or population datasets.
Standard Deviation Formula for a Sample
When analyzing a subset of the dataset, the formula is:
**Excel Formula: =STDEV.S(range)
where, Range is the range of cells that contains data.
Standard Deviation Formula for a Population
When analyzing the entire dataset, the formula is:
**Excel Formula =STDEV.P(range)
where, Range is the range of cells that contains data.
How to Calculate Standard Deviation in Excel
Standard deviation is a widely used statistical measure to understand how spread out the data is from its mean. Excel provides built-in functions that make it easy to calculate standard deviation for both population and sample datasets.
Step 1: Enter Your Data
Type your **data into a column of cells in Excel ****(e.g., A1 to A10)**.
Step 2: Choose a Cell for the Result
Click on an **empty cell where you want to display the standard deviation.
Step 3: Enter the Formula
**Type =STDEV.S() for a sample or **=STDEV.P() for a population.
Step 4:Select Your Data Range and Press Enter
Highlight the cells with your data, or manually type the range (e.g., A1:A10) inside the parentheses. Excel will calculate the standard deviation and show the result in the selected cell.
**Standard Deviation Examples in Excel
Once you have chosen the Function for your data type, writing the formula is straightforward and error-free. The syntax is simple and transparent, making it easy to apply Excel's standard deviation formulas. Let's discuss a few examples to know how to use excel to calculate standard deviation:
Calculating Standard Deviation of a Sample and Population
When calculating the standard deviation in Excel, you have different formulas to use depending on whether you are working with a sample or the entire population:
For population standard deviation, which applies to the entire list of values, you can use the **STEDV.P Function.
**For example: If your data is in the range A3:A30, the formula would be:
**=STDEV.S(A2:A14)
**Note:
- It is **mandatory to notice the results from these formulas may slightly differ, mainly while working with smaller sample sizes.
- If you are using Excel 2007 or earlier versions, you would use the **STDEVP and **STDEV functions.
Example 1: Calculating Sample Standard Deviation
In the below example we are having data with points of a student from different data structures. We will use Sample Standard Deviation formula to calculate standard deviation, Follow the below steps:
Step 1: Open the Excel Sheet
Open an **Excel Sheet with the **Data
Step 2: Enter Formula and Select the Range
Apply the Formula in the formula bar. Here we are applying the **STDEV.S formula. Enter the first and last argument

Enter Formula
Step 3: Press Enter and Check the Result
You can see the output after pressing the **enter key on your keyboard.

Example 2: Calculating Population Standard Deviation
Imagine you are analyzing the salaries of all employees in a small company. You have data for all employees, so you want to calculate the population standard deviation.
Step 1: Input Data
Enter the salaries into Excel, e.g., in **cells B2 to B6.
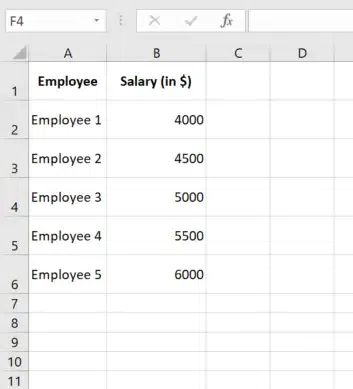
Input Data into the Sheet
Step 2: Enter Formula
Select an **empty cell (e.g., A8) and type the **formula =STDEV.P(B2:B6).
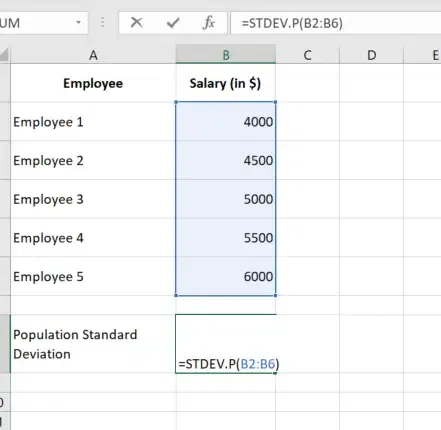
Enter the formula
Step 3: Press Enter
After pressing **Enter, Excel calculates the population standard deviation, which reflects the dispersion of salaries around the mean.
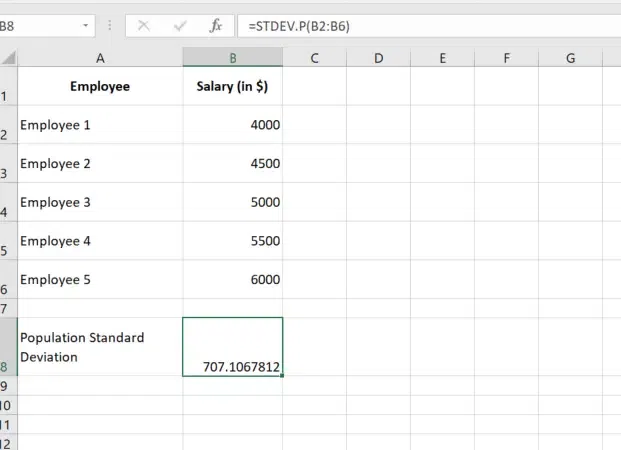
Preview Result
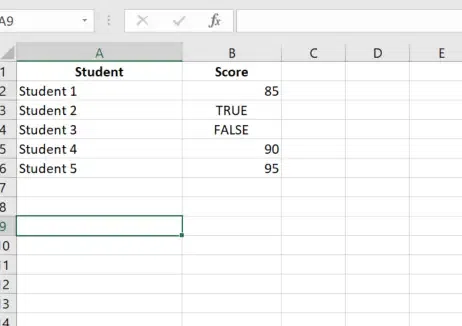
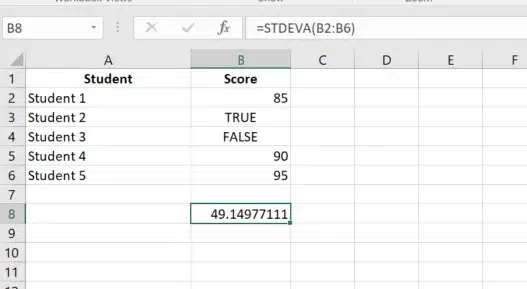
Example 3: Sample Standard Deviation with Logical Values
You are analyzing test scores from a subset of students. However, the dataset includes logical values (TRUE/FALSE), where:
Step 1: Input Data
Enter the scores into **cells B1 to B5. Logical values will be treated as **1 (TRUE) and **0 (FALSE) by Excel.
Input Data into the Sheet
Step 2: Enter Formula
Select an empty cell (e.g., B8) and type =STDEVA(B2:B6)
Step 3: Press Enter
Excel will calculate the sample standard deviation, taking logical values into account.
Preview Results
The inclusion of TRUE (1) and FALSE (0) adjusts the spread of data, which is reflected in the standard deviation result.
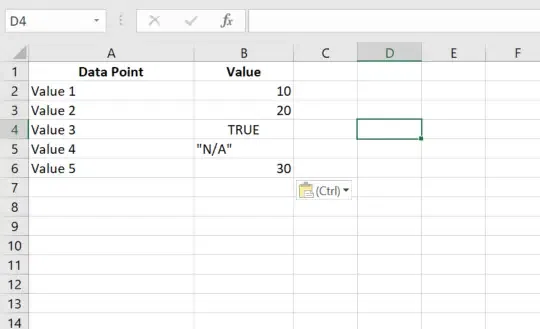
Example 4: Population Standard Deviation with Mixed Data Types
You have a dataset with numbers, text, and logical values. You want to calculate the population standard deviation, ensuring Excel ignores text and treats logical values as numbers.
Step 1: Input Data
Enter the data into Excel, e.g., in cells B2:B6.
Enter Data into the Sheet
Step 2: Enter Formula
Select an empty cell (e.g., B8) and type =STDEVPA(B2:B6).
Step 3: Press Enter
- Excel will ignore text values like "N/A."
- Logical values like TRUE will be treated as 1.
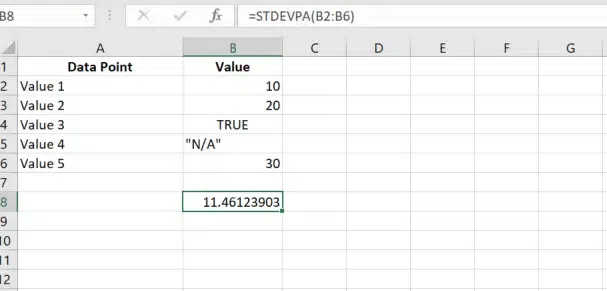
Preview Results
How to Add Standard Deviation Error Bars in Excel
If you want to visually represent the margin of errors with standard deviation, you can easily add standard deviation bars to your Excel chart.
Follow the steps to add standard deviation bars :
**Step 1: Create your Chart
Create your chart by selecting the data and choosing the appropriate chart type from the **Insert tab in the **Charts group.

Create your Chart
**Step 2: Select the Chart and Chart Element button
After creating the chart, click anywhere on the chart to activate the chart Elements and a dropdown menu, click the arrow next to" **Errorbars" to explore the options. Click on the **ChartElement button, to open a drop drop list.
**Step 3: Click on the arrow next to "Error Bars".
In the drop-down list, click on the arrow next to Error Bars, to expand the options.
**Step 4: Select the Standard Deviation
From the options, select ****"Standard deviation**"
.webp)
Select Error Bars > Standard Deviation
Standard Deviation vs. Standard Error in Excel
When it comes to estimating the variability in data, there is another statistical measure called "**the standard error of the mean" also known as "**standarderror".
- The **standarddeviationmeasures the dispersion or variability of a dataset around the mean. It tells you how spread out the individual data points are from the average.
- On the other hand, the **standarderror of the mean **provides an estimate of how much the sample mean is expected to deviate from the true population mean.
In simpler words, if we were to take multiple samples from the same population, the standard error of the mean would show us the range of variability between those sample means.
Since we calculate a single mean from a dataset rather than multiple means, the standard error of the mean is an estimation rather than a direct measurement. It is worth noting that the standard deviation is always larger than the standard error of the mean.
To calculate the standard error of the mean in your Excel worksheets, you can use the **STDEV.S Function in combination with **COUNT and **SORT. The below formula can be used:
**=STDEV.S(range)/SQRT(COUNT(range))
For example, if your sample data is located in cells A2 to A14 you can use the following formula to calculate the SEM:
**=STDEV.S(A2:A14)/SQRT(COUNT(A2:A14))
The result will provide an estimation of the standard error of the mean.

Types of Standard Deviation in Excel
Excel offers several built-in functions to calculate standard deviation, tailored to different data types and scenarios. These functions help users compute sample and population standard deviation and handle datasets with numerical, logical, or text values. Here's a breakdown of the types of standard deviation functions available in Excel:
Sample Standard Deviation Functions
Measures the variability of a subset (sample) of the entire population. The formula divides the variance by **n-1 (degrees of freedom) to account for bias when working with smaller datasets.
**STDEV.S: Used for a sample dataset, ignoring logical and text values. It’s the most accurate for analyzing small portions of data.
**Example: Calculating the standard deviation of 50 test scores out of a class of 500.
**Formula: =STDEV.S(A1:A10)
**STDEV: Similar to **STDEV.S, but available in older versions of **Excel (2007 and earlier). Use this for backward compatibility.
**Example: Estimating variability in sales performance from a subset of data.
**Formula: =STDEV(A1:A10)
**STDEVA: Includes logical values ****(TRUE, FALSE)** and text as numeric values ****(TRUE = 1, FALSE = 0)**. Suitable when logical or text data is relevant.
**Example: Analyzing survey responses with binary answers like "Yes" (True) or "No" (False).
**Formula: =STDEVA(A1:A10)
Population Standard Deviation Functions
Measures the variability of an entire dataset. The formula divides the variance by n (total number of data points) to provide an accurate measure for the whole dataset.
**STDEV.P: Used for the entire population, ignoring logical and text values. Ideal for precise calculations where all data points are included.
Example: Calculating salary dispersion for all employees in a company.
**Formula: =STDEV.P(A1:A100)
**STDEVP: The older version of **STDEV.P, used in **Excel 2007 and earlier versions. Retained for compatibility with older Excel files.
Example: Assessing variability in revenue data from all departments.
**Formula: =STDEVP(A1:A100)
**STDEVPA: Includes **logical values (TRUE, FALSE) and text as numeric values for population datasets.
Example: Evaluating feedback scores where non-numeric entries like "**No Opinion" are counted as zeros.
**Formula: =STDEVPA(A1:A100)
Conclusion
Now that you know **how to calculate standard deviation in Excel, you can apply this knowledge to analyze your data more effectively. Whether you're using **STDEV for sample data or **STDEV.P for the entire population, calculating **standard deviation in Excel is a straightforward process. By mastering these functions, you'll be better equipped to evaluate data variability, which can be essential for making informed decisions in business, science, and other fields.