Create a Gantt Chart in Excel [Free Template] (original) (raw)
Last Updated : 19 Mar, 2026
A Gantt Chart in Excel is a bar chart that visually represents a project schedule. It displays start and finish dates for project elements, aiding project managers in tracking progress and managing tasks effectively.
How to Create a Gantt Chart in Excel from Scratch
When it comes to creating a Gantt chart in Excel, we can either use a predesigned template or create our own from scratch. To manually make a Gantt chart in Excel, follow the steps given below for our reference:
**Step 1: Preparing our Data
This table must contain tasks, start dates, end dates, and duration. Duration can be easily calculated using a formula (END DATE - START DATE)
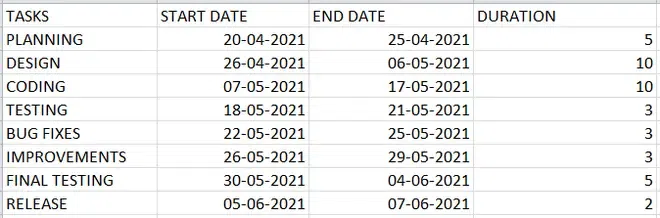
Create your Project Table
- "**Start Date" represents when a task starts.
- "**Duration" is the number of days a task will take. It’s already calculated.
**Step 2: Insert a Stacked Bar Chart
**Highlight the Data:
- Select the **Tasks, **Start Date, and **Duration columns ( Do not Select End Date).
**Insert Stacked Bar Chart:
- Go to the **Insert tab on the Excel ribbon.
- In the **Charts group, click on the **Insert Bar Chart dropdown.
- Select the **Stacked Bar Chart option.
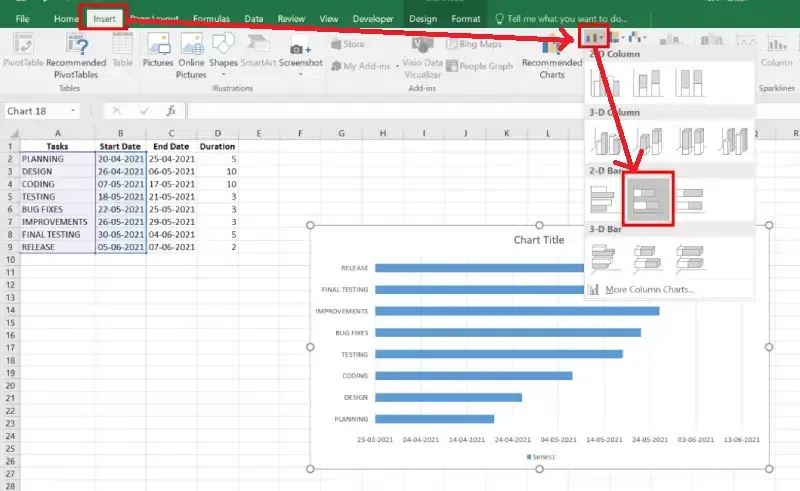
Select the Data >> Go to Insert Tab>> Select Stacked Column Chart
**Step 3: Add Data to the Chart
**Right-Click on the Chart:
- Click anywhere on the bar chart.
- Right-click and choose **Select Data.
**Add a New Series:
- In the **Select Data Source window, click the **Add button.
- A small box named **Edit Series will appear.
- Type ****"Duration"** in the **Series Name field.
- Click the small icon (**above the OK button) in the next field to enter the data.
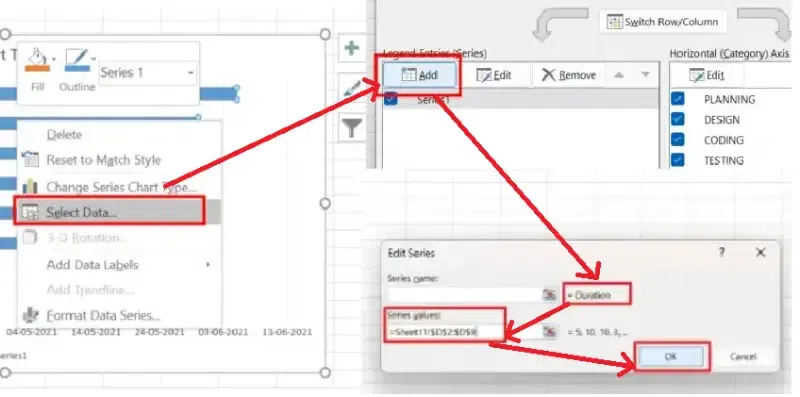
Right Click >> Select Data>>Click on Add Icon>>Select Duration >> Select the Data Range >> Click ok
The Result will Look like this.
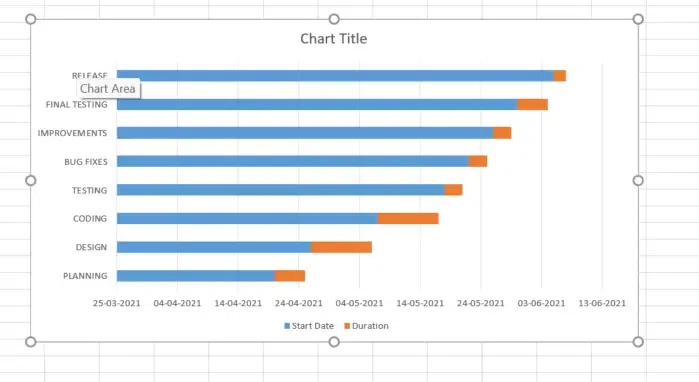
Chart Created
**Step 3: Format the Chart
**Remove Start Date Bars
- Click the bars representing **Start Date.
- Right-click and select **Format Data Series.
- Set **Fill to **No Fill.
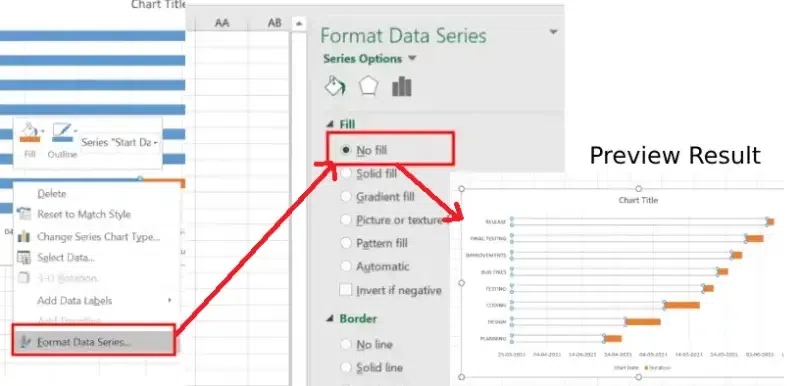
Right Click >> Format Data Series>> No Fill>>Preview Result
**Reverse Task Order
- Right-click on the vertical axis (Task names).
- Select **Format Axis.
- Check **Categories in reverse order.
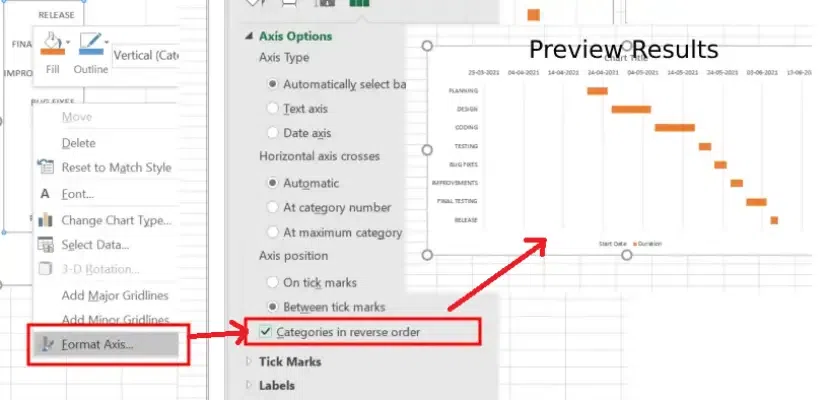
Right Click >>Format Axis >> Select "Categories in Reverse Order >> Preview Result
**Step 4: Customize the Horizontal Axis
- Right-click on the horizontal axis (dates).
- Choose **Format Axis.
- Adjust the **Minimum Bound and **Maximum Bound to align with our project timeline.
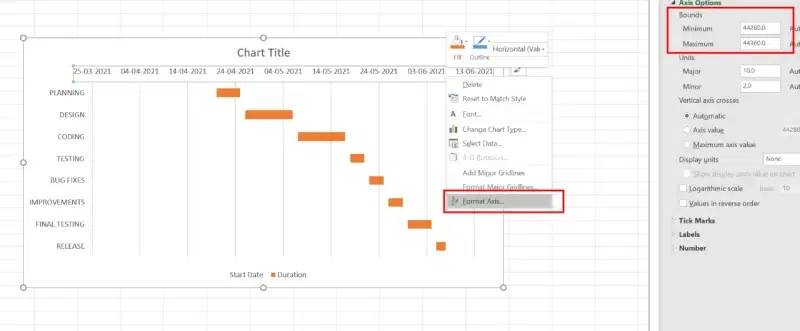
Right Click >> Select "Format Axis >>Set "Minimum and Maximum" Bounds
**Step 5: Add Task Descriptions
- Right-click on the chart and choose **Select Data.
- Select the series for **Tasks and click **Edit.
- Highlight the list of tasks in our data table.
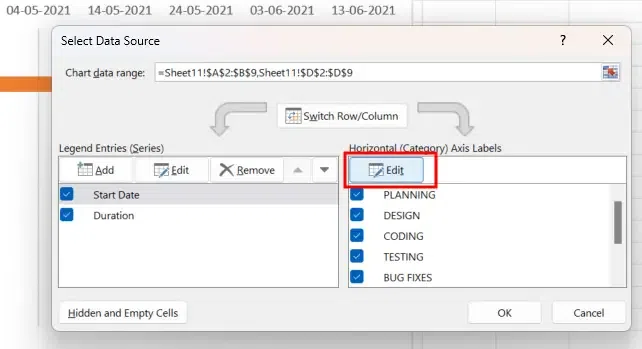
Right Click>> Click on "Select Data " >>Click on Edit
**Step 6: Customize the Chart and Preview Results
**Overlap Bars:
- Right-click on the **bars (Duration) and select **Format Data Series.
- Set **Overlap to **100% and adjust the **Gap Width.
**Change Bar Colors:
- **Right-click on the bars and **customize the fill color for better visualization.
**Add Chart Title:
- Click on the **chart title to edit it.
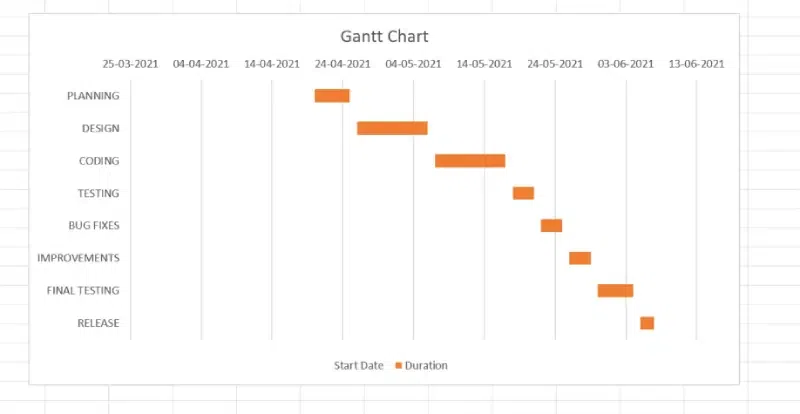
Customize the Chart and Preview Results
**Tips: we can design our Excel Gantt Chart in different ways by changing the fill color, border color, shadow and even applying the 3-D format. All these options are available in the Format Data Series window.
**Using Free Excel Gantt Chart Template
If we prefer not to create a Gantt chart manually, Excel offers free Gantt chart templates to simplify the process.
**How to Use a Gantt Chart Template in Excel
Follow the below steps to learn how to use a gantt chart in Excel:
**Step 1: Open Excel
Launch Excel on our computer.
**Step 2: Click on the **File menu and select **New.
Go to the File Menu and Click on "New"
**Step 3: Search for Gantt Chart
Type "Gantt Chart" in the search bar to find available templates.
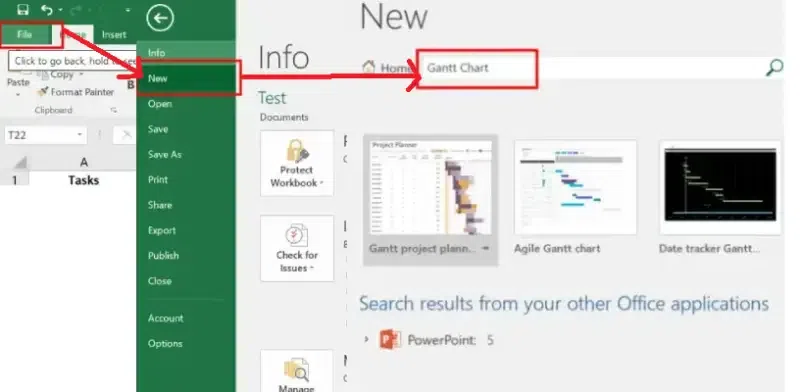
Go to File >> Click on "New" >> Search for Gantt Chart
**Step 4: Select and Create
Choose a template that fits our needs and click **Create.
**Step 5: Customize the Chart
Add our project tasks, start dates, and durations to tailor the Gantt chart for our project.