Count Frequency of Columns in Pandas DataFrame (original) (raw)
Last Updated : 14 Apr, 2025
When working with data in Pandas counting how often each value appears in a column is one of the first steps to explore our dataset. This helps you understand distribution of data and identify patterns. Now we’ll explore various ways to calculate frequency counts for a column in a Pandas DataFrame.
1. Using value_counts() to Count Frequency
Simplest and most widely used method to count frequencies in a column is using value_counts(). It returns a Pandas Series where the index represents the unique values and the values represent their counts.
Python `
import pandas as pd data = { 'Fruits': ['Apple', 'Banana', 'Apple', 'Orange', 'Banana', 'Apple', 'Orange'], 'Quantity': [3, 2, 3, 1, 2, 3, 1] } df = pd.DataFrame(data) fruit_counts = df['Fruits'].value_counts()
print(fruit_counts)
`
**Output:
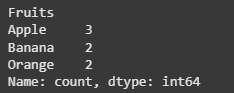
Count frequency
This method also allows you to customize the output with parameters like normalize=True (to get relative frequency) and ascending=True (to sort counts in ascending order).
2. Using groupby() with size()
When you want to group data by a specific column and count the frequency of each group groupby() combined with size() is used for it.
Python `
fruit_counts = df.groupby('Fruits').size() print(fruit_counts)
`
**Output:
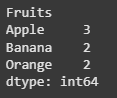
Using groupby with size
The groupby() method can also be extended to multiple columns to count the frequency of values across combinations of categories.
3. Using crosstab() to count frequency
If we're dealing with complex data and need to count the occurrences of values across multiple categories or dimensions we can use **crosstab() method. It works particularly well when we need to see how values from one column relate to values from another column.
Python `
fruit_counts = pd.crosstab(index=df['Fruits'], columns='count') print(fruit_counts)
`
**Output:
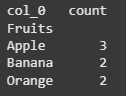
Using crosstab
crosstab() provides a table format which is helpful for cross-dimensional analysis.
**4. Using a Pivot Table
A **pivot table is another tool in Pandas which can be used to calculate frequency counts. It works well if we're looking to summarize data across multiple dimensions.
Python `
fruit_counts = df.pivot_table(index='Fruits', aggfunc='size') print(fruit_counts)
`
**Output:

Using Pivot Table
By mastering these methods you can efficiently count and analyze the frequency of values in your data for better insights and more informed decision-making.