How to Change the Line Width of a Graph Plot in Matplotlib with Python? (original) (raw)
Last Updated : 12 Nov, 2020
Prerequisite : Matplotlib
In this article we will learn how to Change the Line Width of a Graph Plot in Matplotlib with Python. For that one must be familiar with the given concepts:
- Matplotlib : Matplotlib is a tremendous visualization library in Python for 2D plots of arrays. Matplotlib may be a multi-platform data visualization library built on NumPy arrays and designed to figure with the broader SciPy stack. It was introduced by John Hunter within the year 2002.
- Graph Plot : A plot is a graphical technique for representing a data set, usually as a graph showing the relationship between two or more variables.
- Line Width : The width of a line is known as line width. One can change the line width of a graph in matplotlib using a feature.
Approach
- Import packages
- Import or create the data
- Draw a graph plot with a line
- Set the line width by using line-width feature ( lw can also be used as short form ).
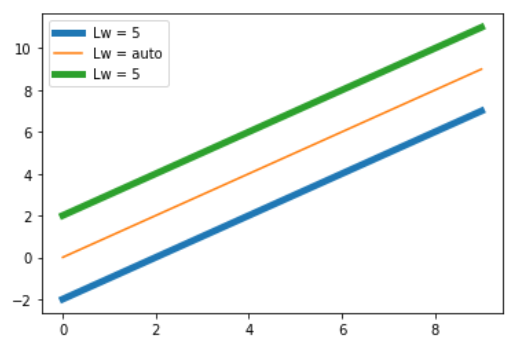
Example 1:
Python3 `
importing packages
import matplotlib.pyplot as plt import numpy as np
create data
x_values = np.arange(0, 10) y_values = np.arange(0, 10)
Adjust the line widths
plt.plot(x_values, y_values - 2, linewidth=5) plt.plot(x_values, y_values) plt.plot(x_values, y_values + 2, lw=5)
add legends and show
plt.legend(['Lw = 5', 'Lw = auto', 'Lw = 5']) plt.show()
`
Output :
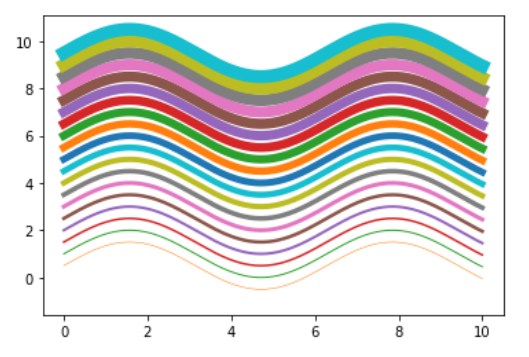
Example 2 :
Python3 `
importing packages
import matplotlib.pyplot as plt import numpy as np
create data
x_values = np.linspace(0, 10, 1000) y_values = np.sin(x_values)
Adjust the line widths
for i in range(20): plt.plot(x_values, y_values + i0.5, lw=i0.5)
plt.show()
`
Output :
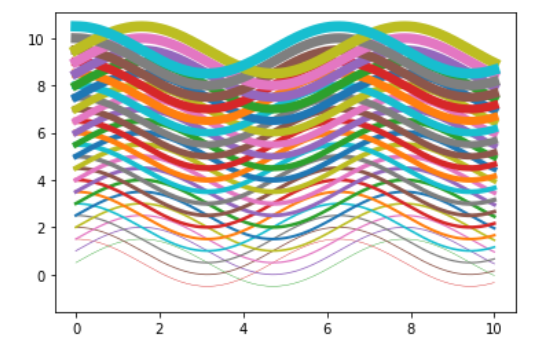
Example 3 :
Python3 `
importing packages
import matplotlib.pyplot as plt import numpy as np
create data
x_values = np.linspace(0, 10, 1000)
Adjust the line widths
for i in range(20): plt.plot(x_values, np.sin(x_values) + i0.5, lw=i0.4) plt.plot(x_values, np.cos(x_values) + i0.5, lw=i0.4)
plt.show()
`
Output :