How to combine Groupby and Multiple Aggregate Functions in Pandas? (original) (raw)
Last Updated : 04 Apr, 2025
Pandas is an open-source Python library built on top of **NumPy. It allows data structures and functions to manipulate and analyze numerical data and time series efficiently. It is widely used in data analysis for tasks like data manipulation, cleaning and exploration. One of its key feature is to **group data and apply **multiple aggregate functions for more comprehensive and insightful analyses.
1. Groupby()
dataframe.groupby() function in **Pandas allows you to group the data in a DataFrame based on a particular column or multiple columns. This function splits the data into subsets, apply the function to each subset independently and then combines the results back into a DataFrame or Series. This is commonly used in **data aggregation, **summarizing and **transforming operations.
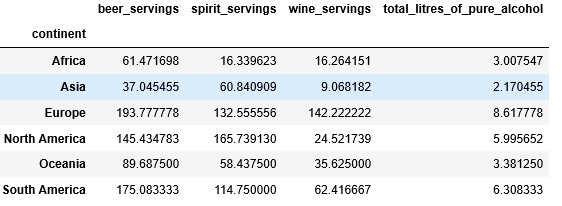
For example, we will group drinking data by continent and for this we will import the dataset and group the data by the continent column.
df.groupby('continent'): Groups the DataFrame (df) by the ‘continent’ column.[['beer_servings'...]]: Selects the specified columns within the grouped data..mean(): Computes the mean (average) for each of these columns, grouped by continent. Python `
import pandas as pd df = pd.read_csv("https://bit.ly/drinksbycountry") grouped_data = df.groupby('continent')[['beer_servings', 'spirit_servings', 'wine_servings', 'total_litres_of_pure_alcohol']].mean() print(grouped_data)
`
**Output:
2. Aggregate()
dataframe.agg() function in Pandas allows you to apply multiple aggregation functions at once. It’s useful when you want to calculate different statistics like sum, mean, min, max, etc for a particular column. This method provides flexibility by allowing you to perform multiple operations on the same column or different columns in a single line of code, streamlining the analysis process.
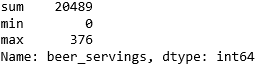
For example, let’s now explore Aggregation of Beer Servings to calculate multiple statistics, such as the sum, minimum and maximum values.
.agg(['sum', 'min', 'max']): Applies aggregate functions (sum,min, andmax) to thebeer_servingsPython `
beer_aggregates = df['beer_servings'].agg(['sum', 'min', 'max'])
print(beer_aggregates)
`
**Output:
Combining groupby() with Multiple Aggregation Functions
By combining the groupby() function with agg() you can calculate multiple aggregations for different columns grouped by a particular column. This allows for more granular and insightful data analysis.
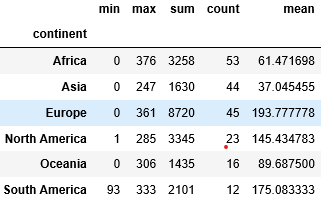
Let’s now combine groupby() with agg() to calculate multiple statistics for the beerservings, spiritservings and wineservings columns, grouped by the continent column.
min=('beer_servings', 'min'): For each group (i.e., each continent), calculate the minimum value of thebeer_servingscolumn and assign it to a new column calledmin.max=('beer_servings', 'max'): For each group, calculate the maximum value of thebeer_servingscolumn and assign it to a new column calledmax.sum=('beer_servings', 'sum'): For each group, calculate the sum of thebeer_servingscolumn and assign it to a new column calledsum.count=('beer_servings', 'count'): For each group, calculate the count (number of non-null entries) of thebeer_servingscolumn and assign it to a new column calledcount.mean=('beer_servings', 'mean'): For each group, calculate the mean (average) value of thebeer_servingscolumn and assign it to a new column calledmean. Python `
aggregated_data = df.groupby('continent').agg( min=('beer_servings', 'min'), max=('beer_servings', 'max'), sum=('beer_servings', 'sum'), count=('beer_servings', 'count'), mean=('beer_servings', 'mean') )
print(aggregated_data)
`
**Output:
Groupby() with Multiple Aggregate Function
Here we can see we get a detailed analysis of data by applying different aggregation functions like sum, mean, count, min and max. It helps in doing complex analysis and making informed decision which was not possible earlier.