How to Create Flowchart in Excel: StepbyStep Guide (original) (raw)
Last Updated : 30 Dec, 2024
A **Flowchart is a valuable tool for visualizing processes, workflows, or decision-making paths, making it easier to communicate ideas and identify improvements. This article provides a clear, step-by-step guide on how to create a Flowchart in Excel, using its shapes and formatting tools to design customized diagrams. Whether you’re mapping a business process, illustrating a project workflow, or teaching a concept, this guide will help you create professional and effective Flowcharts to simplify complex information.
**Disclaimer: Ensure your process steps are accurate and well-structured to create a clear and meaningful Flowchart.
What is a Flowchart
A Flowchart is a diagram that represents a process, workflow, or decision-making path using symbols like **rectangles, **arrows, and **diamonds. Excel, though primarily a data tool, provides tools like Shapes and SmartArt to create detailed and professional flowcharts.
**Basic Shapes used in Excel Flowcharts
You don’t need to be an expert in flowchart programming. All you need are the basic building blocks to make your flowchart clear and easy to understand. The four main shapes we’ll use in this tutorial are:
| **Symbol | **Meaning |
|---|---|
| **Oval | Start or End of a process |
| **Rectangle | A process step or action |
| **Diamond | A decision point |
| **Arrows | Shows the flow/direction |
How to Create a Flowchart in Excel
Flowcharts are used to show processes and make complex workflows easier to understand in areas like business, project management, education, and healthcare. They help improve communication, spot problems, and make decision-making faster. Follow the steps below to learn how to create a flowchart in Excel:
**Step 1: Set Up Your Excel Worksheet
Before starting, adjust your Excel worksheet for better alignment and structure:
- Open a **new Excel worksheet.
- Go to the **View tab > Uncheck **Gridlines to get a clean workspace.
- Adjust the column widths and row heights to create a square grid:
- Select all cells by clicking on the **top-left corner (next to "A" and "1").
- Right-click > Choose **Column Width > Enter **2.
- Right-click > Choose **Row Height > Enter **15.
This creates a grid layout, making it easier to align your shapes.
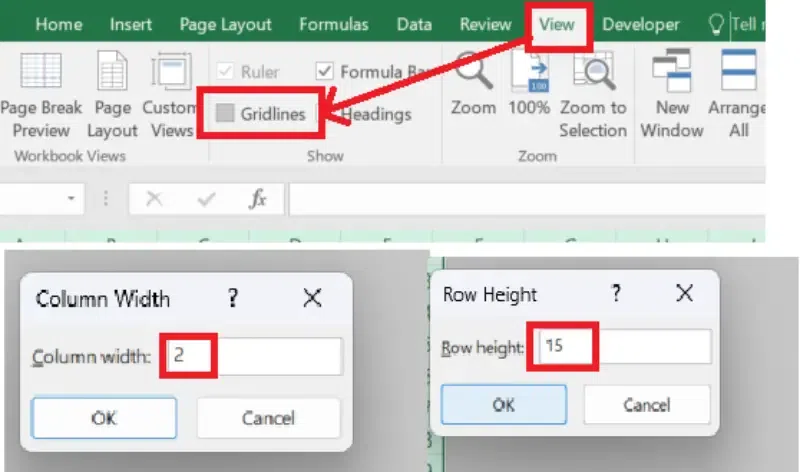
Go to View Tab >> Uncheck Gridlines >>Set the Column Width to "2" and Row Height to "15"
**Step 2: Insert Flowchart Shapes
Flowcharts use symbols like rectangles, diamonds, and arrows to represent steps, decisions, and flow. Here’s how to add them:
- Go to the **Insert tab on the Excel ribbon.
- In the **Illustrations group, click on **Shapes.
- In the dropdown, go to the **Flowchart section to select shapes:
- **Rectangle: Represents a process step.
- **Diamond: Represents a decision point (Yes/No or True/False).
- **Oval: Represents the start or end of the flowchart.
- **Arrow Lines: Connect shapes to show the flow of the process.
- **Add Shapes to the Worksheet:
- Click on the desired shape and draw it on the grid.
- Resize and position the shape as needed.
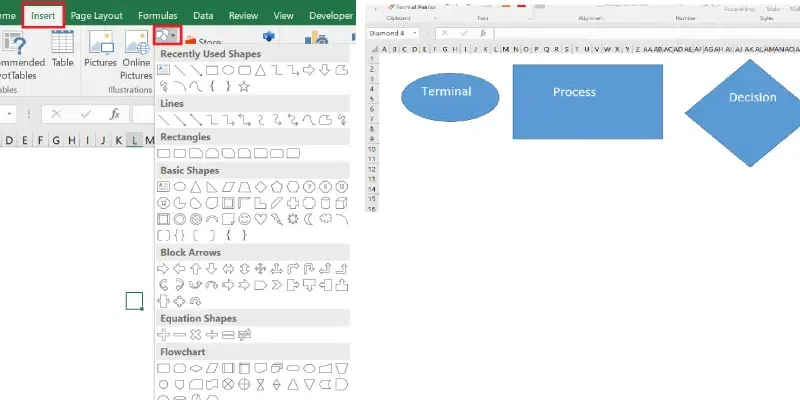
Select and Insert the Shapes as per Required
**Step 3: Add Text to Shapes
- Click on the shape you added.
- Start typing directly to add a label or description (e.g., "Start Process," "Decision Point").
- Format the text using the **Home tab (e.g., font size, color, and alignment).
**Step 4: Connect the Shapes Using Arrows
To show the flow between steps, use arrows:
- Go to the **Insert tab > Click **Shapes.
- Choose an **Arrow Line (e.g., straight or elbow connector).
- Click on the edge of one shape and drag the arrow to the next shape.
- Use the **yellow handles on arrows to adjust their position and length.
- To add text to arrows (e.g., "Yes" or "No"):
- Right-click the arrow > Select **Add Text > Type your text.
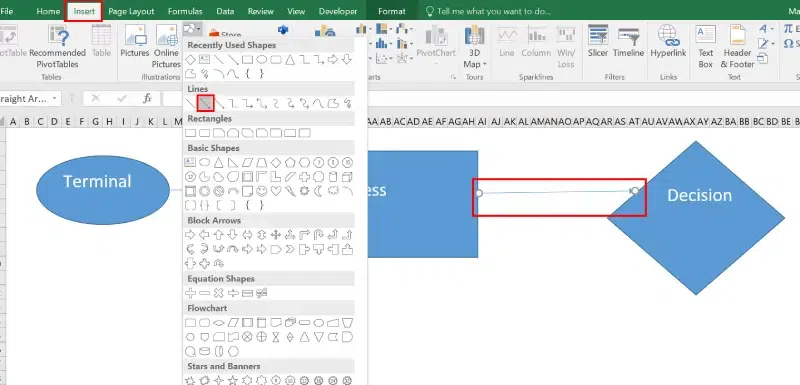
Insert the Arrow
**Step 5: Align and Format the Flowchart
To make your flowchart look professional and clean:
**1: Align Shapes
- Select all the shapes by holding **Ctrl and clicking each shape.
- Go to the **Shape Format tab.
- In the **Arrange group, use **Align options:
- Align Left, Center, or Right.
- Align Top, Middle, or Bottom.
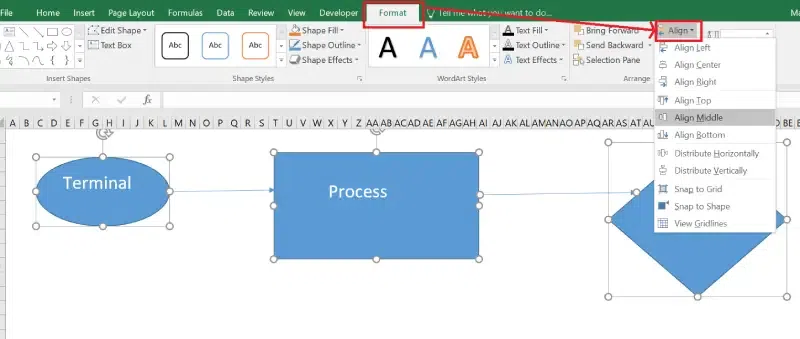
Select the Shapes >>Go to Format Tab >> Select Align>> Choose your Option
**2: Format Shapes and Arrows
- Click on a shape or arrow.
- Go to the **Shape Format tab to customize:
- **Shape Fill: Change the color of shapes.
- **Shape Outline: Adjust border color and thickness.
- **Shape Effects: Add shadows, glow, or other effects.
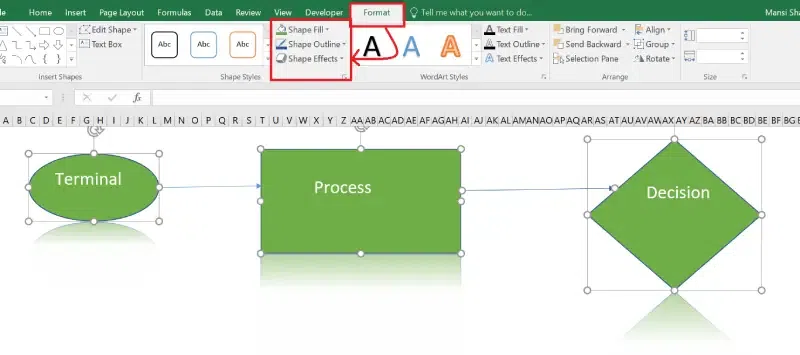
Select the Shapes>> Go to Format Tab>> Choose Options
**Step 6: Group and Save the Flowchart
Once your flowchart is complete, you can group the elements and save your work:
- Select all the shapes and arrows by dragging your mouse over the entire flowchart.
- Right-click and choose **Group > **Group to lock the flowchart together.
- Save the file: Press **Ctrl + S and name your Excel workbook.
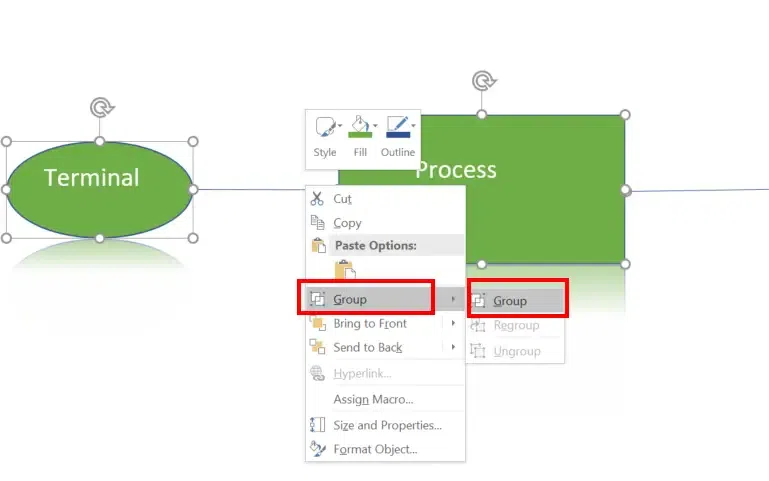
Right Click and Select "Group"
**Step 7: Export or Print Your Flowchart
If you need to share the flowchart:
- Go to **File > Save your Excel flowchart as a template > Choose **PDF to export the flowchart as a PDF.
To print the flowchart:
- Adjust the print area by selecting the flowchart and going to **Page Layout > **Print Area > **Set Print Area.
**Tips for Creating a Professional Flowchart
- **Keep It Simple: Avoid adding too many shapes or excessive text.
- **Use Consistent Formatting: Apply uniform colors, font sizes, and alignments.
- **Start with a Plan: Sketch the flowchart on paper before creating it in Excel.
- **Label Clearly: Ensure each shape and arrow has clear, concise text.
- **Save Frequently: Save your work regularly to avoid data loss.
**Limitations of Excel Flowcharts
- **Manual Creation: Excel does not support automatic flowchart generation; all shapes, lines, and connections must be added manually.
- **Limited Templates: Excel provides basic flowchart tools but lacks advanced or specialized templates for complex workflows.
- **Alignment Issues: Aligning and spacing shapes can be time-consuming, especially for large flowcharts.
- **Not Scalable: Excel flowcharts become cluttered and difficult to manage as processes grow in size and complexity.
- **Limited Interactivity: Unlike dedicated flowchart tools, Excel lacks interactive features like clickable elements or dynamic flowchart automation.
Conclusion
Creating a Flowchart in Excel is an excellent way to transform complex processes into clear, actionable visuals. By using Excel’s built-in tools, you can design tailored Flowcharts that meet your specific needs, whether for business, education, or personal projects. A well-designed Flowchart enhances understanding, streamlines communication, and supports decision-making. Start leveraging Excel’s capabilities to create impactful Flowcharts that bring clarity and efficiency to your workflows!