How to Fill Between Multiple Lines in Matplotlib? (original) (raw)
Last Updated : 08 Oct, 2021
With the use of the fill_between() function in the Matplotlib library in Python, we can easily fill the color between any multiple lines or any two horizontal curves on a 2D plane.
Syntax: matplotlib.pyplot.fill_between(x, y1, y2=0, where=None, step=None, interpolate=False, *, data=None, **kwargs)
Example 1: Color between the curve of the mathematical function f(x)=sin(x)
Python3
import pylab as plt
import numpy as np
x = np.arange( 0.0 , 2 , 0.01 )
y1 = np.sin( 2 * np.pi * x)
y2 = 0.8 * np.sin( 4 * np.pi * x)
fig, (ax1, ax2, ax3) = plt.subplots(
`` 3 , 1 , sharex = True , figsize = ( 6 , 6 ))
ax1.fill_between(x, y1)
ax1.set_title( 'fill between y1 and 0' )
ax2.fill_between(x, y1, 1 )
ax2.set_title( 'fill between y1 and 1' )
ax3.fill_between(x, y1, y2)
ax3.set_title( 'fill between y1 and y2' )
ax3.set_xlabel( 'x' )
fig.tight_layout()
Output:

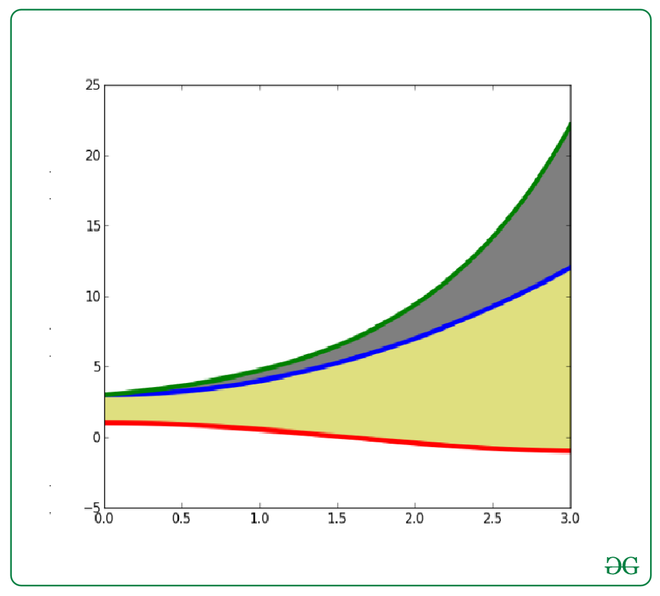
Example 2: Color between the curve of the mathematical function f(x)=cos(x) and f(x)=exp(x) :-
Python3
import pylab as plt
import numpy as np
X = np.linspace( 0 , 3 , 200 )
Y1 = X * * 2 + 3
Y2 = np.sin(X)
Y3 = np.cos(X)
plt.plot(X, Y1, lw = 4 )
plt.plot(X, Y2, lw = 4 )
plt.plot(X, Y3, lw = 4 )
plt.fill_between(X, Y1, Y2, color = 'k' , alpha = . 5 )
plt.fill_between(X, Y1, Y3, color = 'y' , alpha = . 5 )
plt.show()
Output:
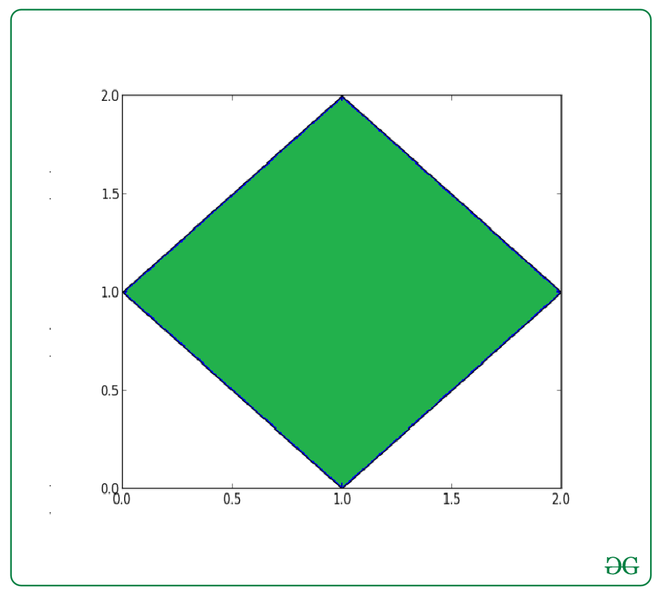
Example 3: Color the Rhombus :-
Python3
import matplotlib.pyplot as plt
x = [ 1 , 2 , 1 , 0 ]
y = [ 2 , 1 , 0 , 1 ]
plt.fill(x, y)
plt.show()
Output: