iostat Command in Linux (original) (raw)
Last Updated : 21 Apr, 2026
The iostat command in Linux is used to monitor CPU usage and input/output (I/O) statistics for devices and partitions. It helps administrators understand how storage devices are performing and whether the system is experiencing disk bottlenecks.
- Monitors CPU utilization.
- Tracks disk read/write activity.
- Displays I/O transfer rates.
- Reports on device utilization.
**Note: The iostat command is part of the sysstat package. If it is not installed on your system, you'll need to install it first.
Installing iostat (sysstat package)
1. On Red Hat / CentOS / Fedora:
**Command:
sudo yum install sysstat
2. On Debian / Ubuntu / Linux Mint:
sudo apt-get install sysstat
Example: Displaying Basic CPU and Device Statistics
**Command:
iostat
- The output is divided into two main sections:
**Output:
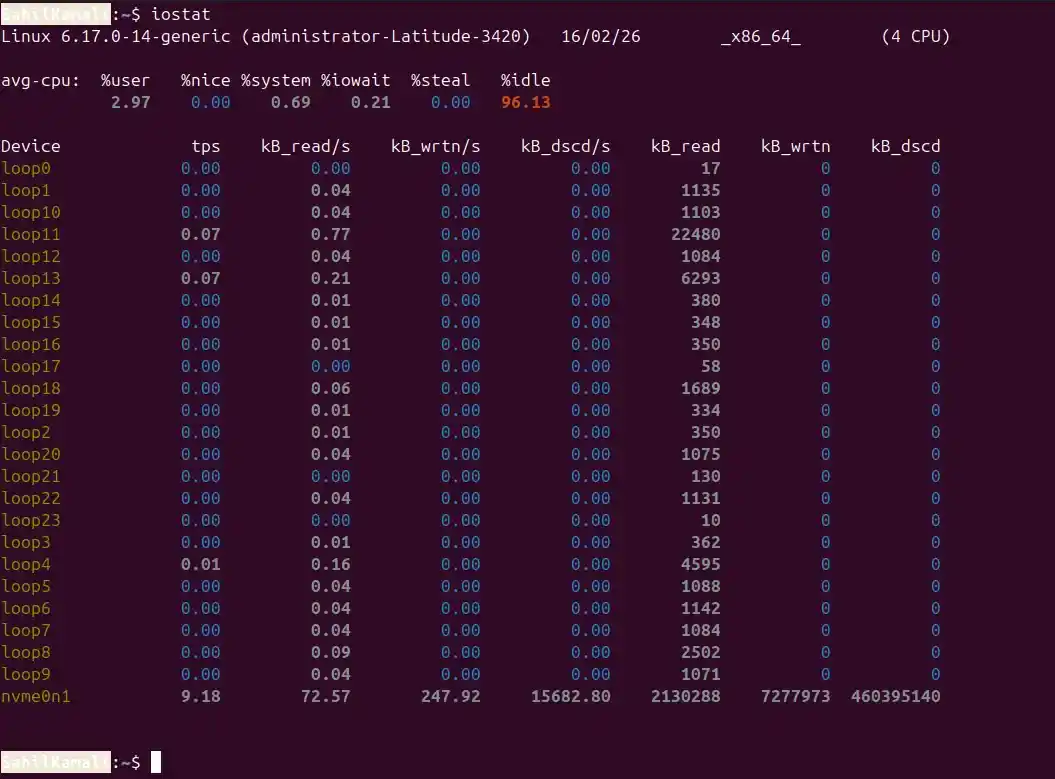
1. CPU Report (avg-cpu Section)
The avg-cpu section gives us an overview of CPU utilization:
- ****%user:** Represents the percentage of CPU time spent on user processes (non-kernel). In the example, it's 2.97%.
- ****%nice:** Shows the percentage of CPU time spent on processes with a "nice" value, which affects the priority of the process. In the example, it's 0.00%, meaning no process is running with an adjusted priority.
- ****%system:** Percentage of CPU time spent on system (kernel) processes. In the example, it's 0.69%.
- ****%iowait:** Time spent by the CPU waiting for I/O operations to complete. The example shows 0.21%, indicating a minimal amount of I/O wait time.
- ****%steal:** The percentage of time the CPU spends waiting for resources from a hypervisor in a virtualized environment. In this example, it's 0.00%, meaning no significant virtualization wait.
- ****%idle:** The percentage of time the CPU is idle and there are no pending I/O operations. Here, it's 96.13%, indicating the system is mostly idle.
2. Device Utilization Report
The device section provides information about I/O operations for each disk device:
- **Device: The name of the device or partition. In the example, you can see loop0, loop1, etc., and a physical disk nvme0n1.
- **tps: The number of transfers per second to the device. nvme0n1 shows 9.18 tps, meaning it is actively transferring data.
- **kB_read/s: The amount of data read from the device per second in kilobytes. For nvme0n1, it's 72.57 kB/s.
- **kB_wrtn/s: The amount of data written to the device per second in kilobytes. nvme0n1 shows 247.92 kB/s.
- **kB_dscd/s: The amount of discarded data (if any) per second. In the example, there is no discarded data, so it's 0.00 kB/s.
- **kB_read: Total kilobytes read from the device.
- **kB_wrtn: Total kilobytes written to the device.
- **kB_dscd: Total kilobytes discarded.
Syntax
iostat [options] [device_name] [interval] [count]
- **options: Optional flags to customize the output.
- **device_name: Specific device or partition name (e.g., /dev/sda). If omitted, iostat reports on all devices.
- **interval: Time delay (in seconds) between each report. If omitted, it reports statistics once.
- **count: Number of reports to generate. If omitted, iostat will continue indefinitely.
**Note: If interval and count are not specified, iostat displays a single report.
Options of iostat Command
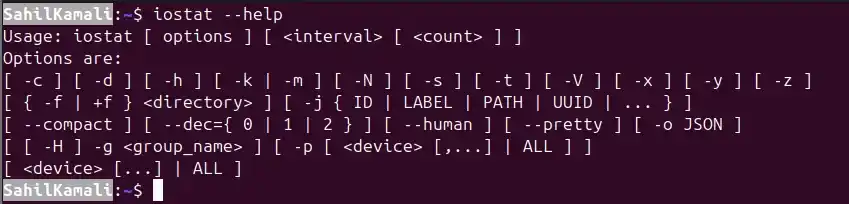
1. -h, --help
Displays the help message and exits. This option provides usage syntax and a list of available options.
**Syntax:
iostat --help
**Output:
2. -x: Extended Statistics
Displays detailed (extended) I/O statistics for devices. This option provides deeper insight into disk performance and is useful for troubleshooting and performance analysis.
**Syntax:
iostat -x
**Output:

- **avg-cpu: Shows CPU utilization statistics.
- **Device: Lists the block devices being monitored.
- ****%util:** Percentage of time the device was busy handling I/O requests.
- **await: Average time (in milliseconds) for I/O requests to be completed (includes queue time and service time).
- **svctm: Average service time (in milliseconds) for I/O requests.
- **avgqu-sz: Average queue length (number of requests waiting).
- **avgrq-sz: Average size of I/O requests.
- **r/s, w/s: Number of read and write requests per second.
- **rsec/s, wsec/s: Number of sectors read/written per second.
- **rrqm/s, wrqm/s: Number of merged read/write requests per second.
**Example: -xd: Extended Statistics for Devices Only
When -x is combined with -d, the command shows extended statistics for devices only (excluding CPU statistics).
**Command:
iostat -xd
**Output:

3. -c: CPU Statistics Only
Displays only CPU statistics. Provides CPU utilization metrics, including %user, %system, %idle, etc..
**Syntax:
iostat -c
**Output:

4. -d: Device Statistics Only
Displays only device (disk) statistics without CPU information.
**Syntax:
iostat -d
**Output:

5. -k: Kilobytes
Displays statistics in kilobytes per second instead of the default block units.
**Syntax:
iostat -k
**Output:

6. -m: Megabytes
Displays statistics in megabytes per second, making the output easier to read for high-throughput systems.
**Syntax:
iostat -m
**Output:

7. -j: Persistent Device Names
Displays statistics using persistent device names instead of standard /dev/sdX names. This is useful when device names change after reboot.
**Syntax:
iostat -j ID mmcbkl0 sda6 -x -m 2 2
- Here, ID specifies the type of persistent name.
**Example:

8. -p: Partitions
Displays statistics for block devices and all their partitions automatically. If a specific device is provided, it shows statistics for that device and its partitions.
**Syntax:
iostat -p
**Output:

9. -N: LVM / Device Mapper Names
Displays registered device-mapper names (such as LVM logical volumes) instead of underlying physical device names.
**Syntax:
iostat -N
**Output:

Using Interval and Count
You can monitor statistics at regular intervals by specifying
**Syntax:
iostat [options] interval count
- **interval: Time in seconds between reports
- **count: Number of reports to generate
Example 1: Display statistics every 2 seconds, 3 times
This command displays CPU and device statistics in kilobytes every 2 seconds and generates 3 reports.
**Command:
iostat -k 2 3
**Output:

Example 2: CPU statistics only, 2-second interval, 2 reports
This command shows only CPU utilization statistics every 2 seconds and stops after 2 reports.
**Command:
iostat -c 2 2
**Output:

Example 3: Specific devices with interval
To show sda6 and sda7 device only report with 2 seconds interval and 2 times reports.
**Command:
iostat -d sda7 sda6 2 2
**Output:
