ss command in linux (original) (raw)
Last Updated : 5 May, 2026
The ss command (Socket Statistics) is an important Linux utility used to display detailed information about network sockets. It helps analyze network connections, monitor open ports and troubleshoot connectivity issues efficiently. The command provides details about TCP, UDP and other socket types, including their states and associated processes. Due to its speed and efficiency, it is widely used as a modern replacement for netstat.
- Displays detailed information about network sockets
- Shows TCP, UDP, RAW and other connection types
- Helps analyze active connections and listening ports
- Useful for debugging network and performance issues
- Faster and more efficient than older tools like netstat
Example: List All Sockets
The ss command without any options displays a list of all sockets along with their connection details.
**Command:
ss
**Output:
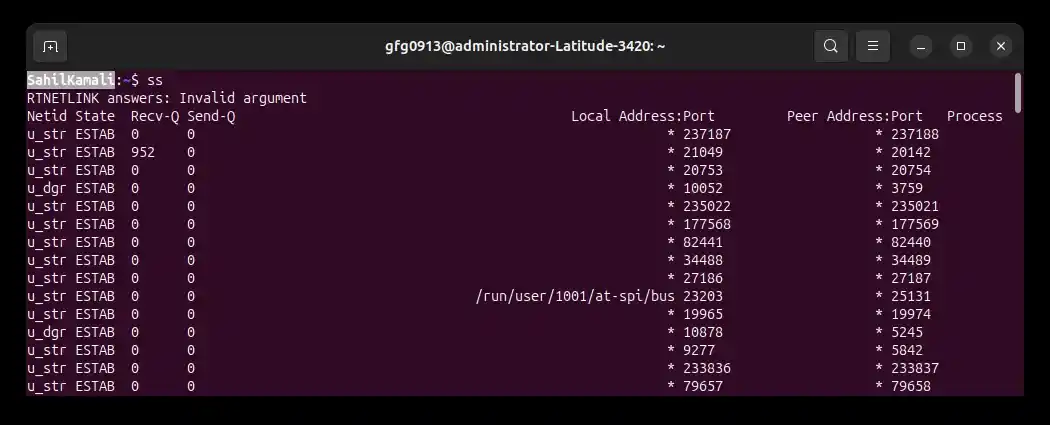
- **State: Indicates the current status of the socket, such as LISTEN (waiting for connections) or ESTABLISHED (active communication between systems)
- **Recv-Q / Send-Q: Shows the amount of data queued for receiving or sending, which helps identify delays or bottlenecks in communication
- **Local Address:Port: Displays the IP address and port number on your system where the socket is created or listening for connections
- **Peer Address:Port - Represents the remote system’s IP address and port number connected to your machine
- **Protocol Type: Specifies the communication protocol used by the socket, such as TCP (connection-oriented) or UDP (connectionless
Syntax
ss [options]
- **[options]: Flags that modify the output, such as filtering by protocol, state or address
Options Available in the `ss` command Linux
| Options | Description |
|---|---|
| -t | Display TCP sockets |
| -u | Display UDP sockets |
| -l | Display listening sockets |
| -a | Display all sockets (listening and non-listening) |
| -e | Display detailed information (including users) |
| -i | Display internal information |
| -n | Show numerical addresses instead of resolving |
| -r | Display the routing table |
| -s | Display summary statistics |
| -4 | Display only IPv4 sockets |
| -6 | Display only IPv6 sockets |
| -o | Show timers |
| -p | Show process information |
| -P | Show process statistics |
| --timewait | Display TIME-WAIT sockets |
| --listening | Display listening sockets |
| --all | Display all sockets (listening and non-listening) |
| --numeric | Show numerical addresses instead of resolving |
| --extended | Display extended socket information |
| --resolve | Resolve hostnames |
| --processes | Display process information |
| --processes-raw | Display process information in raw format |
| --summary | Display summary statistics |
1. -t: Display TCP Sockets
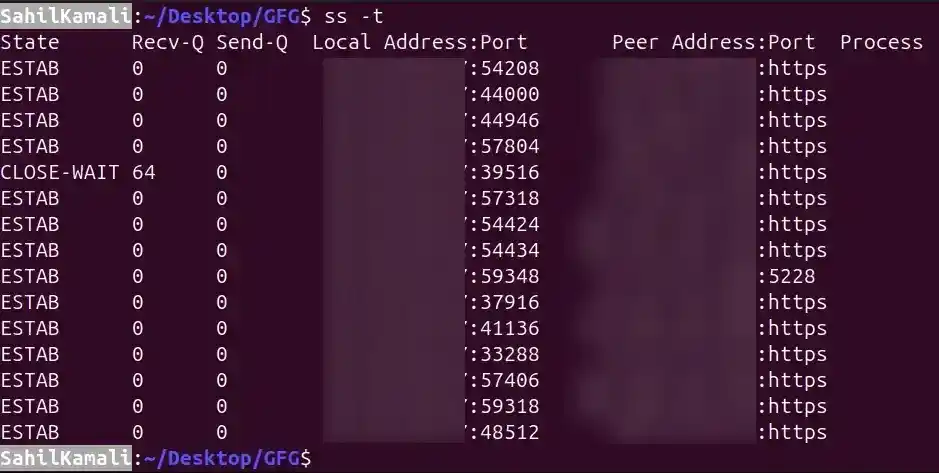
Shows only TCP (Transmission Control Protocol) sockets, which are connection-oriented and ensure reliable data transfer. This is particularly useful for monitoring web servers, SSH sessions or other services that require a stable connection.
**Command:
ss -t
**Output:
2. -u: Display UDP Sockets
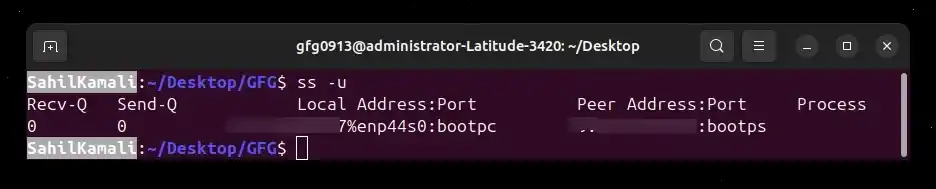
Displays only UDP (User Datagram Protocol) sockets, which are connectionless and used for applications like DNS, streaming, or VoIP. Useful for identifying open UDP ports, monitoring traffic patterns or troubleshooting packet loss in services that don’t require a connection handshake.
**Command:
ss -u
**Output:
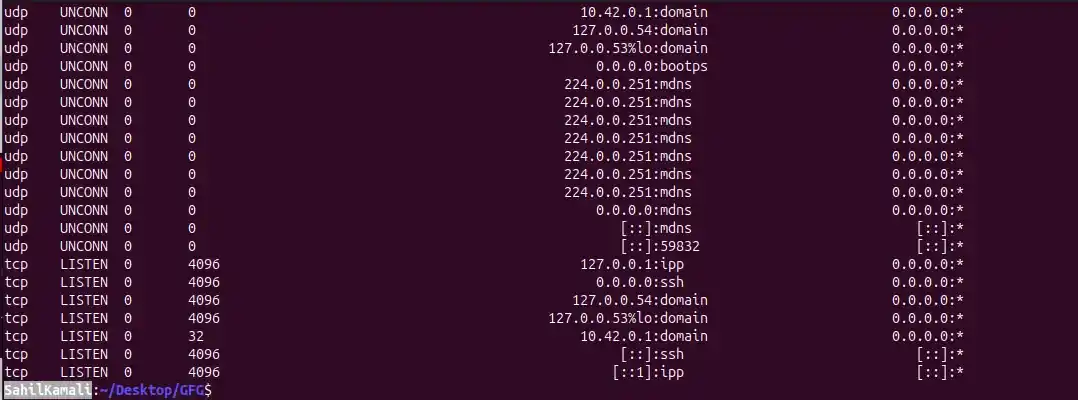
3. -l: Display Listening Sockets
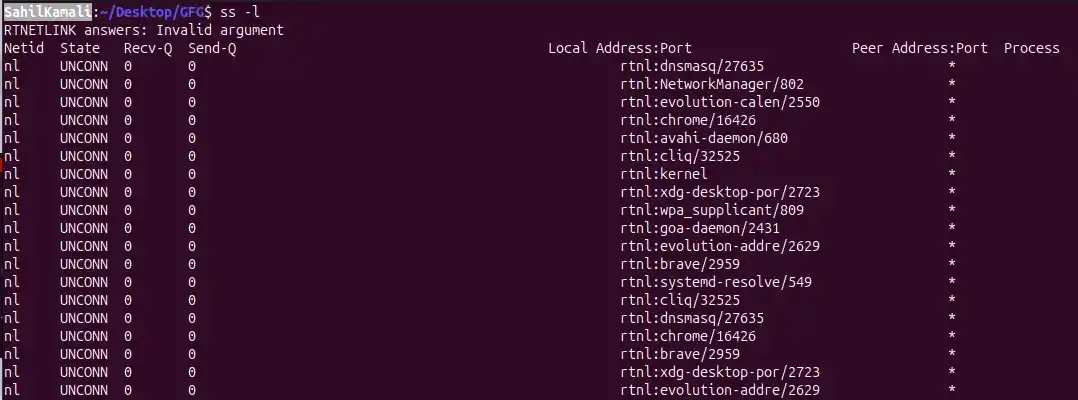
Shows sockets that are actively listening for incoming connections. Helps you identify which services or applications are available on your system and which ports they are using.
**Command:
ss -l
**Output:
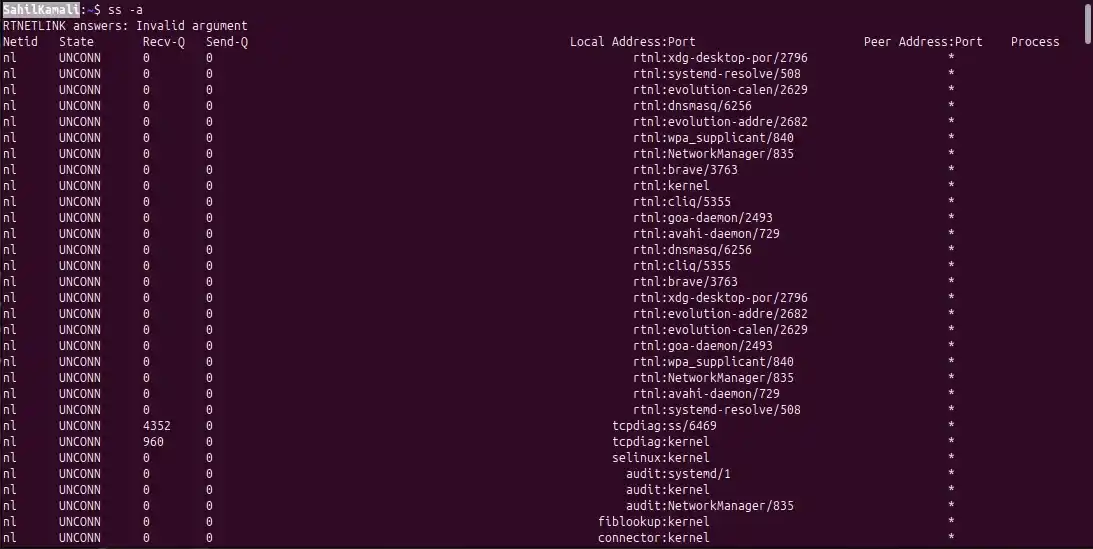
4. -a: Display All Sockets
Displays both listening and non-listening sockets, giving a complete view of all network connections. Useful when you need an overall picture of network activity, including established sessions and passive listening ports. It can help diagnose network congestion or unexpected connections.
**Command:
ss -a
**Output:
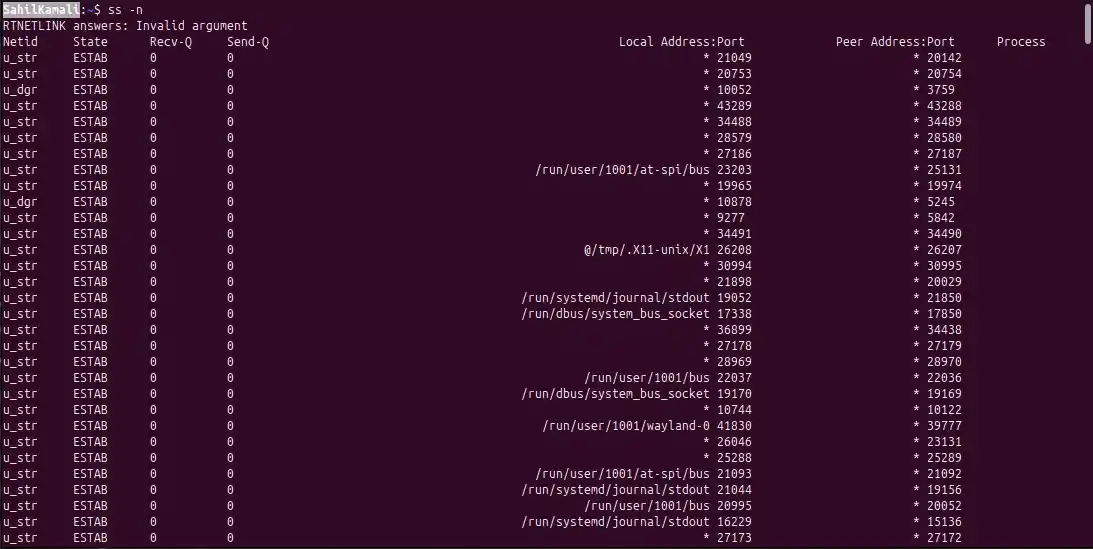
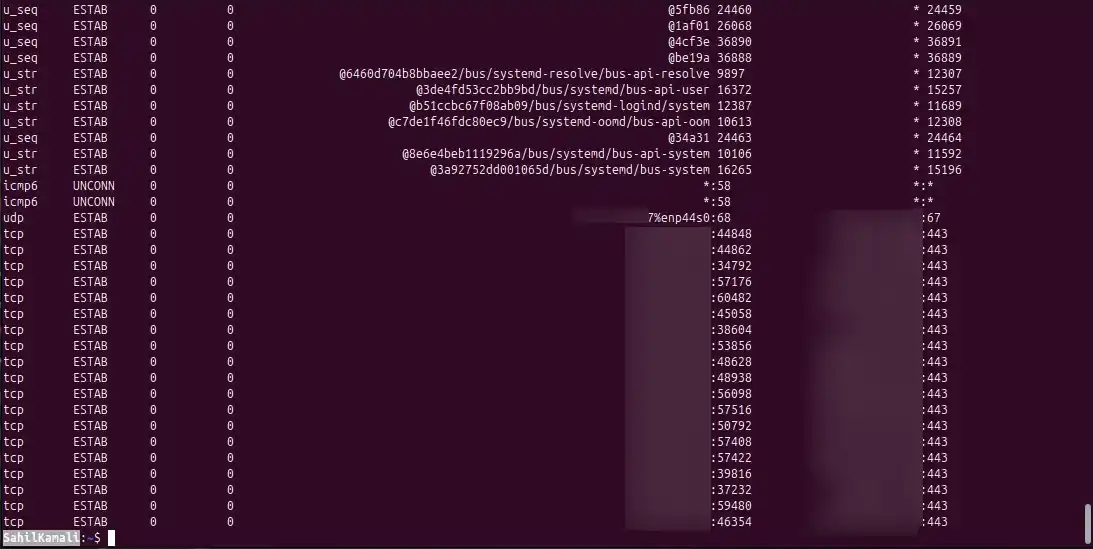
5. -n: Show Numerical Output
Displays IP addresses and port numbers numerically without resolving hostnames. This speeds up the command output, avoids DNS lookup delays and is useful for quick scripting or when monitoring high-traffic servers. Also makes it easier to match sockets to firewall rules or IP-based configurations.
**Command:
ss -n
**Output:
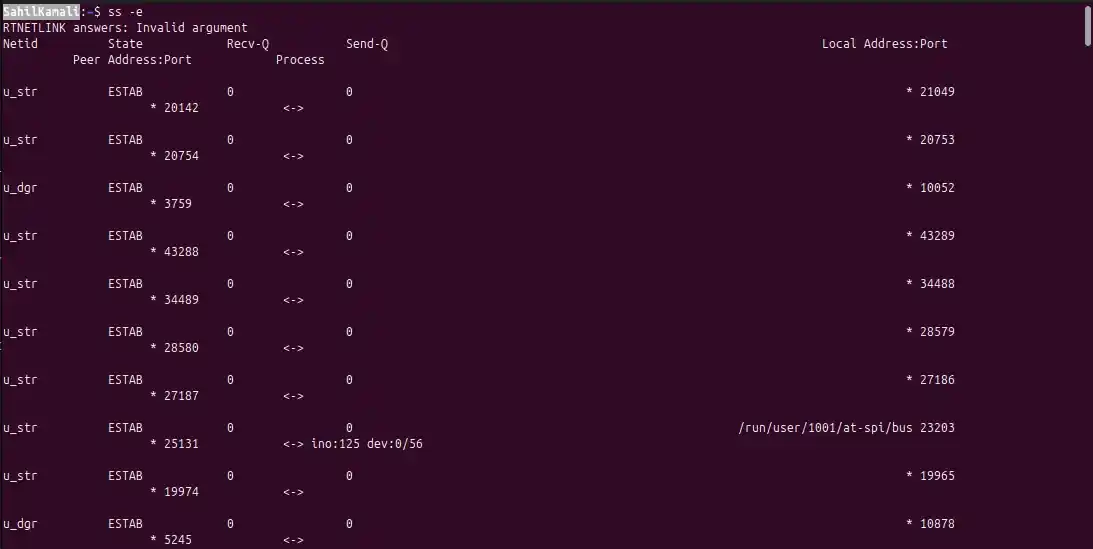
6. -e: Extended Information
Displays additional details about each socket, including user ID, inode and other internal flags. Useful for auditing which users or processes own specific connections and for diagnosing security or permission issues.
**Command:
ss -e
**Output:
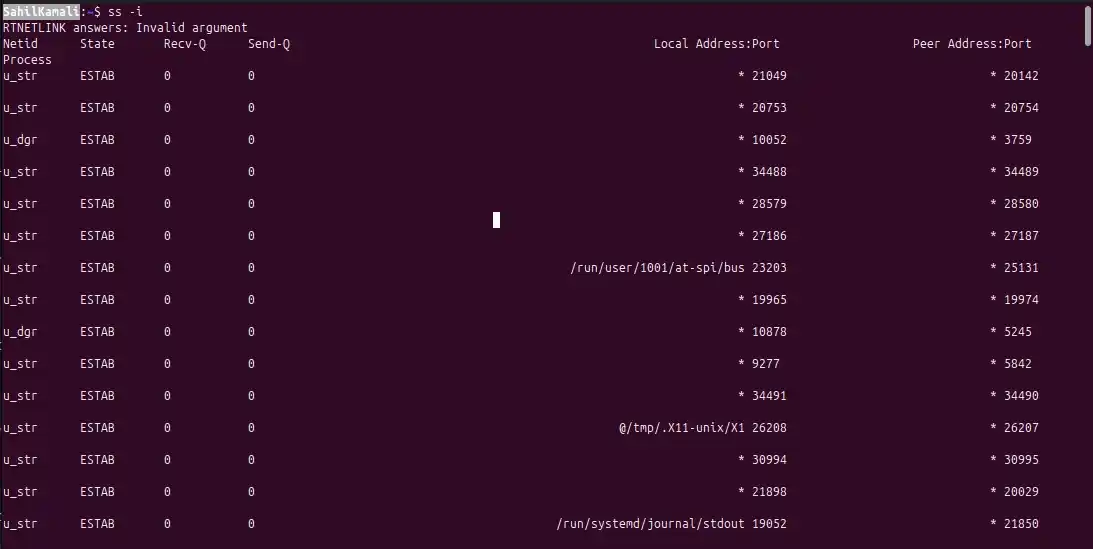
7. -i: Internal Information
Shows internal TCP information, such as retransmissions, congestion window size and timer data. Helpful for debugging TCP performance issues, slow connections or packet loss.
**Command:
ss -i
**Output:
8. -p: Show Process Information
Displays the process name and PID associated with each socket. Useful for identifying which applications are using network connections, aiding in monitoring or troubleshooting.
**Command:
ss -p
**Output:
State Recv-Q Send-Q Local Address:Port Peer Address:Port Process
ESTAB 0 0 192.168.1.10:22 192.168.1.5:53412 sshd(pid=1023)
LISTEN 0 128 0.0.0.0:80 0.0.0.0:* nginx(pid=2045)
9. -s: Summary Statistics
Provides a concise summary of all socket types, including counts of TCP, UDP and RAW sockets along with their states. Helps quickly assess the network load or detect abnormal connection patterns.
**Command:
ss -s
**Output:
Total: 12 (kernel 0)
TCP: 5 (estab 3, closed 0, orphaned 0, timewait 1)
UDP: 4
RAW: 3
10. -r: Display Routing Table
Shows the kernel routing table, including destination, gateway and interface information. Useful for verifying network routes, diagnosing connectivity issues and checking default gateways.
**Command:
ss -r
**Output:
Destination Gateway Genmask Flags Iface
0.0.0.0 192.168.1.1 0.0.0.0 UG eth0
192.168.1.0 0.0.0.0 255.255.255.0 U eth0
Advanced Filtering and Display Options:
The 'ss' command offers more advanced options for filtering and customizing the displayed socket information.
1. Filter by Port
To display sockets for a specific source port (e.g., port 80)
**Command:
ss sport = :80
- This command, for example, displays sockets with a source port of 80. It's useful for pinpointing connections related to a particular service or port.
2. Display IPv6 Sockets
To include IPv6 sockets in your view
**Command:
ss -6
- This allows monitoring of IPv6 traffic alongside IPv4, which is essential for dual-stack network environments.
3. Display Summary Statistics
For a quick overview of network connections and their states
**Command:
ss -s
- Provides counts of TCP, UDP and RAW sockets and their respective states, giving insight into overall network usage and potential congestion points.
Real-World Examples
Example 1: Display TCP Connections to Port 22 (SSH)
This command shows all TCP connections with a source port of 22, typically used for SSH. It helps administrators identify active SSH sessions and monitor secure access to the system.
**Command:
ss -t sport = :22
Example 2: Show UDP Listening Ports
Lists all UDP sockets in the listening state, which is useful for checking open UDP services like DNS or NTP.
**Command:
ss -ul
Example 3: Display Summary Statistics for TCP and UDP
Provides a summarized overview of TCP and UDP socket types, showing counts for established, listening or closed connections. This is useful for quickly assessing network load or spotting unusual traffic patterns.
**Command:
ss -s -t -u
Efficiency of ss Compared to netstat
The ss command is significantly faster and more efficient than the traditional netstat, making it ideal for modern Linux systems, especially those with a large number of connections.
- **Traditional netstat: Works by reading and parsing large text files in /proc (like /proc/net/tcp). On servers with tens of thousands of connections, this approach can be slow and CPU-intensive.
- **Modern ss: Communicates directly with the Linux kernel using the netlink socket, a binary protocol that retrieves only the requested data. This avoids parsing massive files and dramatically improves performance.
- **Performance Advantages: ss handles high-traffic servers efficiently, provides real-time socket statistics and can be combined with filtering options without significant delays.
- **Use Case: On busy servers, ss can produce connection lists almost instantly, whereas netstat may take several seconds or longer to display the same information.