top Command in Linux (original) (raw)
Last Updated : 14 May, 2026
The top command is a real-time system monitoring utility available on Linux systems. It presents a continuously updated view of running processes along with overall system resource usage such as CPU load, memory consumption, and system uptime.
- Displays a live list of running processes with resource consumption details
- Shows overall CPU usage, memory usage, and load averages
- Allows interactive process management from the terminal
- Updates system statistics continuously without restarting the command
Example: Run top Without Any Options
**Command:
top
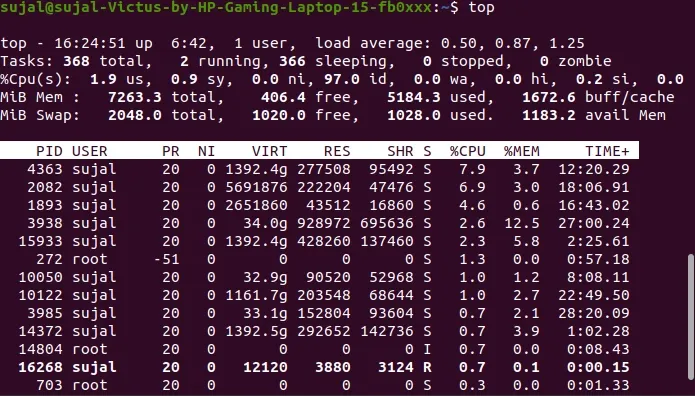
live view of system activity
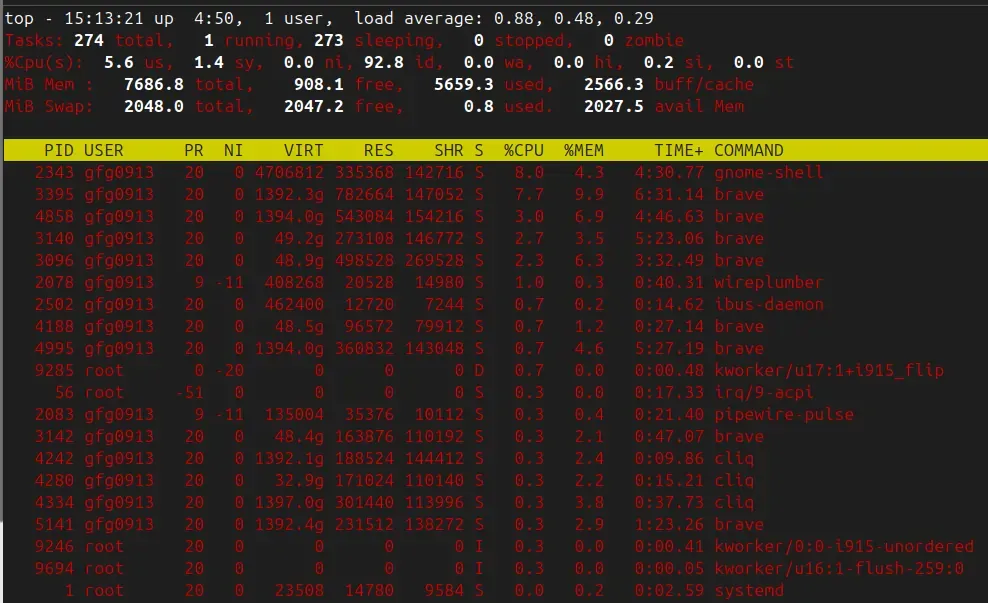
Running top without options starts the interactive monitoring interface. The display refreshes automatically and lists active processes along with CPU usage, memory usage, load averages, and system uptime. Press q to exit the interface.
Here,
- **PID: Shows task’s unique process id.
- **USER: User name of owner of task.
- **PR: The process’s priority. The lower the number, the higher the priority.
- **NI: Represents a Nice Value of task. A Negative nice value implies higher priority, and positive Nice value means lower priority.
- **VIRT: Total virtual memory used by the task.
- **RES: How much physical RAM the process is using, measured in kilobytes.
- **SHR: Represents the Shared Memory size (kb) used by a task.
- ****%CPU:** Represents the CPU usage.
- ****%MEM:** Shows the Memory usage of task.
- **TIME+: CPU Time, the same as ‘TIME’, but reflecting more granularity through hundredths of a second.
- **COMMAND: The name of the command that started the process.
Syntax:
top [options]
- **top: Starts the system monitoring utility in interactive mode.
- **[options]: Represents optional flags that modify the behavior or output of the command. These flags control aspects such as refresh behavior, process selection, and display format.
Interpreting top Command Output
The top command output is divided into several sections, each with specific information about system performance and processes. This section provides a breakdown of the output based on the information it shows.
1. Uptime / Summary
When you first open the top command, the initial line, often referred to as the header or summary line, displays information similar to what you see when you use the uptime command. It shows:
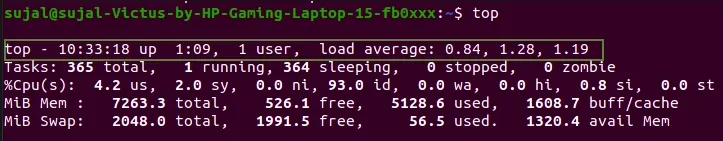
- **System Time: The current time on the system.
- **Uptime: How long the system has been running since the last boot.
- **Users: The number of users currently logged into the system.
- **Load Average: This is shown in three numbers separated by commas. These numbers represent the average number of processes waiting for CPU time over the last 1 minute, 5 minutes, and 15 minutes, respectively. A value of 1.0 means the system's CPU is fully utilized for a single core ; higher values indicate potential overloading.
2. Tasks
The Tasks section provides an overview of all processes currently managed by the system. It categorizes them based on their state.
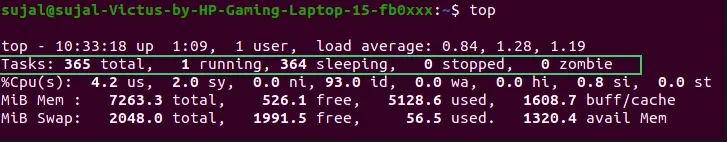
- **total: Indicates the total count of processes currently being tracked by the system.
- **running: Represents the number of processes currently actively using CPU time.
- **sleeping: Refers to processes that are currently idle and waiting for a signal to wake up.
- **stopped: Denotes processes that have been manually stopped, typically through a signal.
- **zombie: Indicates processes that have completed execution but still have an entry in the process table.
3. %Cpu(s)
The %CPU line shows how the CPU time is distributed across different types of tasks. This helps in identifying which activities are consuming CPU resources.
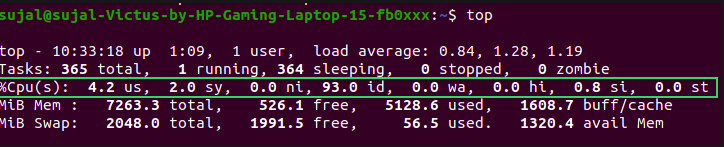
- **us: Percentage of CPU time spent running user processes.
- **sy: Percentage of CPU time spent running kernel (system) processes.
- **ni: Percentage of CPU time spent running processes with a nice value (priority adjusted).
- **id: Percentage of CPU time spent idle (no work being done).
- **wa: Percentage of CPU time spent waiting for I/O operations to complete.
- **hi: Percentage of CPU time spent servicing hardware interrupts.
- **si: Percentage of CPU time spent servicing software interrupts.
- **st: Percentage of CPU time stolen from this virtual machine by the hypervisor (if virtualized).
4. Memory (MiB Mem)
The MiB Mem line provides detailed information about the system's physical memory (RAM) usage. It helps in understanding how memory is allocated and used by processes and the system.
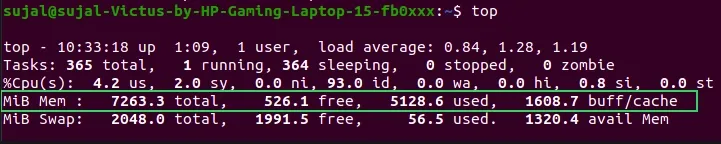
- **total: Total amount of physical memory (RAM) available in MiB.
- **used: Amount of RAM currently in use by processes and the kernel.
- **free: Amount of RAM not in use.
- **buff/cache: Amount of memory used for buffering data and caching filesystems.
5. Swap (MiB Swap)
The MiB Swap line shows information about swap space usage, which acts as overflow memory when RAM is full. Monitoring swap helps identify memory pressure on the system.
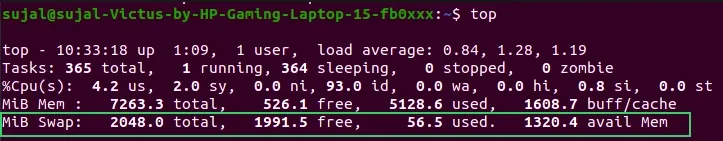
- **total: Total amount of swap space available in MiB.
- **used: Amount of swap space currently in use.
- **free: Amount of swap space that is not being used.
- **available: Estimate of how much memory is available for starting new applications without swapping.
Common Options Used in top Command
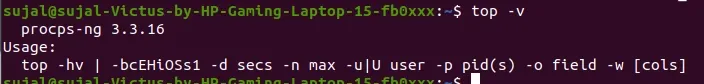
-v (Display Version Information)
The -v option prints the installed version of the top utility and exits immediately.
**Syntax:
top -v or top --version
**Example:
top -v
**Output:
Output
-p (Monitor a Specific Process by PID)
The -p option limits the display to only the process or processes you choose by their Process ID (PID). Other running processes will not appear.
**Syntax:
top -p
**Example:
top -p 7760
**Output:
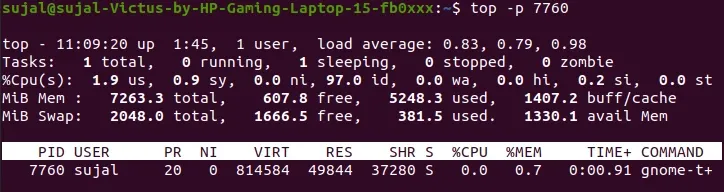
Output
-M (Set Memory Display Unit)
The -M option changes the unit used to display memory in top. By default, memory may be shown in kilobytes, but this option allows switching between kilobytes, megabytes, or gigabytes.
**Syntax:
top -M [k or m or g]
- **-M: selects the memory unit
- **m: displays memory in megabytes
- **k: displays memory in KB
- **g: displays memory in GB
**Example:
top -M k
Displays memory usage in kilobytes
**Note: The -M option is available in some versions of top, particularly in older or alternative implementations (like on BSD or in older procps versions)
-b (Batch Mode for Logging or Scripts)
The -b option runs top in batch mode, which outputs the data in a plain text format instead of the interactive interface. This is useful for saving or processing the output in scripts.
**Syntax:
top -b [options]
**Example:
top -b -n 1
- **-b: Enables batch mode
- **-n 1: Tells top to update only once and then exit
**Output:
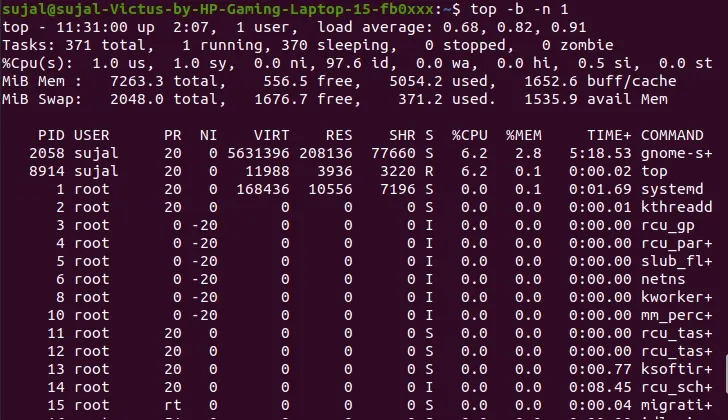
Output
-1 (Show CPU Usage Per Core)
The -1 option displays CPU usage for each individual core instead of showing an overall average.
**Syntax:
top -1
**Example:
top -1
**Output:
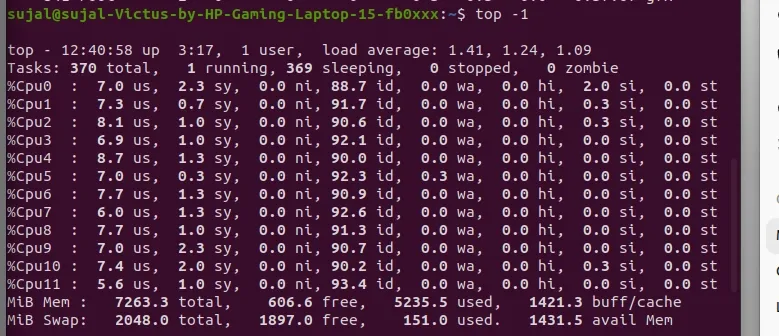
Output
-h (Display Help Information)
The -h option prints help information about top options and usage, then exits.
**Syntax:
top -h
**Example:
top -h
**Output:
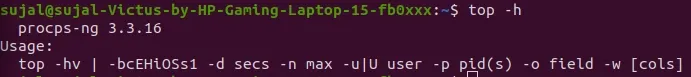
Output
Interactive Keys in top
The top command supports several interactive keys to manage processes, adjust display, and sort information while it is running. These keys allow real-time control without restarting the command.
k (Kill a Process)
The k key in the interactive top interface allows terminating a running process by specifying its PID.
**Steps:
- Press k while top is running
- Enter the PID of the process to terminate
- Press Enter to confirm
**Example:
top PID to Kill = 1869
**Output:
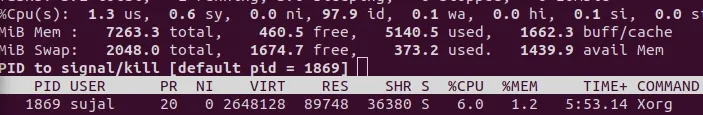
Output
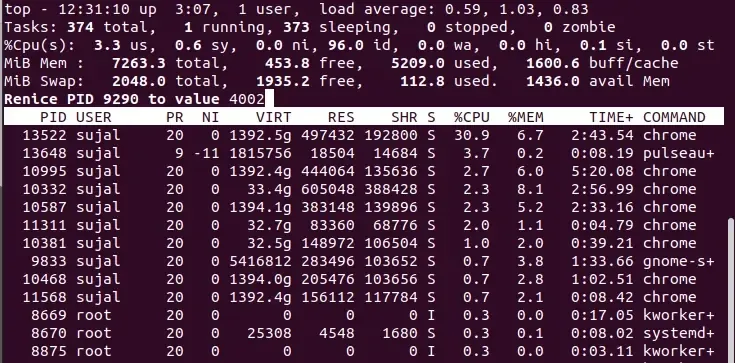
r (Change Process Priority / Renice)
The r key in the interactive top interface allows adjusting the priority (nice value) of a running process, which affects CPU scheduling.
**Steps:
- Press r while top is running
- Enter the PID of the process
- Enter the new nice value (lower = higher priority)
**Example:
top PID to renice : 9 nice values range from -20 to 19
**Output:
Output
z (Toggle Color/Highlighting)
Enables color coding of processes to improve readability and quickly identify resource-intensive processes.
**Steps:
- Press z while top is running
Output
q (Quit Top Interface)
Exits the top interactive interface immediately and returns to the terminal prompt.
**Steps:
- While top is running, press q
Alternate Example:
sudo apt install htop htop
**Output:
Output
Other Useful Command Options using in top command
**1) Exit Top Command After Specific repetition:
Top output keeps refreshing until you press ‘q‘. With below command top command will automatically exit after 10 number of repetition.
top -n 10
**2) Display Specific User Process
top -u paras
**3) Highlight Running Process in Top: Press ‘z‘ option in running top command will display running process in color which may help you to identified running process easily.
**4) Shows Absolute Path of Processes: Press ‘c‘ option in running top command, it will display absolute path of running process.
**5) Sort by CPU Utilisation: Press (Shift+P) to sort processes as per CPU utilization.
**6) Secure Mode: Use top in Secure mode.
top -s
**7) Command Line: The below command starts top with last closed state.
top -c
**8) Delay time: It tells delay time between screen updates.
top -d seconds.tenths
**9) Color and Highlighting: using the z key toggles color and highlighting of the process list. This feature enhances visibility by color-coding different aspects of the processes, such as CPU usage, memory consumption, and process states (running, sleeping, etc.). It helps users quickly identify resource-intensive processes or anomalies in system behavior.
**10) Alert Display Mode: Pressing the A key toggles the alternative display mode. This mode rearranges the display to show multiple windows, each focusing on different aspects of system performance, such as CPU usage, memory, and processes.
Comprehensive System Monitoring with Glances on Linux
Glances in Linux is a system monitoring tool that provides:
- **Overview Dashboard: Displays real-time statistics on CPU, memory, disk, network, and processes.
- **Process Table: Lists detailed information about running processes, including CPU and memory usage.
- **Alerts and Notifications: Alerts users about critical system metrics exceeding predefined thresholds.
- **Plugins and Extensions: Supports various plugins for additional monitoring capabilities, such as Docker and SNMP.
- **Interactive UI: Offers an interactive command-line interface or a web-based interface for monitoring multiple systems remotely.
Alternatives to top for System Monitoring
While top is useful, several other tools provide enhanced features, interactivity, or historical data tracking.
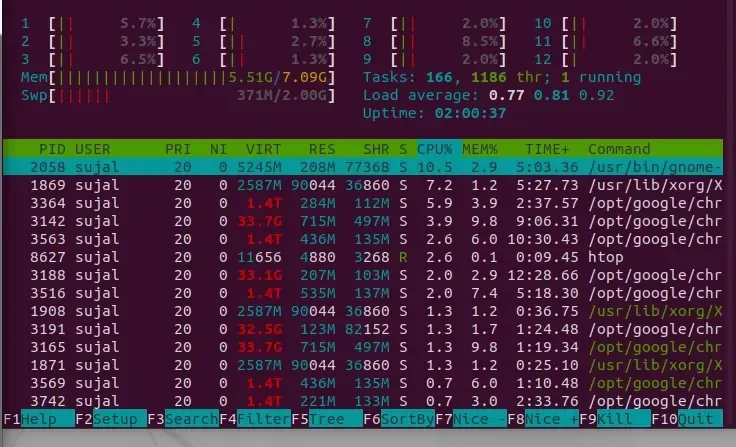
- **htop: An interactive and visually appealing process viewer with color-coding, easy navigation, and process management features.
- **Glances: A cross-platform monitoring tool that provides a comprehensive view of system performance, including CPU, memory, disk I/O, and network usage.
- **nmon: A performance monitoring tool designed for AIX and Linux systems, offering detailed statistics and a user-friendly interface.
- **atop: An advanced system and process monitor that provides detailed resource consumption for both current and historical data, including CPU, memory, disk, and network usage.
- **dstat: A versatile resource statistics tool that combines the functionality of vmstat, iostat, netstat, and ifstat into a single command, offering real-time performance monitoring.
- **sar: Part of the sysstat package, it collects and reports on various system activity statistics, including CPU, memory, and I/O usage, with the ability to save data for historical analysis.