Augmented DickeyFuller (ADF) (original) (raw)
Augmented Dickey-Fuller (ADF)
Last Updated : 23 Jul, 2025
Augmented Dickey-Fuller (ADF) test is a statistical test in time series analysis used to determine whether a given time series is stationary. A stationary time series has constant mean and variance over time, which is a core assumption in many time series models, including ARIMA.
Why Stationarity Matters?
In time series modeling, stationarity ensures that the model's performance is consistent over time. Non-stationary data can produce misleading forecasts and incorrect inferences. That’s why one of the first steps in time series analysis is testing for stationarity and that's where the ADF test comes in.
Basics of the ADF Test
The Augmented Dickey-Fuller test is an extended version of the Dickey-Fuller test. It tests the null hypothesis that a unit root is present in a time series sample. The presence of a unit root means the series is non-stationary.
Null and Alternative Hypotheses:
- **Null Hypothesis (H₀): The series has a unit root (non-stationary)
- **Alternative Hypothesis (H₁): The series is stationary
Mathematical Formulation
The ADF test uses the following regression model:
\Delta y_t = \alpha + \beta t + \gamma y_{t-1} + \sum_{i=1}^p \theta_i \Delta y_{t-i} + \epsilon_t
If the test statistic is less than the critical value, we reject the null hypothesis, concluding the series is stationary.
Implementing ADF in Python
Python `
import pandas as pd import numpy as np from statsmodels.tsa.stattools import adfuller
Simulated non-stationary data (random walk)
np.random.seed(0) data = np.random.normal(0, 1, 100).cumsum() series = pd.Series(data)
Perform ADF test
result = adfuller(series)
print("ADF Statistic:", result[0]) print("p-value:", result[1]) print("Critical Values:") for key, value in result[4].items(): print(f" {key}: {value}")
`
**Output:
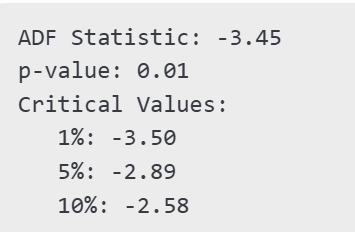
ADF Result
Interpreting the Results
- **ADF Statistic: If it's significantly lower than the critical values, reject the null.
- **p-value: If p < 0.05, the series is likely stationary.
- **Critical Values: Used for comparing with the ADF statistic.
Since -3.45 < -2.89 (5% level), and p-value < 0.05, the series is likely stationary.
Visualizing Stationarity
Visual inspection can help support ADF results. You can visualize the rolling mean and standard deviation:
Python `
import matplotlib.pyplot as plt
rolling_mean = series.rolling(window=12).mean() rolling_std = series.rolling(window=12).std()
plt.plot(series, label='Original') plt.plot(rolling_mean, label='Rolling Mean') plt.plot(rolling_std, label='Rolling Std') plt.legend() plt.title('Rolling Statistics') plt.show()
`
**Output
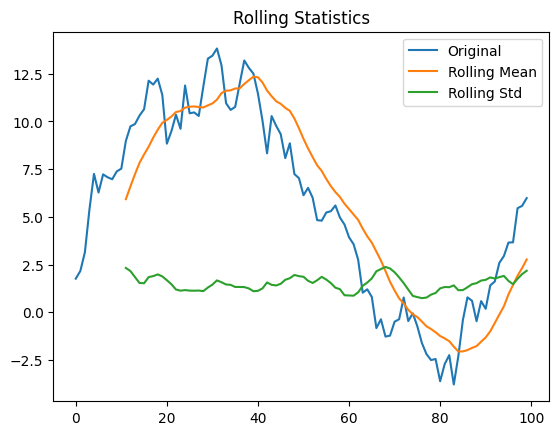
Rolling statistics
ADF vs Other Stationarity Tests
| Test Name | Handles Trends | Handles Seasonality | Notes |
|---|---|---|---|
| ADF | Yes | No | Most commonly used test |
| KPSS | Yes | No | Null hypothesis: stationary |
| Phillips-Perron | Yes | No | More robust to heteroskedasticity |
Use Case: Making Data Stationary
If the ADF test shows that a series is non-stationary, apply transformations:
- **Differencing: differenced = series.diff().dropna()
- **Log Transformation: log_series = np.log(series)
- **Seasonal Differencing: seasonal_diff = series.diff(12).dropna()
Real-World Applications
- **Economics: GDP, unemployment, inflation trends
- **Finance: Stock prices, returns, interest rates
- **Weather: Temperature anomalies
- **Healthcare: Time-series of hospital admissions or disease cases
- **Energy: Electricity consumption or production forecasting
Limitations of ADF Test
- **Low Power: The test may not detect stationarity in small samples.
- **Structural Breaks: Not suitable for series with structural changes.
- **Sensitive to Lag Length: Poor choice of lag can lead to incorrect results.