Compute Classification Report and Confusion Matrix in Python (original) (raw)
Last Updated : 23 Jul, 2025
Classification Report and Confusion Matrix are used to check machine learning model's performance during model development. These help us understand the accuracy of predictions and tells areas of improvement. In this article, we will learn how to compute these metrics in Python using a simple example.
Understanding the Classification Report and Confusion Matrix
The **Classification Report summarizes the performance of a classification model. It includes key metrics such as:
- **Precision : Measures the accuracy of positive predictions.
- **Recall : Indicates how many actual positives were correctly identified.
- **F1-Score : Balances precision and recall into a single score.
- **Support : Shows the number of samples for each class.
These metrics help us understand how well the model performs for each class.
**Confusion Matrix is a table that compares the model's predictions against the actual values. It highlights where the model succeeds and where it makes mistakes. For a binary classification problem like "Yes" or "No" the confusion matrix looks like this:
| PREDICTED YES | PREDICTED NO | |
|---|---|---|
| Actual Yes | True Positive | False Negative |
| Actual No | False Negative | True Negative |
- **True Positive (TP) : Correctly predicted as "Yes."
- **False Negative (FN) : Incorrectly predicted as "No" when it was actually "Yes."
- **False Positive (FP) : Incorrectly predicted as "Yes" when it was actually "No."
- **True Negative (TN) : Correctly predicted as "No".
This matrix helps identify patterns in errors and evaluate overall accuracy.
Step-by-Step Guide to Compute Metrics in Python
We will use Python and the scikit-learn library to compute the Classification Report and Confusion Matrix.
Step 1: Import Necessary Libraries
We need to import the required library scikit learn.
Python `
from sklearn.metrics import classification_report, confusion_matrix from sklearn.model_selection import train_test_split from sklearn.linear_model import LogisticRegression from sklearn.datasets import load_iris
`
Step 2: Load Dataset
We’ll use the **Iris dataset which contains data about flowers and their species.
Python `
data = load_iris()
X = data.data
y = data.target
`
Step 3: Split Data into Training and Testing Sets
To evaluate the model on unseen data we split the dataset into 70% training data and 30% testing data.
Python `
X_train, X_test, y_train, y_test = train_test_split(X, y, test_size=0.3, random_state=42)
`
Step 4: Train a Model
We’ll use logistic regression for classification.
Python `
model = LogisticRegression(max_iter=200) model.fit(X_train, y_train)
`
**Output:
Model Training
Step 5: Make Predictions
After training the model we use it to predict labels for the test data.
Python `
y_pred = model.predict(X_test)
`
Step 6: Compute the Confusion Matrix
Now let’s calculate the confusion matrix to analyze the results.
Python `
conf_matrix = confusion_matrix(y_test, y_pred) print("Confusion Matrix:") print(conf_matrix)
`
**Output:
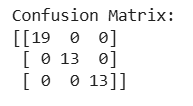
Confusion matrix
This means:
- For class 0 (Setosa) all predictions were correct.
- For class 1 (Versicolor) there was 1 false negative.
- For class 2 (Virginica) there was 1 false positive.
Step 7: Generating the Classification Report
Finally let’s generate the classification report to get detailed performance metrics.
Python `
class_report = classification_report(y_test, y_pred, target_names=data.target_names) print("Classification Report:") print(class_report)
`
**Output:
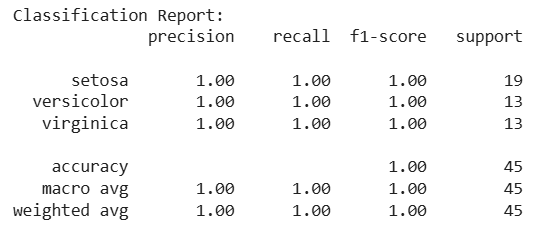
Classification report
This above classification report shows that the model performs good with high precision, recall and F1-scores across all classes. You can easily compute Classification Report and Confusion Matrix using the scikit-learn Python library.