Data Prediction using Decision Tree of rpart (original) (raw)
Last Updated : 23 Jul, 2025
Decision trees are a popular choice due to their simplicity and interpretation, and effectiveness at handling both numerical and categorical data. The rpart (Recursive Partitioning) package in R specializes in constructing these trees, offering a robust framework for building predictive models.
Overview of rpart
rpart stands for Recursive Partitioning and is a versatile tool in R for creating decision trees. It builds models based on a set of binary rules, splitting the data recursively to maximize the homogeneity of the resulting subgroups. This process is useful for both regression and classification tasks, making it highly versatile.
Setting Up rpart
To set up a decision tree using rpart, you need:
- **A properly formatted dataset: Ensure no missing values or factor variables with unused levels.
- **A formula specifying the model: This formula determines which variable is predicted and which variables are used as predictors.
Parameters such as method, minsplit, cp, and maxdepth, which control the complexity and performance of the tree. Now we will discuss Step-by-Step Breakdown of the Data Prediction in R Programming Language.
Step 1: Load the Necessary Library
Loads the rpart package, which is required to build decision tree models. If rpart is not installed, you would need to install it using install.packages("rpart").
R `
library(rpart)
`
Step 2: Load the Dataset
Loads the built-in Iris dataset. This dataset includes four features (Sepal.Length, Sepal.Width, Petal.Length, Petal.Width) and a target variable (Species).
R `
data(iris) head(iris)
`
**Output:
Sepal.Length Sepal.Width Petal.Length Petal.Width Species
1 5.1 3.5 1.4 0.2 setosa
2 4.9 3.0 1.4 0.2 setosa
3 4.7 3.2 1.3 0.2 setosa
4 4.6 3.1 1.5 0.2 setosa
5 5.0 3.6 1.4 0.2 setosa
6 5.4 3.9 1.7 0.4 setosa
Step 3: Build the Decision Tree Model
Now we will Build the Decision Tree Model.
R `
model <- rpart(Species ~ Sepal.Length + Sepal.Width + Petal.Length + Petal.Width, data=iris, method="class")
`
- **Formula: Species ~ Sepal.Length + Sepal.Width + Petal.Length + Petal.Width. This formula specifies that the Species is the dependent variable, and the four measurements are the independent variables.
- **Data: Specifies the dataset (iris) to use for the model.
- **Method: "class" indicates that the task is a classification. It instructs rpart to treat the Species variable as a categorical outcome.
Step 4: Plot the Decision Tree
Now we will plot the Decision Tree.
R `
plot(model) text(model, use.n=TRUE)
`
**Output:
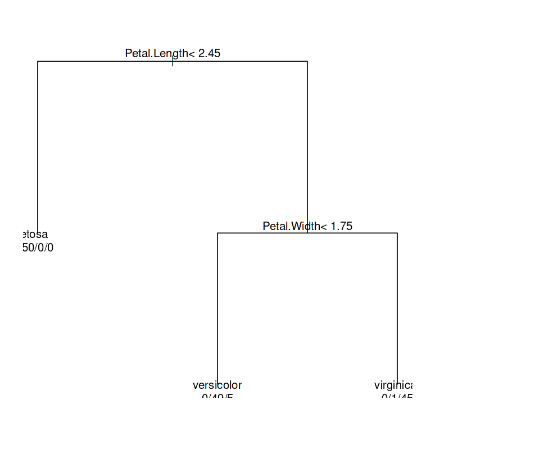
Decision Tree
- **plot(model): Draws the basic structure of the tree.
- **text(model, use.n=TRUE): Annotates the tree with node numbers, allowing you to see how many data points end up in each leaf of the tree.
Step 5: Create New Data for Prediction
Now we will Create New Data for Prediction.
R `
new_data <- data.frame(Sepal.Length=5.5, Sepal.Width=3.5, Petal.Length=1.4, Petal.Width=0.2)
`
**Values: The measurements provided are hypothetical and are used to demonstrate how the model performs predictions.
Step 6: Make Predictions
R `
prediction <- predict(model, new_data, type="class")
print(prediction)
`
**Output:
1 setosa
Levels: setosa versicolor virginica
- **model: The decision tree model built in step 3.
- **new_data: The new data point defined in step 5.
- **type="class": Specifies that the prediction should return the class (species) rather than probabilities.
Conclusion
The rpart package in R offers a user-friendly yet powerful approach to building decision trees, making it a valuable tool for both novice and experienced data scientists. By following the steps outlined in this article and adhering to best practices, one can effectively utilize decision trees to make reliable predictions and gain insights from various types of data. Whether you are performing a straightforward classification task or tackling more complex predictive modeling challenges, rpart provides the necessary tools to achieve accurate and interpretable results.