Dynamic Time Warping (DTW) in Time Series (original) (raw)
Last Updated : 1 May, 2025
**Dynamic Time Warping (DTW) is an algorithm used to compare two time-based datasets (like two sequences of numbers) to find similarities. It does this by adjusting the timings of the data points to minimize the difference between the two datasets. Compared to simple methods such as **Euclidean distance, which are only effective when the sequences are equal in length and perfectly aligned, DTW can be used to compare sequences of unequal lengths and out-of-sync sequences. This quality has made DTW extremely useful in **speech recognition, **gesture analysis, and **finance, where timing difference is very often observed.
This article explores the concept of DTW, its working mechanism, advantages, applications, and how it stands out as a tool in time seriesanalysis_****.**_
How Does DTW Work?
Step 1: Distance Matrix Construction
The first step in DTW involves **constructing a distance matrix between the two sequences. Each matrix element represents the distance (typically Euclidean) between corresponding points in the two sequences.
Step 2: Cost Matrix and Accumulated Cost
Next, a **cost matrix is created by accumulating the minimum distances from the start of the sequences to the current point. This accumulated cost represents the optimal path's cumulative distance up to that point.
Step 3: Optimal Path Finding
The optimal alignment path is found by tracing back from the last element in the cost matrix to the first element. This path represents the best alignment between the two sequences, minimizing the total distance.
Step 4: Warping Path
The warping path shows how one sequence can be warped (stretched or compressed) along the time axis to match the other sequence best.
Mathematical Formulation
Given two sequences A = \{a_1, a_2, \dots, a_n\} and B = \{b_1, b_2, \dots, b_m\}, where a_i and b_j are elements of the sequences A and B, respectively, DTW computes the minimum cumulative distance between them.
- **Cost Matrix: Define a cost matrix C of sizen \times m, where C(i, j) represents the cost (or distance) of aligning a_i with b_j. The cost is typically calculated using a distance metric, such as the Euclidean distance:
- C(i, j) = \text{distance}(a_i, b_j) = |a_i - b_j|
- **Accumulated Cost Matrix: Construct an accumulated cost matrix D where each element D(i, j) represents the minimum cumulative cost to align the first iii elements of A with the first j elements of B:
- D(i, j) = C(i, j) + \min \begin{cases} D(i-1, j) \\ D(i, j-1) \\ D(i-1, j-1) \end{cases}
- Here,
* D(i-1, j) corresponds to an insertion,
* D(i, j-1) corresponds to a deletion
* D(i-1, j-1) corresponds to a match (or diagonal move).
- **Boundary Conditions: The boundary conditions are initialized as follows:
- D(1,1)=C(1,1) \\ D(i,1)=D(i−1,1)+C(i,1) \quad \text{for} i=2,…,n \\ D(1,j)=D(1,j−1)+C(1,j) \quad \text{for} j=2,…,m
- **Optimal Warping Path: The optimal warping path W = \{(i_1, j_1), (i_2, j_2), \dots, (i_L, j_L)\} is a sequence of matrix indices that minimizes the cumulative distance. This path is found by backtracking from D(n, m) to D(1, 1) by following the minimum cost direction at each step. The overall DTW distance is given by: \text{DTW}(A, B) = D(n, m)
Implementing DTW in Python
Let's choose two different stocks, such as **Tesla (TSLA) and **Amazon (AMZN), and calculate the Dynamic Time Warping (DTW) distance between their stock price time series. We will follow the same steps as before, including fetching the data, handling any potential issues, and calculating the DTW distance.
Step 1: Importing the Libraries
Python `
import pandas as pd import yfinance as yf import numpy as np from dtaidistance import dtw import matplotlib.pyplot as plt
`
Step 2: Fetch Time Series Data
We'll fetch historical stock price data for Tesla (TSLA) and Amazon (AMZN) over the past year.
Python `
ticker_1 = yf.Ticker("TSLA") ticker_2 = yf.Ticker("AMZN")
data_1 = ticker_1.history(period="1y") data_2 = ticker_2.history(period="1y")
series_1 = data_1['Close'].values series_2 = data_2['Close'].values
`
Step 3: Handle Missing Data and Alignment
We'll ensure both time series are of the same length and handle any potential missing data.
Python `
print("Missing values in TSLA series:", np.isnan(series_1).sum()) print("Missing values in AMZN series:", np.isnan(series_2).sum())
series_1 = pd.Series(series_1).ffill().values series_2 = pd.Series(series_2).ffill().values
min_length = min(len(series_1), len(series_2)) series_1 = series_1[:min_length] series_2 = series_2[:min_length]
`
**Output:
**Missing values in TSLA series: 0 **Missing values in AMZN series: 0
Step 4: Apply Dynamic Time Warping
Now, we'll calculate the DTW distance between the two stock price time series.
Python `
distance = dtw.distance(series_1, series_2) print(f"DTW distance between TSLA and AMZN: {distance}")
`
**Output:
**DTW distance between TSLA and AMZN: 1281.0151188633483
Step 5: Visualization
By visualizing it, we can easily understand our findings that we obtained from our data.
Python `
plt.figure(figsize=(10, 6)) plt.plot(data_1.index[:min_length], series_1, label="TSLA", color="blue") plt.plot(data_2.index[:min_length], series_2, label="AMZN", color="green") plt.title("Stock Price Comparison: TSLA vs AMZN") plt.xlabel("Date") plt.ylabel("Closing Price (USD)") plt.legend() plt.show()
`
**Output:
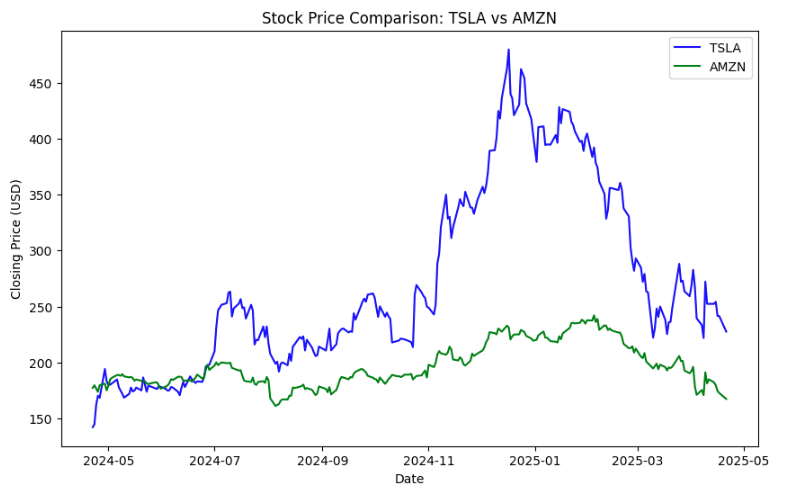
Stock Price Comparison using DTW
Advantages of DTW
- **Handling Different Lengths: DTW can compare sequences of different lengths, making it versatile for various applications where time series data may not be perfectly aligned.
- **Alignment of Complex Sequences: DTW is particularly useful in aligning complex sequences that may have local shifts in time, such as varying speech rates or irregular patterns in financial data.
- **Effective in Noisy Environments: DTW’s ability to warp time allows it to effectively compare sequences even in noisy environments where traditional methods might fail.
Applications of Dynamic Time Warping
- **Speech Recognition: DTW has been widely used in speech recognition to compare spoken words and identify similarities, even when words are spoken at different speeds.
- **Gesture Recognition: In gesture recognition, DTW helps align different gestures for comparison, even when performed at different speeds or with slight variations.
- **Financial Market Analysis: DTW can be applied to compare financial time series, such as stock prices, to detect patterns, correlations, or predict future movements.
- **Medical Diagnosis: In the medical field, DTW is used to align and compare biological signals, such as ECG or EEG readings, helping in the diagnosis of conditions by comparing patient data with reference models.
Limitations of DTW
- **Computational Complexity: DTW can be computationally intensive, especially with long sequences, as the algorithm’s complexity is quadratic in the length of the sequences.
- **Over-Warping: Without constraints, DTW might over-warp sequences, leading to unnatural alignments. Adding constraints like Sakoe-Chiba bands can mitigate this issue.
- **Sensitivity to Scaling: DTW does not inherently handle differences in amplitude or scaling between sequences, so pre-processing like normalization is often required.