KMode Clustering in Python (original) (raw)
Last Updated : 2 May, 2026
K-mode clustering is an unsupervised machine-learning algorithm used to group categorical data into k clusters (groups). The K-Modes clustering partitions the data into K mutually exclusive clusters. Unlike K-Means which uses distances between numbers K-Modes uses the number of mismatches between categorical values to decide how similar two data points are. For example:
- Data point 1: ["red", "small", "round"]
- Data point 2: ["blue", "small", "square"]
Here there are 2 mismatches (color and shape) so these two are not very similar.
When Should You Use K-Modes?
Use K-Modes when:
- Your dataset contains categorical variables like gender, color, brand etc.
- You want to group customers by product preferences
- You're analyzing survey responses Yes/No, Male/Female etc.
Working
Unlike hierarchical clustering KModes requires us to decide the number of clusters (K) in advance. Here's how it works step by step:
- **Start by picking clusters: Randomly select K data points from the dataset to act as the starting clusters these are called "modes".
- **Assign data to clusters: Check how similar each data point is to these clusters using the total number of mismatches and assign each data point to the cluster it matches the most.
- **Update the clusters: Find the most common value for each cluster and update the cluster centers based on this.
- **Repeat the process: Keep repeating steps 2 and 3 until no data points are reassigned to different clusters.
Let X be a set of categorical data objects of X = \begin{bmatrix} x_{11}, & ... & x_{1n}\\ ... & ... & ...\\ x_{n1},& ... & x_{nm} \end{bmatrix} that can be denoted as and the mode of Z is a vector Q = [q_{1},q_{2},...,q_{m}] then minimize
D(X,Q) = \sum_{i=1}^{n}d(X_{i},Q)
Apply dissimilarity metric equation for data objects
D(X,Q) = \sum_{i=1}^{n}\sum_{j=1}^{m}\delta(x_{ij},Q)
Suppose we want to K cluster Then we have Q = [q_{k1},q_{k2},....,q_{km}] \epsilon Q
C(Q) = \sum_{k=1}^{K}\sum_{i=1}^{n}\sum_{j=1}^{m}\delta(x_{ij},q_{kj})
Overall the goal of K-modes clustering is to minimize the dissimilarities between the data objects and the centroids (modes) of the clusters using a dissimilarity measure (number of mismatches) such as the Hamming distance.
Implementation of the k-mode clustering algorithm
K-Modes is a way to group categorical data into clusters. Here's how you can do it step-by-step in Python using just NumPy and Pandas.
**Step 1: Prepare Your Data
Start by defining your dataset. Each row is a data point and each column contains categorical values like letters or labels.
Python `
import numpy as np import pandas as pd
data = np.array([ ['A', 'B', 'C'], ['B', 'C', 'A'], ['C', 'A', 'B'], ['A', 'C', 'B'], ['A', 'A', 'B'] ])
`
**Step 2: Set Number of Clusters
Decide how many groups you want to divide your data into.
Python `
k = 2
`
**Step 3: Pick Starting Points (Modes)
Randomly choose k rows from the data to be the starting cluster centers.
Python `
np.random.seed(0) modes = data[np.random.choice(data.shape[0], k, replace=False)]
`
**Step 4: Assign Data to Clusters
For each data point, count how many features are different from each mode. Assign the point to the most similar cluster.
Python `
clusters = np.zeros(data.shape[0], dtype=int)
for _ in range(10):
for i, point in enumerate(data):
distances = [np.sum(point != mode) for mode in modes]
clusters[i] = np.argmin(distances)
`
**Step 5: Update Cluster Modes
After assigning all points update each cluster’s mode to the most common values in that cluster.
Python `
for j in range(k):
    if np.any(clusters == j):
        modes[j] = pd.DataFrame(data[clusters == j]).mode().iloc[0].values
`
**Step 6: View Final Results
Print out which cluster each data point belongs to and what the final cluster centers (modes) are.
Python `
print("Cluster assignments:", clusters) print("Cluster modes:", modes)
`
**Output:
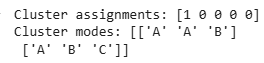
K-Mode Clustering
The output shows that the first data point belongs to cluster 1 and the rest belong to cluster 0. Each cluster has a common pattern: cluster 0 has mode values ['A', 'A', 'B'] and cluster 1 has ['A', 'B', 'C']. These modes represent the most frequent values in each cluster and are used to group similar rows together.
Cluster with kmodes Library
pip install kmodes
**Optimal number of clusters in the K-Mode algorithm
**Elbow method is used to find the optimal number of clusters
Python `
import pandas as pd import numpy as np
!pip install kmodes
from kmodes.kmodes import KModes import matplotlib.pyplot as plt %matplotlib inline
cost = [] K = range(1,5) for k in list(K): kmode = KModes(n_clusters=k, init = "random", n_init = 5, verbose=1) kmode.fit_predict(data) cost.append(kmode.cost_)
plt.plot(K, cost, 'x-') plt.xlabel('No. of clusters') plt.ylabel('Cost') plt.title('Elbow Curve') plt.show()
`
**Outputs:
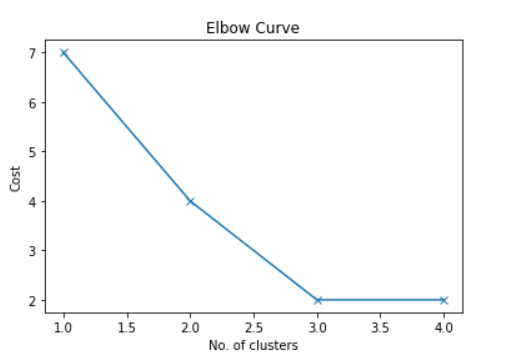
Elbow Method
As we can see from the graph there is an elbow-like shape at 2.0 and 3.0 Now it we can consider either 2.0 or 3.0 cluster. Let's consider Number of cluster =2.0
Python `
kmode = KModes(n_clusters=2, init = "random", n_init = 5, verbose=1) clusters = kmode.fit_predict(data) clusters
`
**Outputs :
array([1, 0, 1, 1, 1], dtype=uint16)
This also shows that the first, third, fourth and fifth data points have been assigned to the first cluster and the second data points have been assigned to the second cluster. To find the best number of groups we use the Elbow Method which helps us see when adding more groups doesn't make a big difference.